
 Jablonski Plots
An easy way to plot publication-ready Jablonski diagrams

Installation
Jablonski Plots can be easily installed from pip.
pip install jablonski-plots
Alternatively, it is possible to clone this repository
git clone git@github.com:leonardo-diciano/Jablonski-Plots.git
and the program can be run directly or through a python interpreter, no installation is needed.
./jablonski-plots.py
python jablonski-plots.py
The cloned Jablonski Plots directory may be added to the system PATH, for a quicker start.
export $PATH:"your_file_path/Jablonski-Plots/:$PATH"
#Then, to execute it, just type the program name from anywhere in your computer
jablonski-plots.py
The required libraries are:
- PyQt6;
- numpy;
- pyqtgraph.
Usage and Features
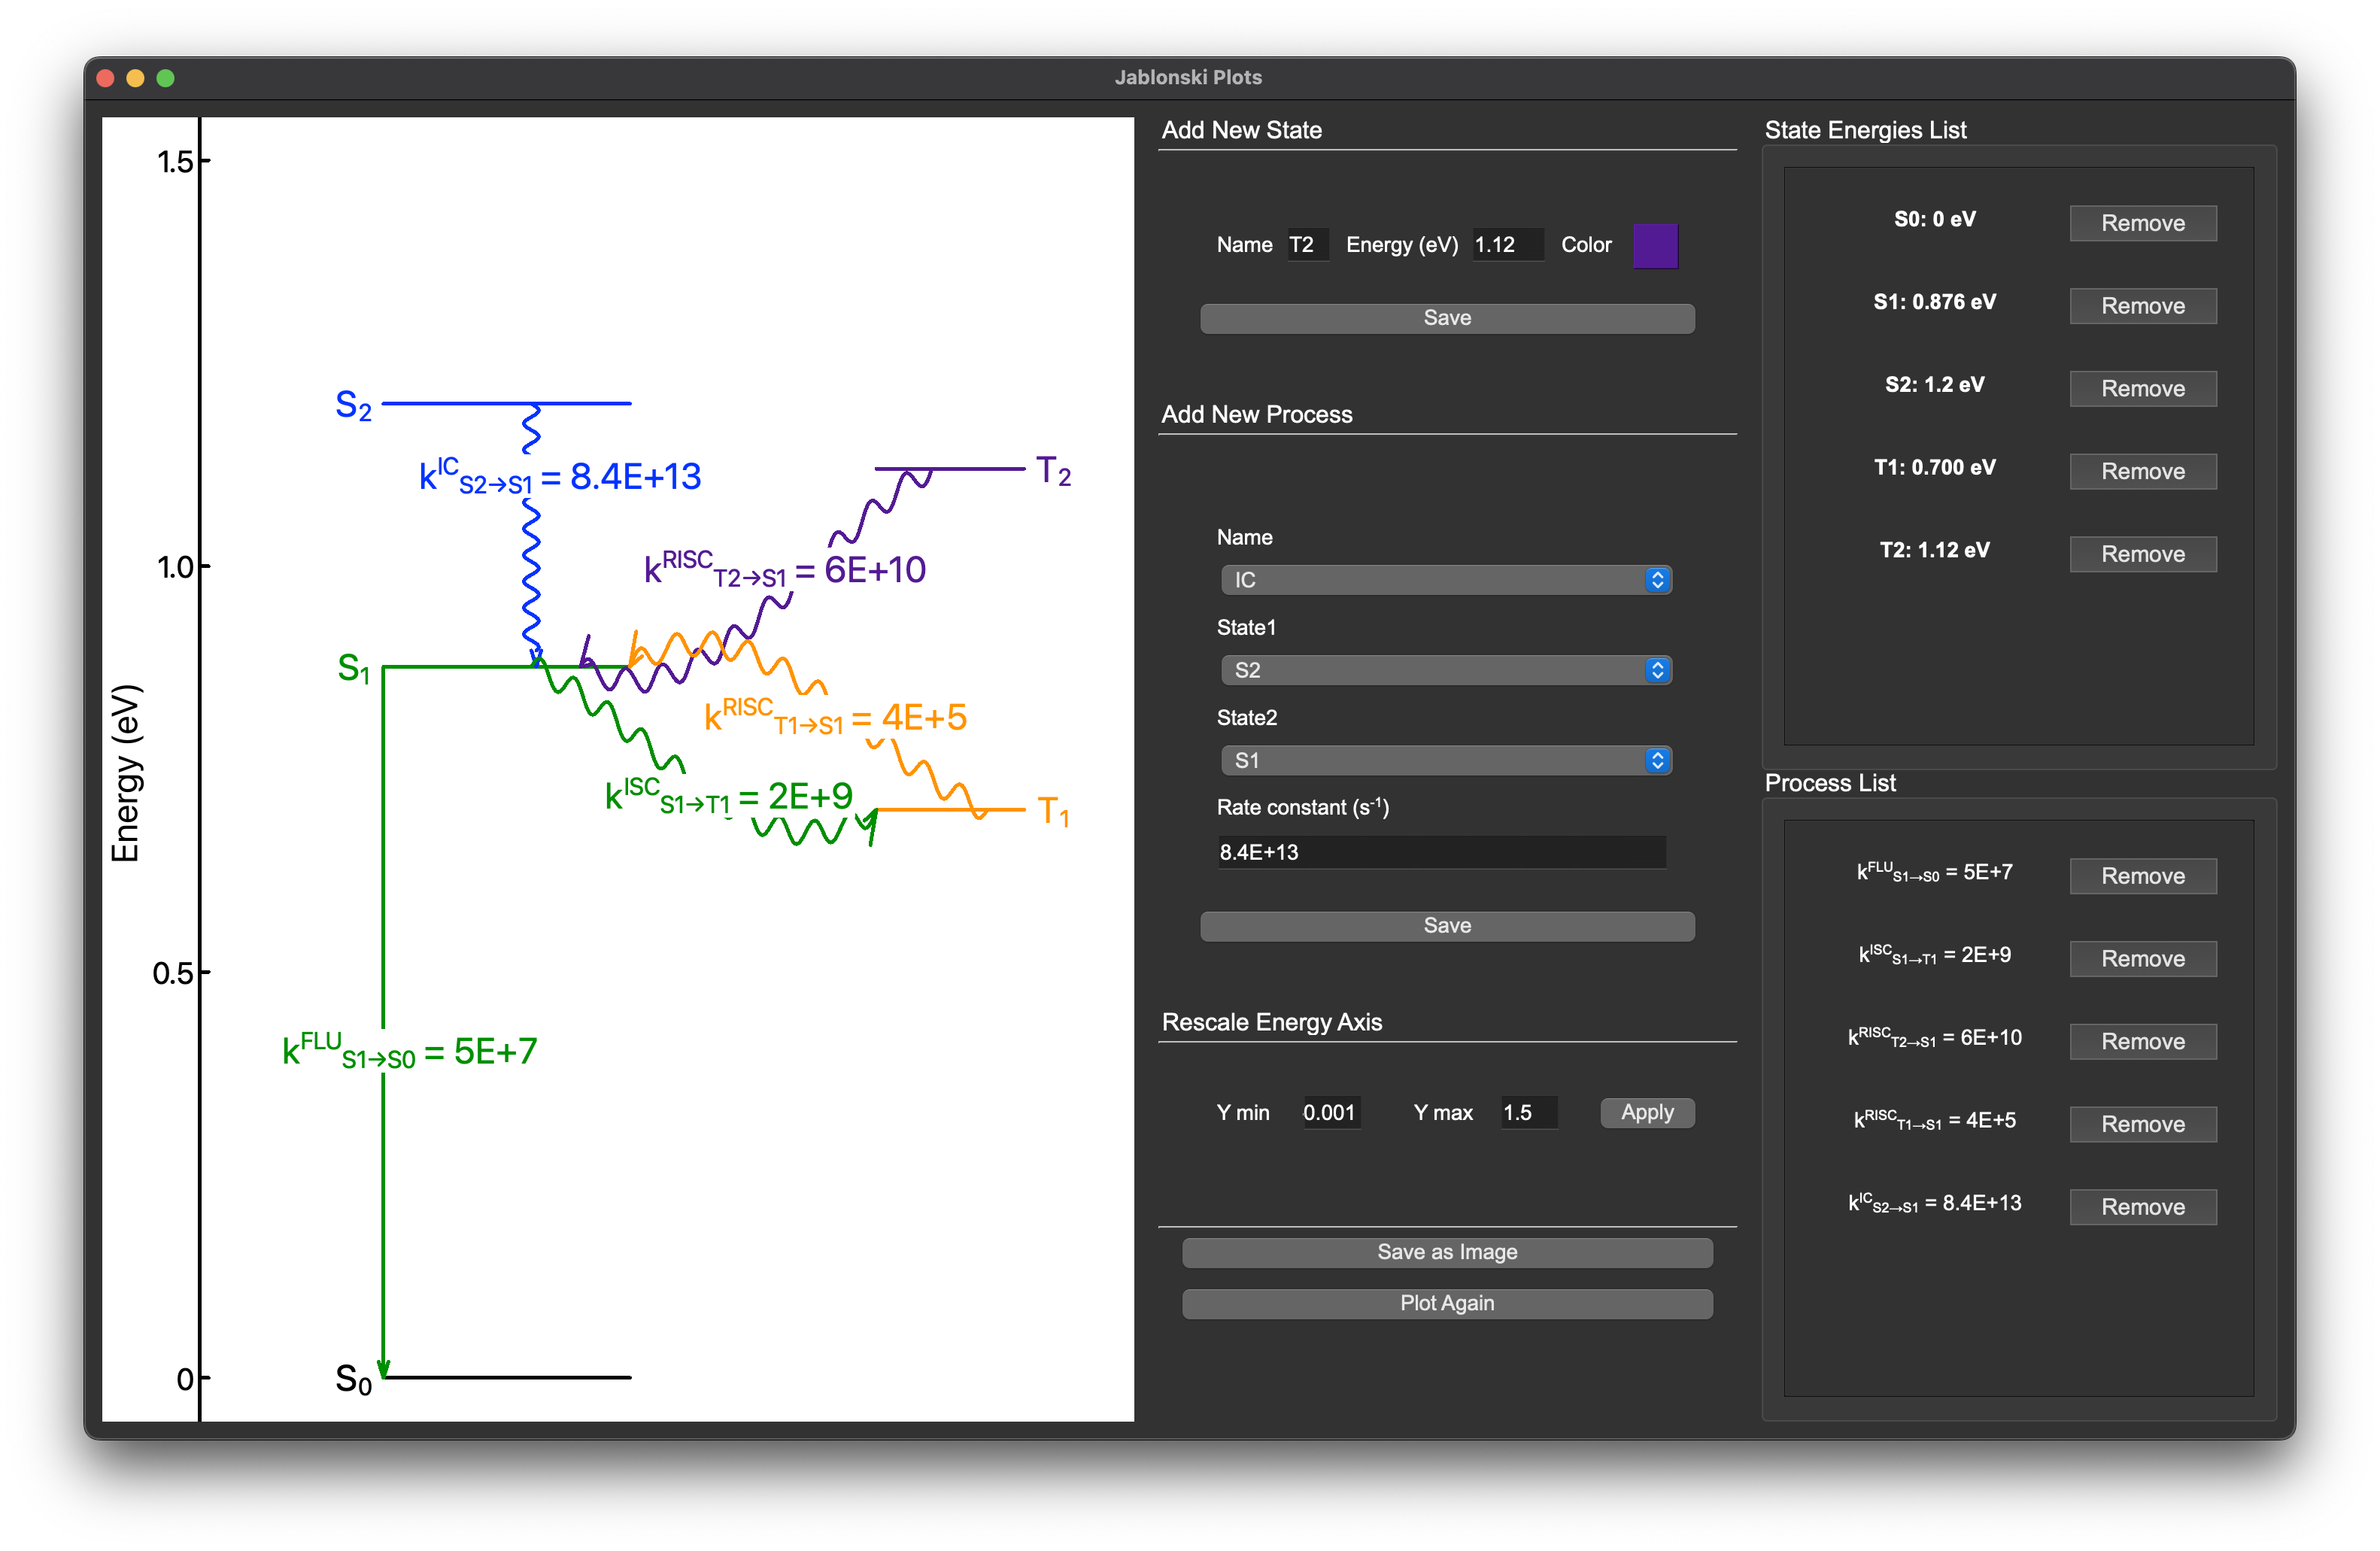
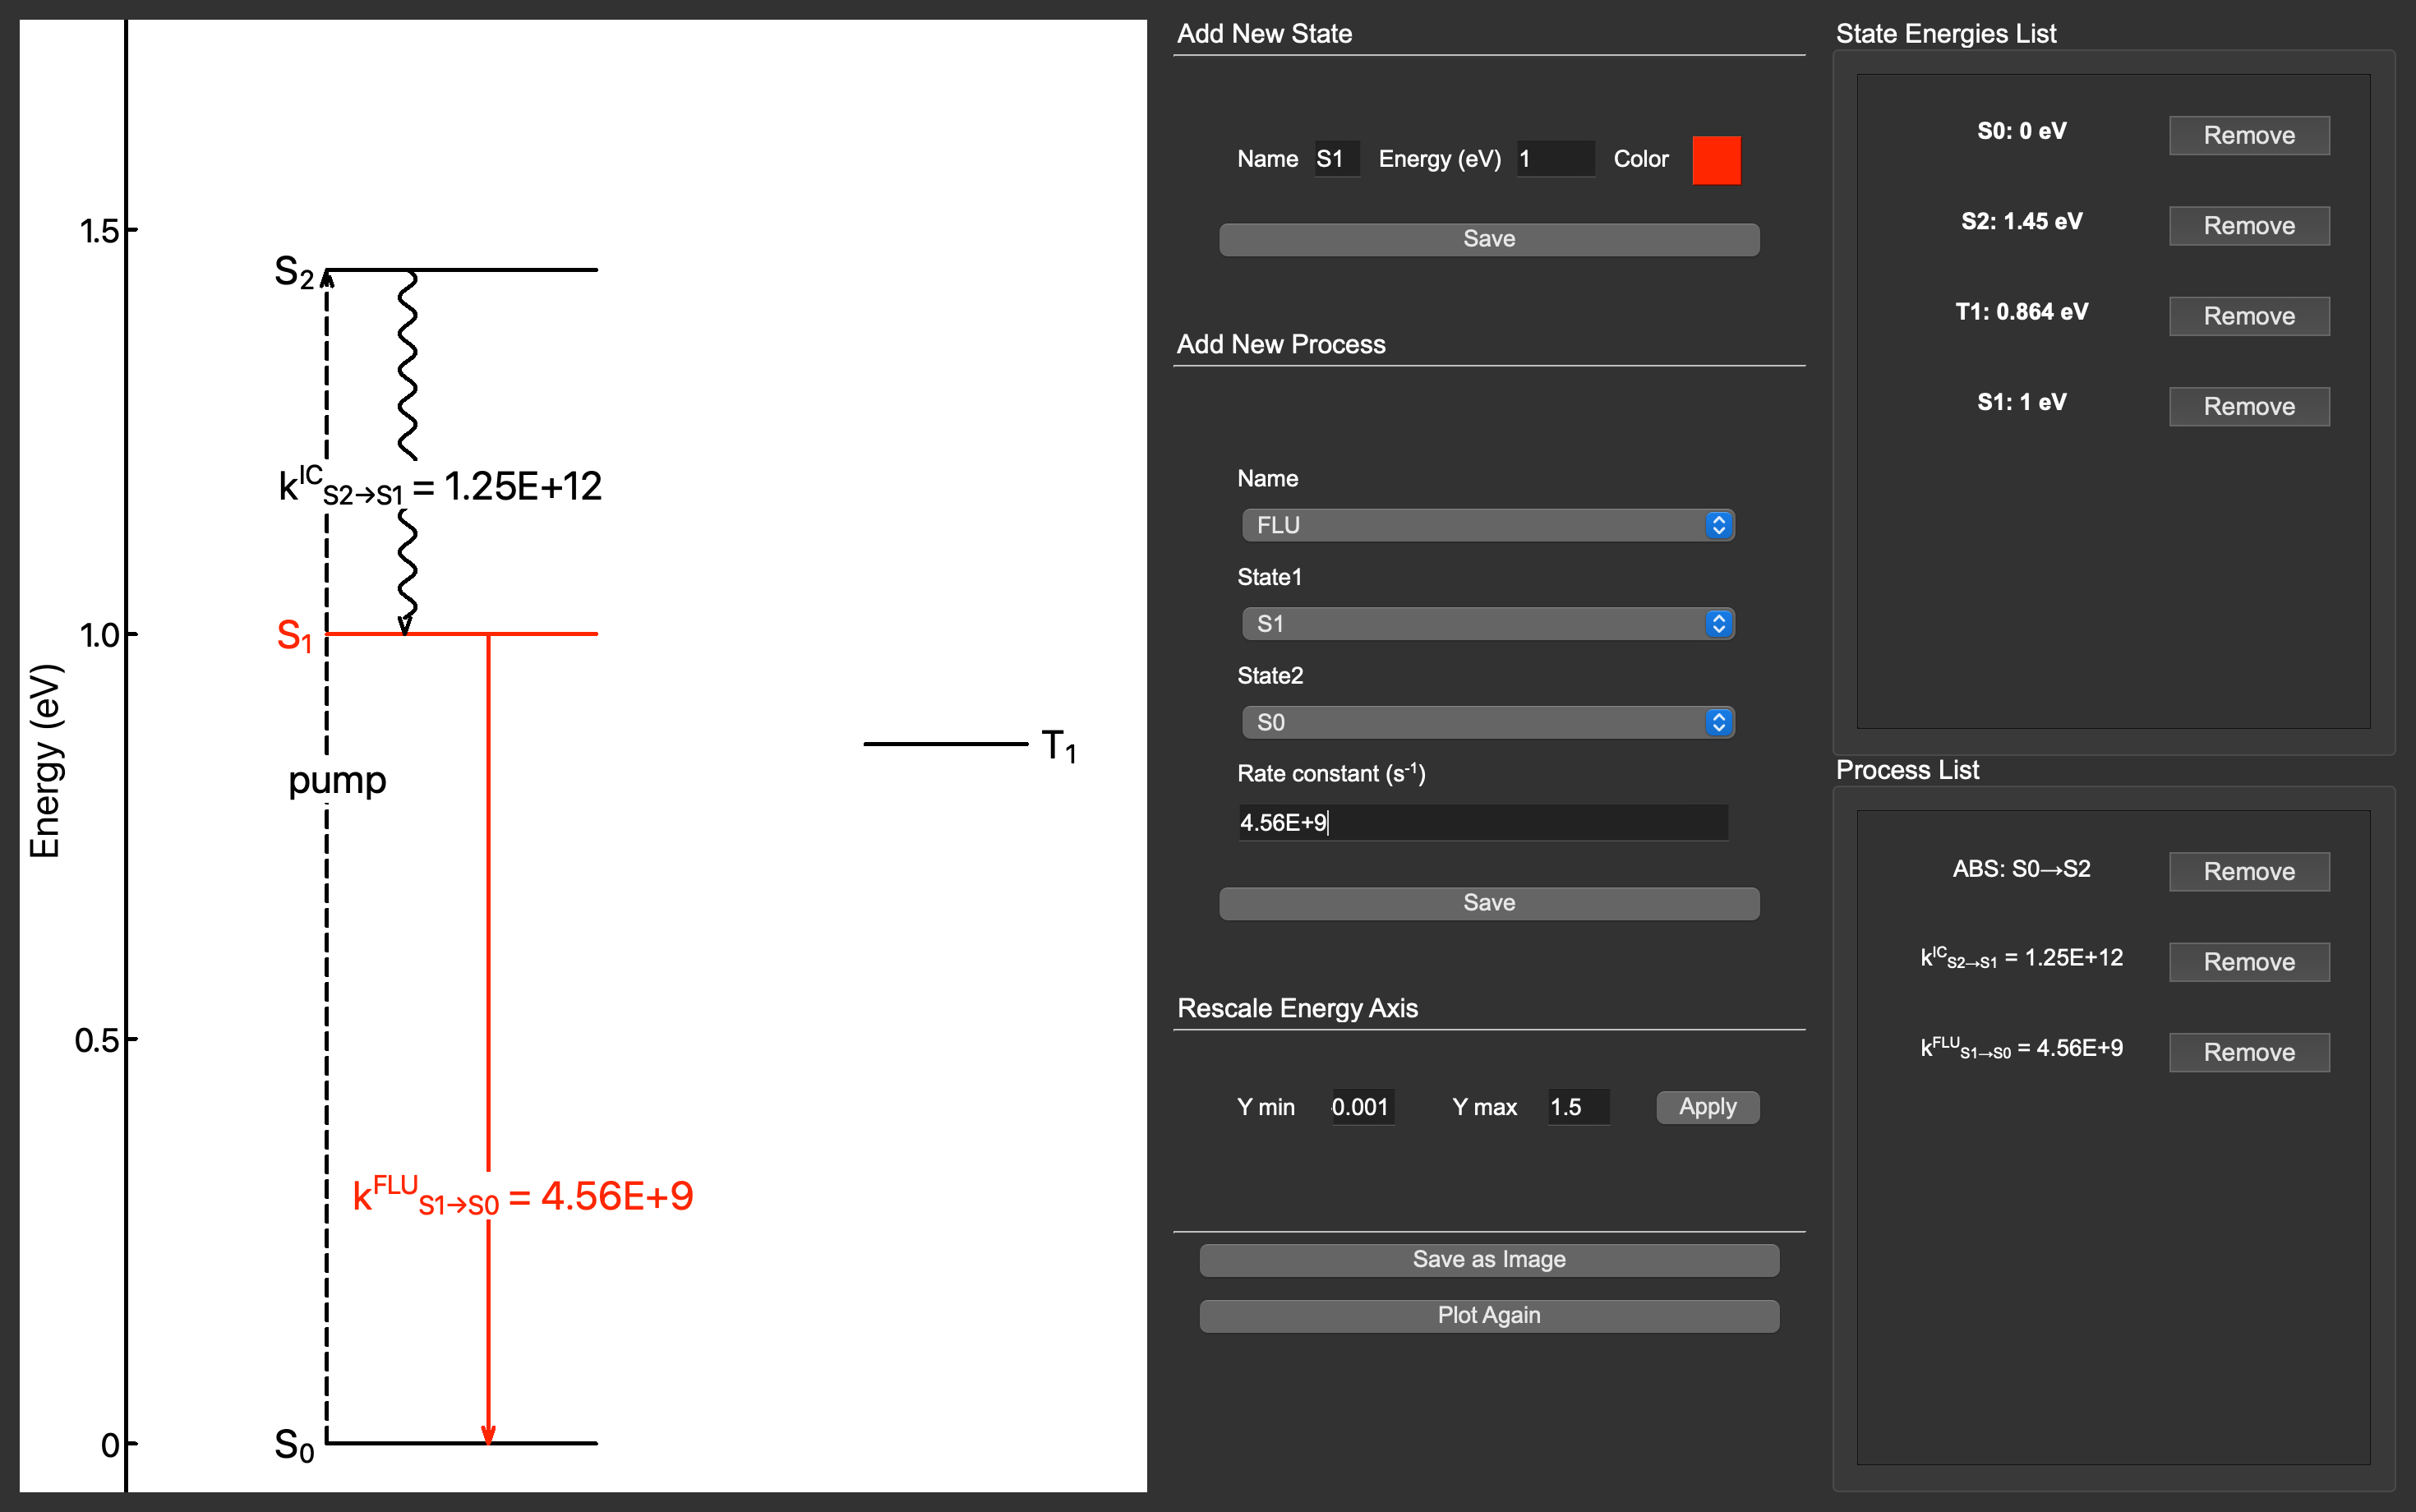
After Jablonski Plots app can be easily launched from the command line and the GUI is very intuitive. It is composed by three main parts:
- On the left there is the Jablonski plot, which readily updates each them new information are added or removed.
- On the center there is the main menu, composed by:
- An Add New State section, where the state label (ie. S_1 or T_1), its energy and its color in the plot may be chosen for each state inserted. The procedure is completed with the corresponding Save button. At the moment, only singlet states with labels starting by "S" and triplet states with labels starting by "T" works.
- An Add New Process section, where the process type may be selected between fluorescence (FLU), internal conversion (IC), intersystem crossing (ISC), reverse intersystem crossing (RISC), phosphoresence (PHO) and absorbance(ABS). Then, the initial and final state for the process can be selected between the added states and the corresponding rate constant may be written in the last entry. The information are stored with the "Save" button and the plot is updated accordingly. For the absorbance feature, the rate constant field is subsituted with an absorption coefficient coefficient, a plain text or just nothing.
- A Rescale Energy Axis section, which allows to indicate the minimum and maximum Y value for the energy axis and apply it to the plot with the Apply button.
- A Save as Image button, that allows to export the Jablonski plot as .PNG, .JPEG and .SVG files in the desired location.
- A Plot Again button, which shuffles the label positions and allows to easily fix any visualization problem.
- On the right, two list will keep track of every state (State Energies List) and process (Process List) added in the system, alongside with a button to remove each one of them.
Processes representations
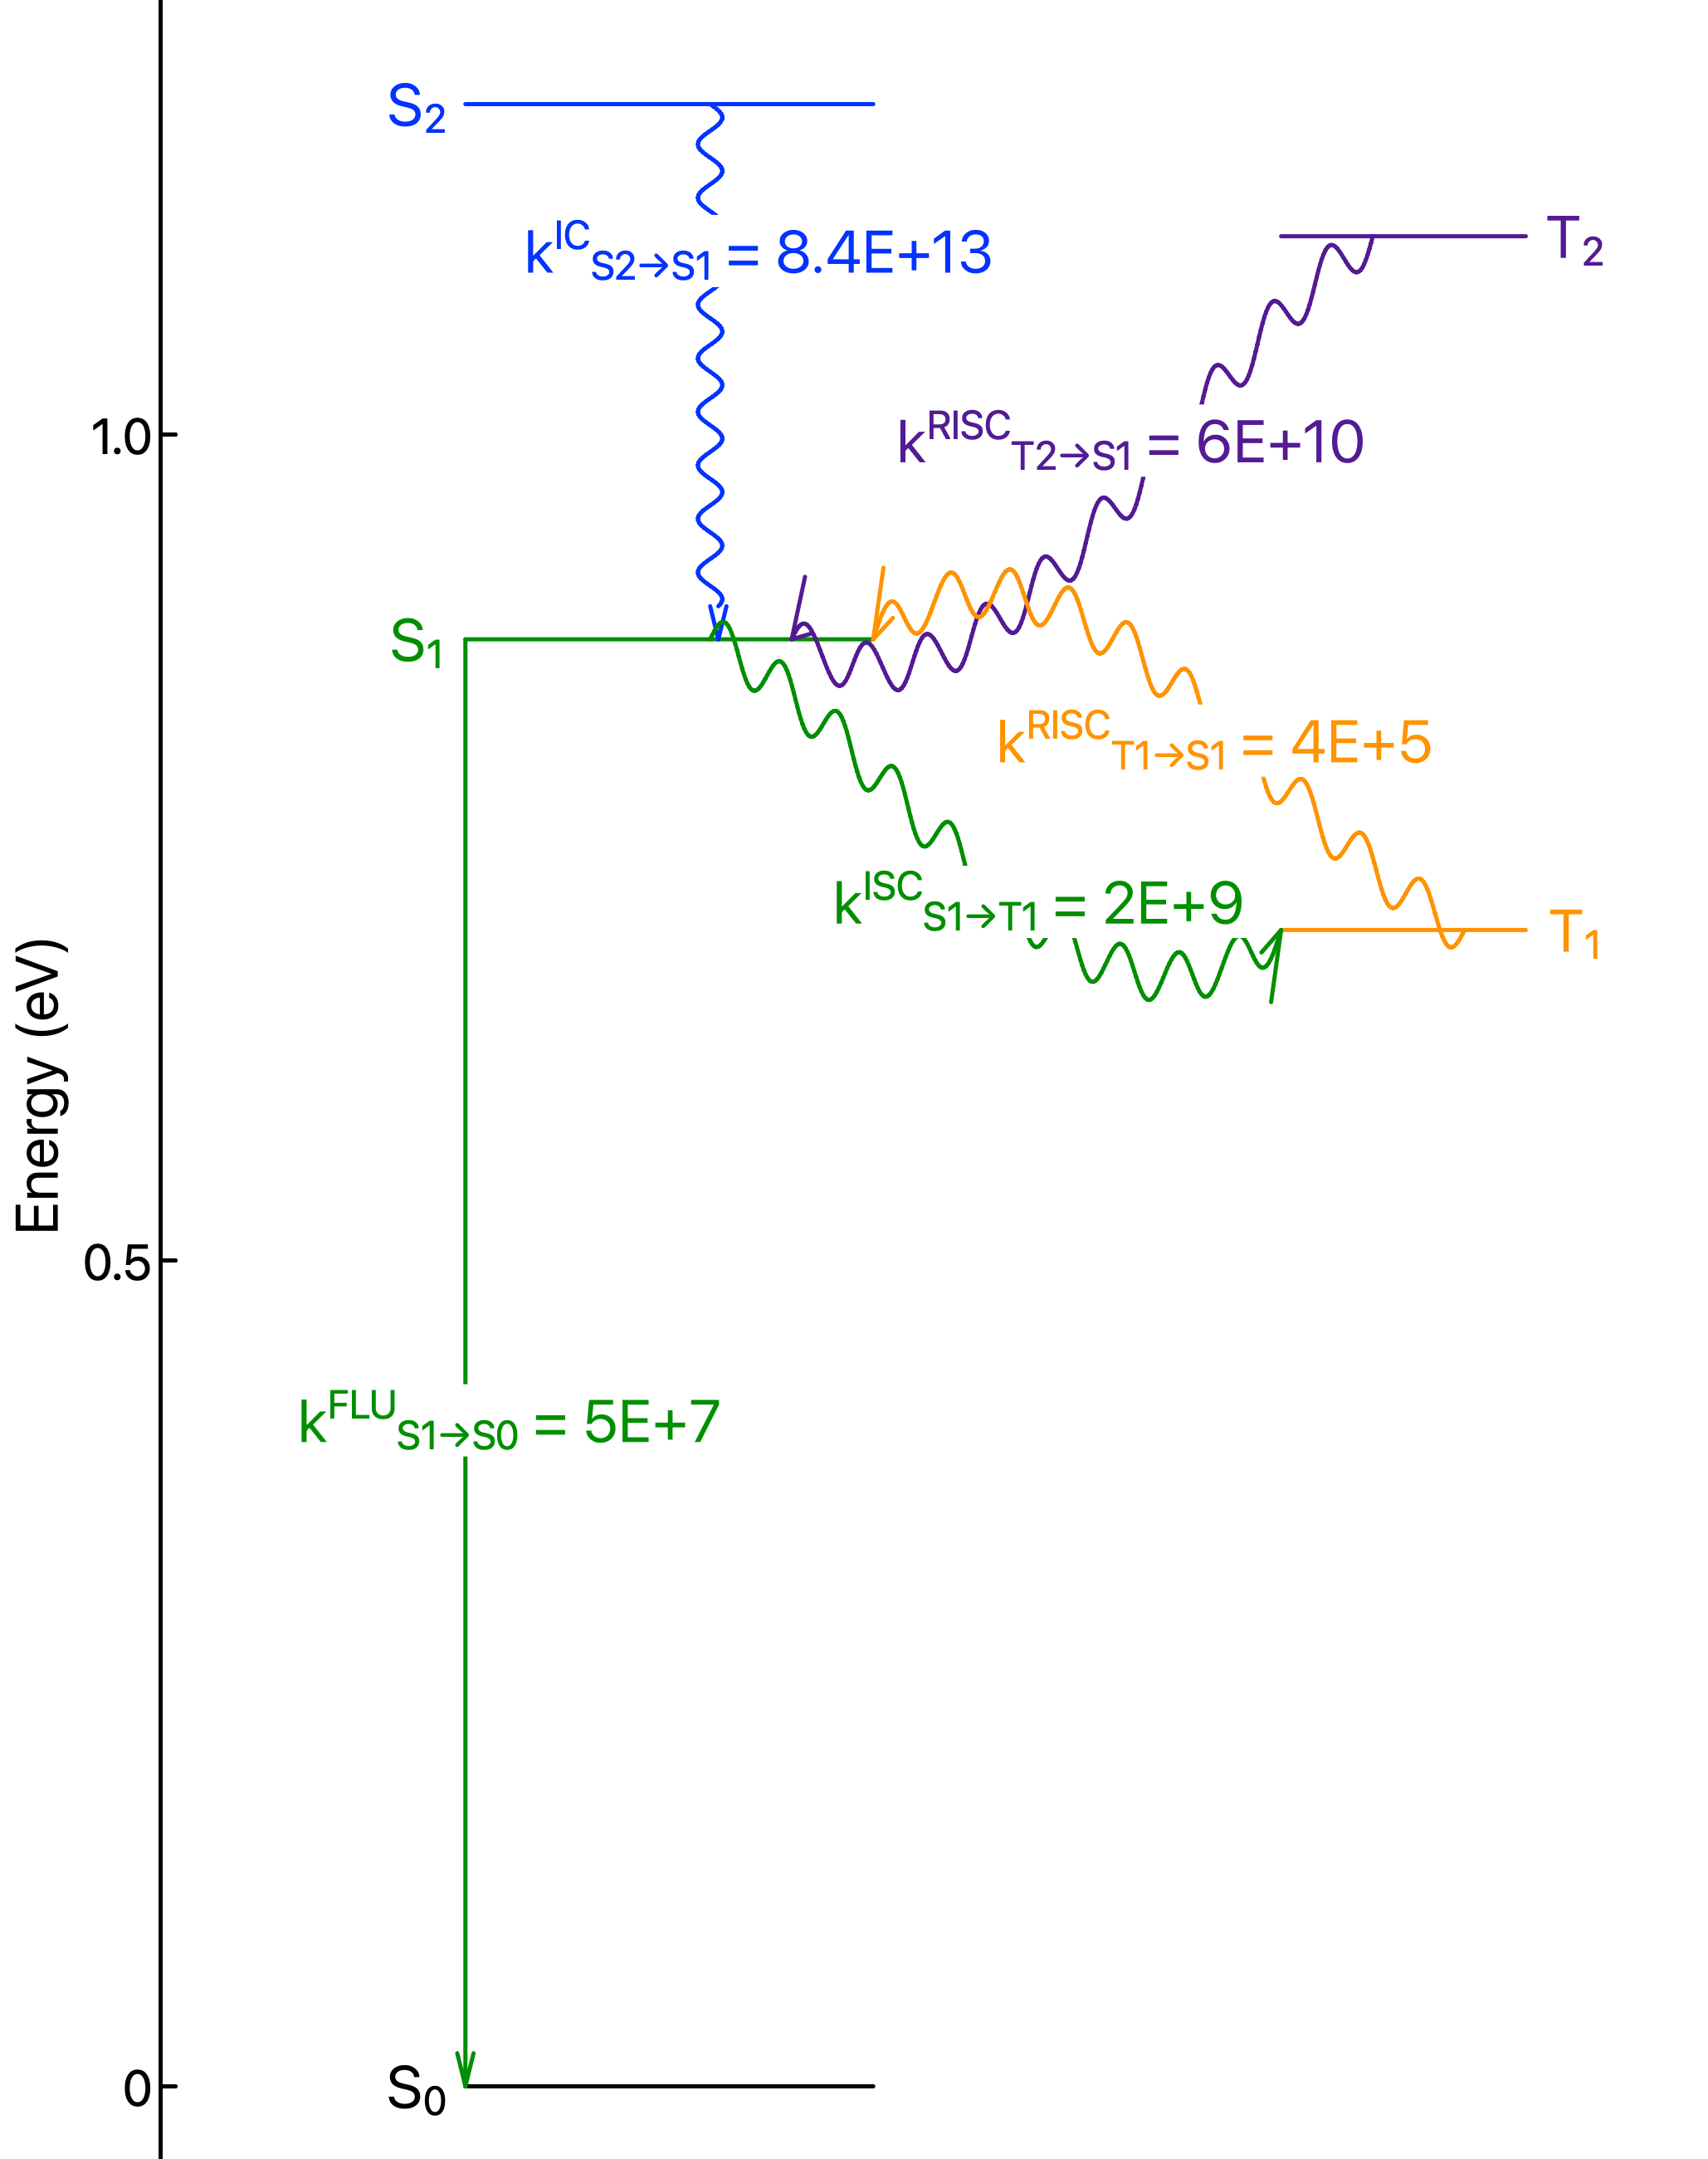
In Jablonski Plots, each process is represented with a specific type of arrow:
- Fluorescence (FLU) and Phosphorescence (PHO) processes are depicted with solid vertical arrows;
- Internal conversion (IC) is represented by a vertical wiggly arrow;
- Intersystem crossing (ISC) and reverse intersystem crossing (RISC) are represented by curved wiggly arrows;
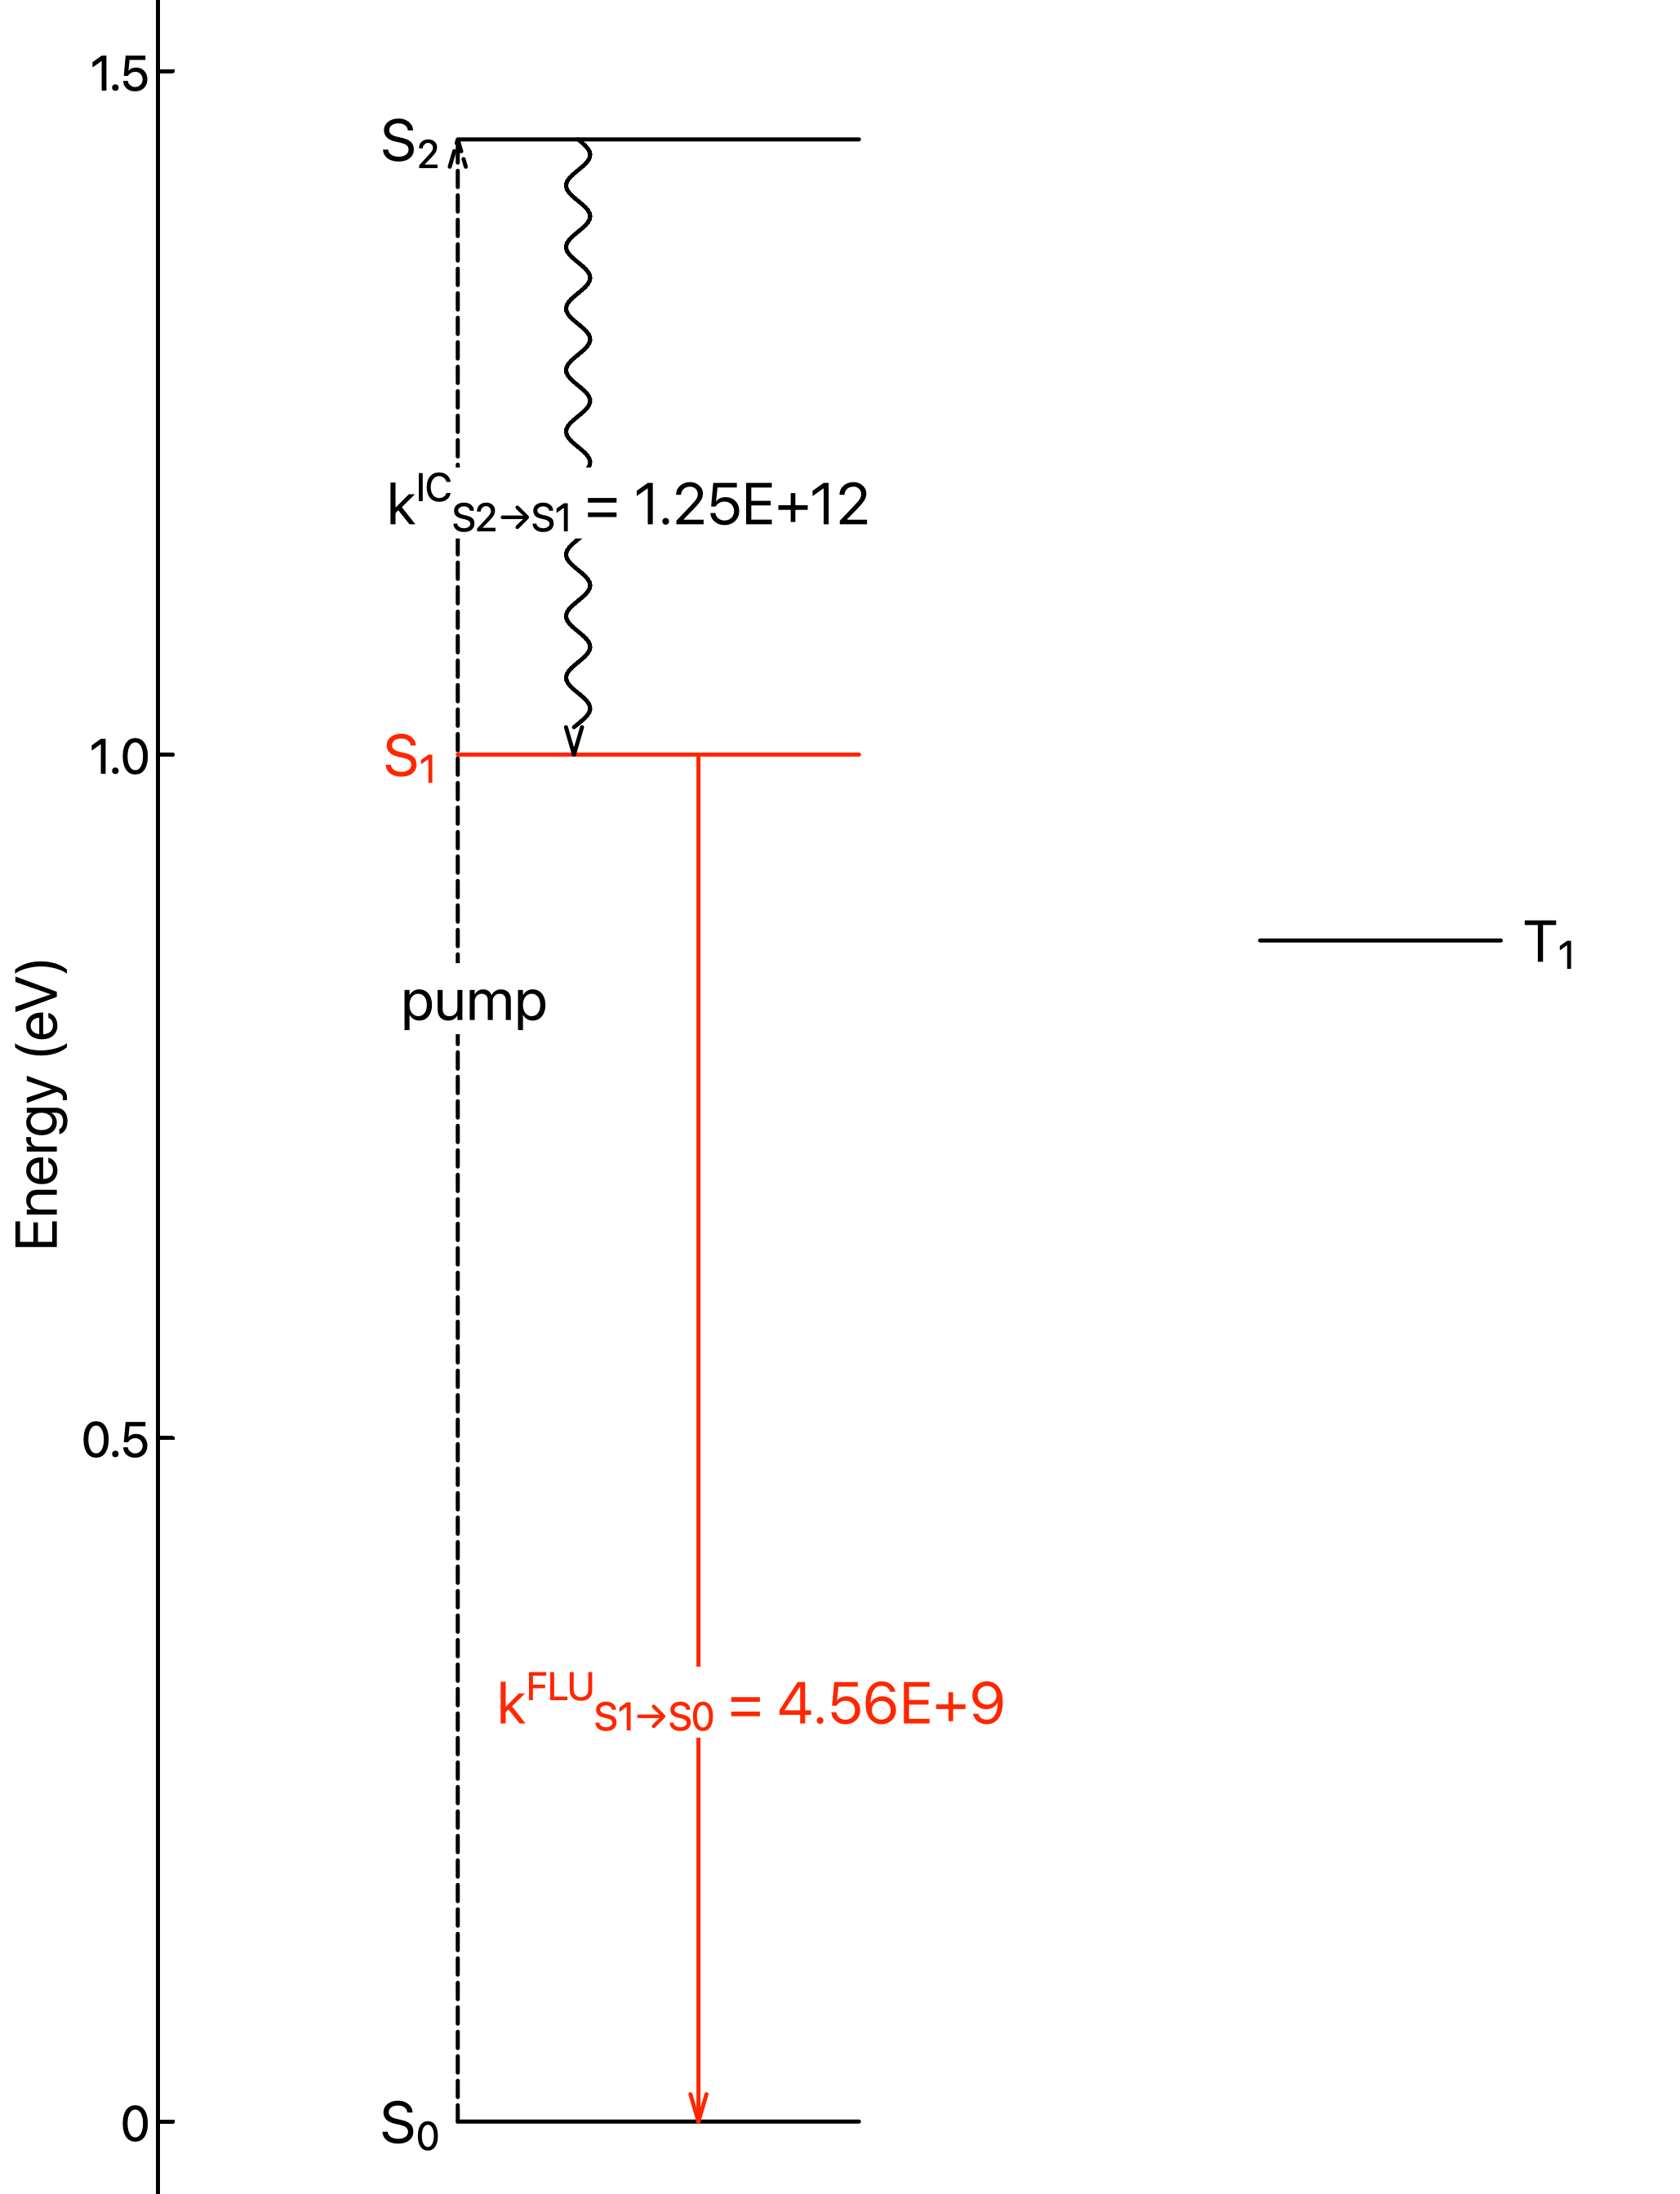
- Absorption (ABS) is represented by a dashed vertical arrow. The arrows and their label are of the same color as their intial state, with exception of absorption where the arrow color depends on the final state.
Examples
1 maintainer

Metadata
1 maintainer
Release files for jablonski-plots 1.0.3
For a detailed explanation of source distributions (sdists) and built distributions (wheels), please see the package formats documentation.
Source distribution (sdist)
| File | Size | Uploaded | |
|---|---|---|---|
| jablonski_plots-1.0.3.tar.gz | 15.5 kB | Details |
Built distribution (wheel)
| File | Interpreter | ABI | Platform | Reset |
|---|---|---|---|---|
| jablonski_plots-1.0.3-py3-none-any.whl | Python 3 | none | any | Details |
Total release size: 31.3 kB
Release files / jablonski_plots-1.0.3.tar.gz
| Download URL | jablonski_plots-1.0.3.tar.gz |
|---|---|
| Size | 15.5 kB |
| Tags | Source |
|
SHA-256 checksum How to use checksums |
c40a426c046bb446a3e4ec90853001bbad45547a9e2ceaaa038b9a47868fe0a8
|
|
BLAKE2b-256 checksum How to use checksums |
c304689e80af361b61dc4df1779fc76683cec9448077381c0c05ed7b8865c286
|
| Upload date | |
|
Uploaded using Trusted Publishing? What is trusted publishing? |
Yes |
| Uploaded via |
twine/6.1.0 CPython/3.13.7
|
Provenance
Provenance describes where a file came from. On PyPI, provenance is shared via attestations, which provide a verifiable record of the build or publishing details. View details, limitations and caveats.


PyPI Publish Attestation
PyPI verified that this artifact, at this checksum, originated from the publisher listed below.
Signed by GitHub Actions, verified by PyPI on Nov 2, 2025.
Transparency logRelease files / jablonski_plots-1.0.3-py3-none-any.whl
| Download URL | jablonski_plots-1.0.3-py3-none-any.whl |
|---|---|
| Size | 15.7 kB |
| Tags | Python 3 |
|
SHA-256 checksum How to use checksums |
b4fe9992aeb44f1947924985f0eee4e8b49b75e83f67210c2b86bab1e285ffa0
|
|
BLAKE2b-256 checksum How to use checksums |
3a41e479dea98972e001ed42f0e32640945a975fff2fde2744951e6ef00abbca
|
| Upload date | |
|
Uploaded using Trusted Publishing? What is trusted publishing? |
Yes |
| Uploaded via |
twine/6.1.0 CPython/3.13.7
|
Provenance
Provenance describes where a file came from. On PyPI, provenance is shared via attestations, which provide a verifiable record of the build or publishing details. View details, limitations and caveats.
PyPI Publish Attestation
PyPI verified that this artifact, at this checksum, originated from the publisher listed below.
Signed by GitHub Actions, verified by PyPI on Nov 2, 2025.
Transparency log













