
No project description provided

Project description
JIMG_int – Python library for marker intensity and distribution analysis





Author: Jakub Kubiś
Polish Academy of Sciences
Description
JIMG_int is a Python library designed to quantify and analyze marker intensity and spatial distribution in images. It is particularly useful for biological imaging, immunofluorescence, or any field requiring analysis of labeled markers in microscopy or medical images.
The library support the JIMG image processing tool, specifically tailored for analyzing high-resolution confocal microscope images Opera-Phoenix and other technologies.
It provides algorithms for measuring the intensity of specific protein markers using customizable image masks on high-resolution microscope images. These measurements are normalized using a background mask for consistent data comparison. The collected intensity data can be statistically analyzed to detect differences in marker localization, occurrence, and intensity.
📚 Table of Contents
- 1.Installation
- 2.Documentation
- 3.Example pipelines
1. Installation
In command line write:
pip install jimg-int
2. Documenation
Documentation for classes and functions is available here 👉 Documentation 📄
3. Example pipelines
If you want to run the examples, you must download the test data. To do this, use:
from jimg_ncd.nuclei import test_data

test_data()
3.1 Marker intensity features extraction
3.1.1 Adjusting parameters and image loading
from jimg_int.intensity import FeatureIntensity

# Select intenity are data for 1st Image - healthy

# initiate class
fi = FeatureIntensity()

# check current metadata
fi.current_metadata

# if required, change parameters
fi.set_projection(projection="avg")

fi.set_correction_factorn(factor=0.2)

# fi.set_scale(scale = 0.5)
# fi.set_selection_list(rm_list = [2,5,6,7])
# OR
# load JIMG project where scale and rm_lis is set in project metadata
# fi.load_JIMG_project_(path = '')
# for more information go to: https://github.com/jkubis96/JIMG
# rm_list and scale can be omitted

# load image
fi.load_image_3D(path="test_data/intensity/ctrl/image.tiff")

# or 1D image after projection, be sure that image was not adjusted, for analysis should be use !RAW! image
# fi.load_image_(path)
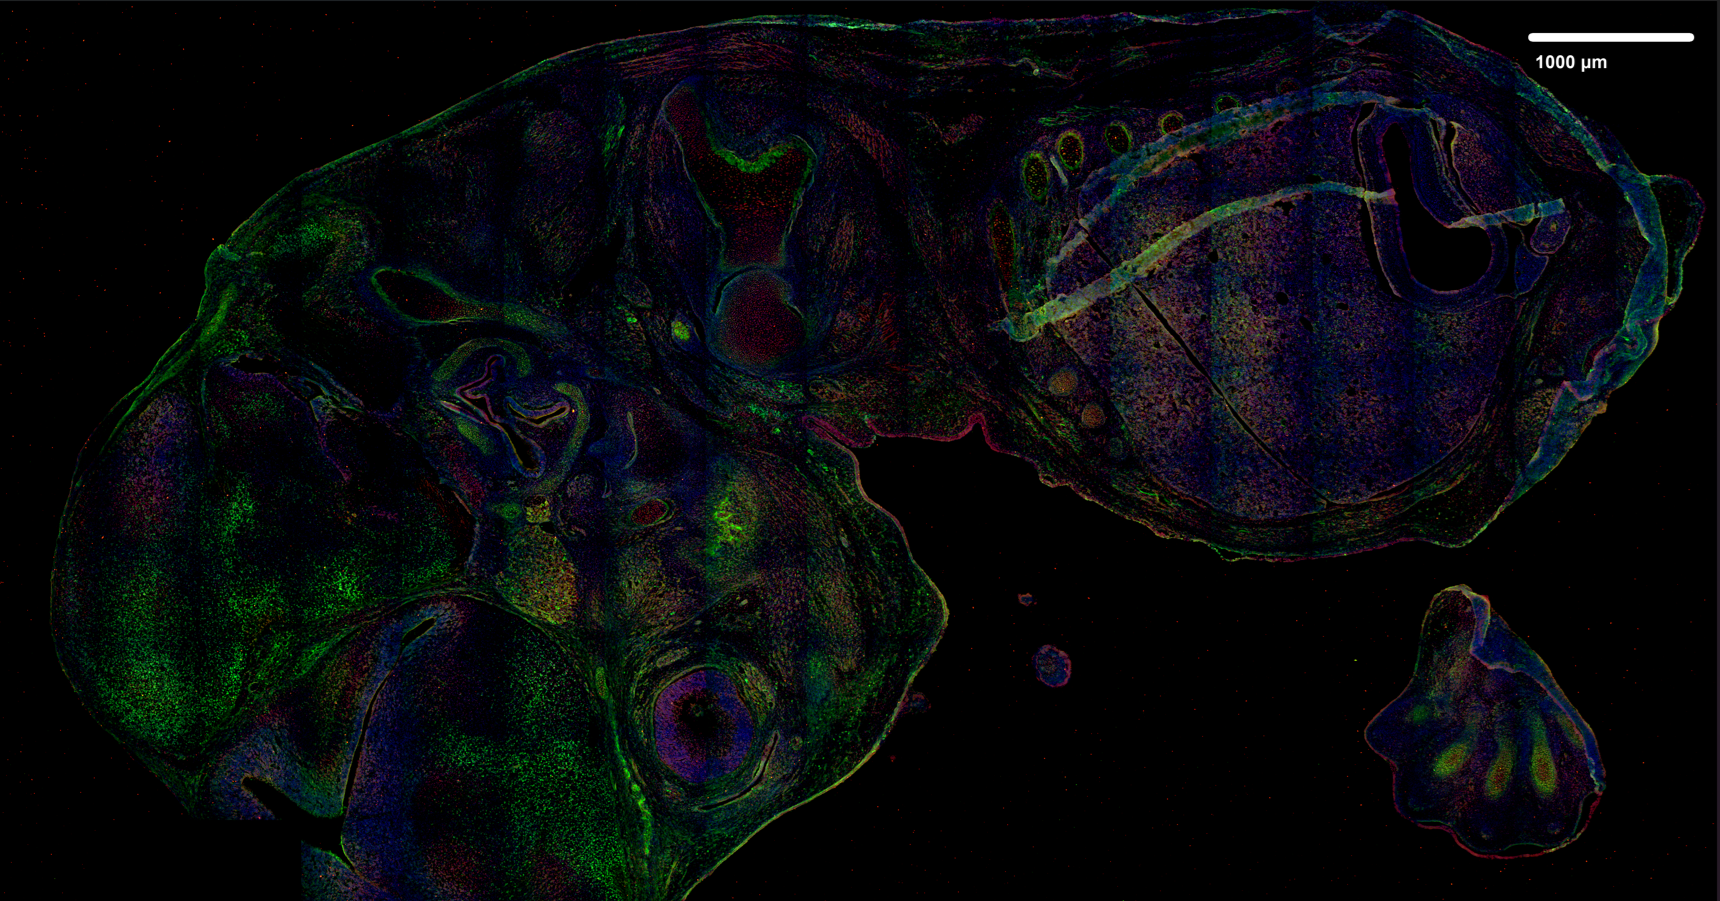
Analysed image projection (after projection with JIMG)
- input image in this case is raw 3D-image in *.tiff format
3.1.2 ROI mask loading
fi.load_mask_(path = 'test_data/intensity/ctrl/mask_1.png')
Analysed image region mask

3.1.3 Normalization mask loading
fi.load_normalization_mask_(path = 'test_data/intensity/ctrl/background_1.png')
Normalization region mask (reversed)

3.1.4 Extracting intensity values
# strat calculations
fi.run_calculations()


# get results
results = fi.get_results()
3.1.5 Saving intensity data
# save results for further analysis, ensuring each feature
# is stored in a separate directory (single directory
# should contain data with the same 'feature_name'),
# this setup allows running fi.concatenate_intensity_data()
# in the specific directory of each feature
# while preventing errors from incorrect feature concatenation

fi.save_results(path = os.getcwd(),
             mask_region = 'brain',
             feature_name = 'Feature1',
             individual_number = 1,
             individual_name = 'CTRL')
3.1.6 Performing analysis pipeline for the subsequent image
- Apply steps 3.1.1–3.1.5 to the subsequent image to support comparison analysis.
# Select intenity are data for 2st Image - disease

# initiate class
fi = FeatureIntensity()

fi.set_projection(projection="avg")

fi.set_correction_factorn(factor=0.2)

fi.load_image_3D(path="test_data/intensity/dise/image.tiff")

###############################################################################

fi.load_mask_(path="test_data/intensity/dise/mask_1.png")

###############################################################################

fi.load_normalization_mask_(path="test_data/intensity/dise/background_1.png")

###############################################################################

fi.run_calculations()

results = fi.get_results()

fi.save_results(
    path="",
    mask_region="brain",
    feature_name="Feature1",
    individual_number=1,
    individual_name="DISEASE",
)
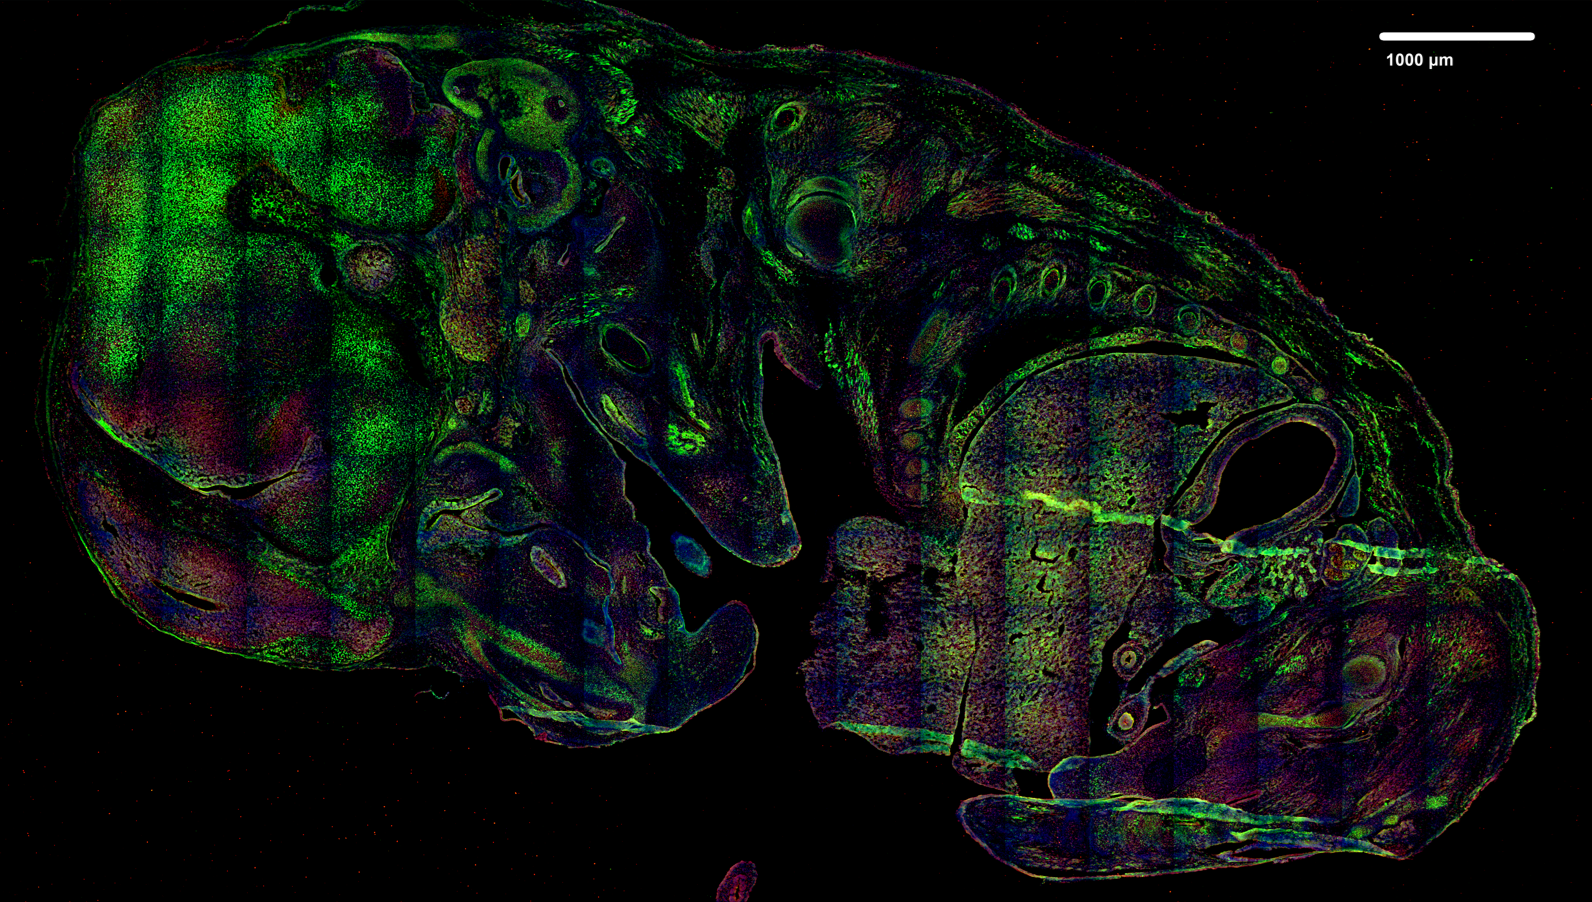
Analysed image projection (after projection with JIMG)
- input image in this case is raw 3D-image in *.tiff format
Normalization region mask (reversed)
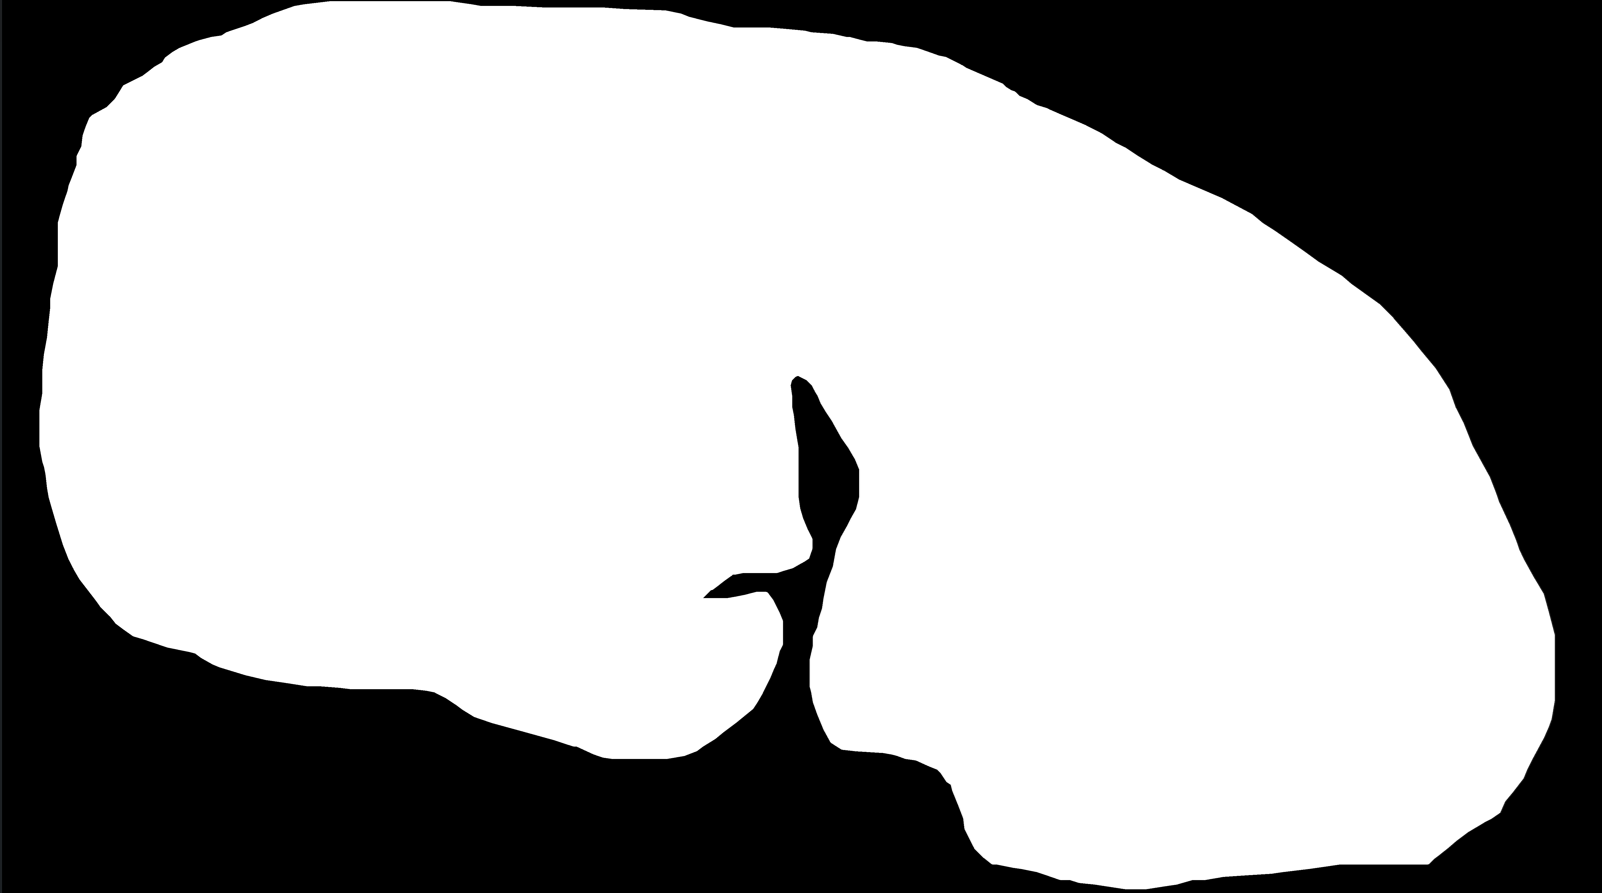
Analysed image region mask

3.1.7 Combining the experimental data
# concatenate data of experiment 1 & 2
fi.concatenate_intensity_data(directory="", name="example_data")
3.2 Analyzing the intensity and spatial distribution of the marker
3.2.1 Loading experimental data
import pandas as pd
from jimg_int.intensity import IntensityAnalysis

# initiate class
ia = IntensityAnalysis()

input_data = pd.read_csv("example_data_Feature1_brain.csv")

# check columns
input_data.head()
3.2.2 Quantitative analysis of marker intensity and spatial distribution
data = ia.df_to_percentiles(
    data=input_data,
    group_col="individual_name",
    values_col="norm_intensity",
    replication_col = 'individual_number',
    sep_perc=1,
)

stats = ia.get_stats(data, tested_value = 'avg')
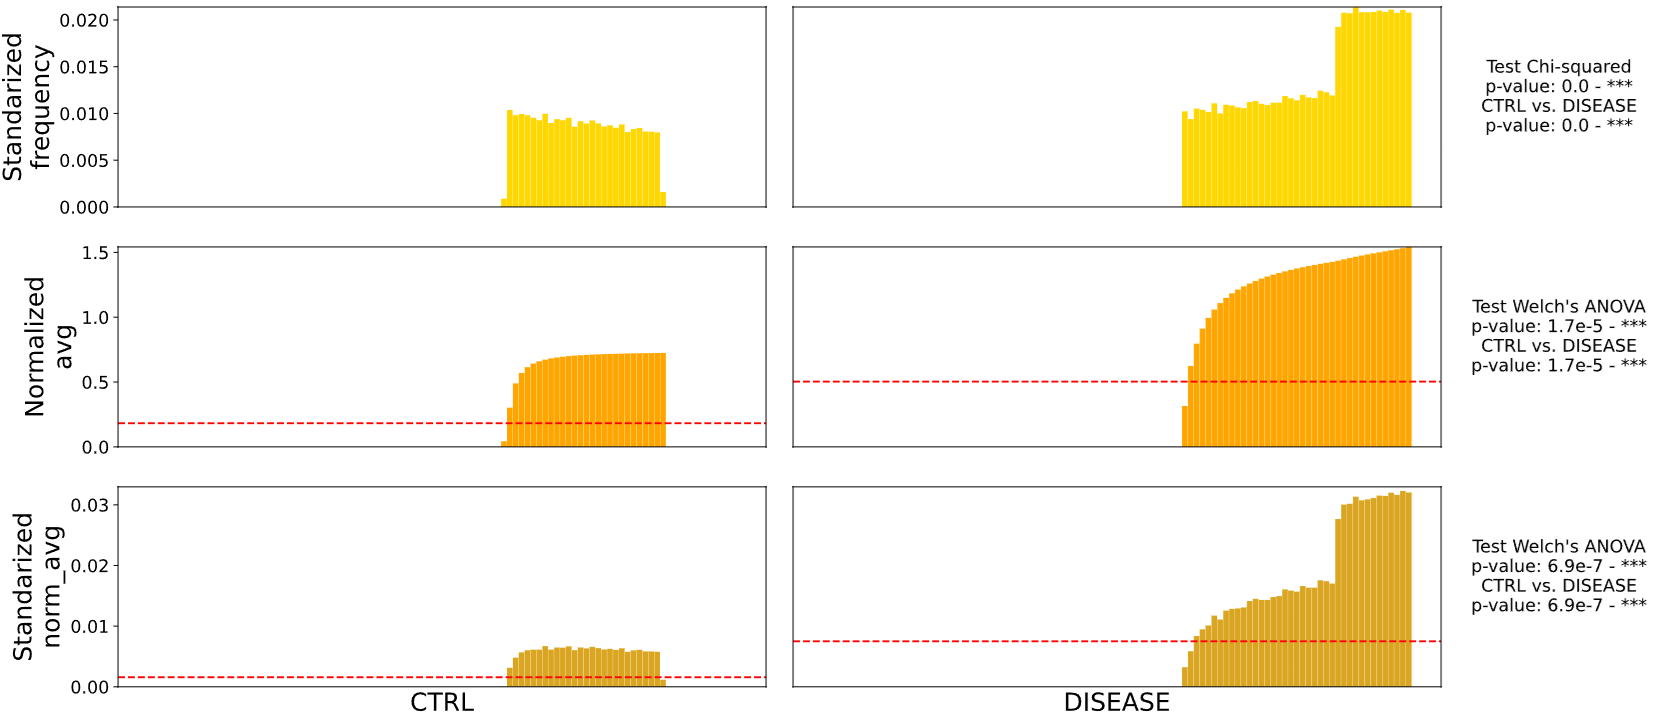
3.2.3 Visualizing the data using a histogram distribution
results = ia.hist_compare_plot(
    data=stats, queue=["CTRL", "DISEASE"], p_adj=True, txt_size=20
)
Results of intensity comparison analysis (region under the mask)
results.savefig('example_results.svg', format = 'svg', dpi = 300, bbox_inches = 'tight')
Have fun JBS


Download files
Download the file for your platform. If you're not sure which to choose, learn more about installing packages.
Source Distribution
Built Distribution
Filter files by name, interpreter, ABI, and platform.
If you're not sure about the file name format, learn more about wheel file names.
Copy a direct link to the current filters
File details
Details for the file jimg_int-0.1.2.tar.gz.
File metadata
- Download URL: jimg_int-0.1.2.tar.gz
- Upload date:
- Size: 34.0 kB
- Tags: Source
- Uploaded using Trusted Publishing? No
- Uploaded via: twine/6.2.0 CPython/3.11.9
File hashes
| Algorithm | Hash digest | |
|---|---|---|
| SHA256 |
9415210a7ad172fa64973dbe10defb17f7eeea757bfa5991e560a37d7167859c
|
|
| MD5 |
b17e5782d01de50f13d3e41157a57b3f
|
|
| BLAKE2b-256 |
d08934333ff318458936740ee5363a65cedc5d2dbf1e8c0e1151c1ccddbca1d5
|
File details
Details for the file jimg_int-0.1.2-py3-none-any.whl.
File metadata
- Download URL: jimg_int-0.1.2-py3-none-any.whl
- Upload date:
- Size: 35.3 kB
- Tags: Python 3
- Uploaded using Trusted Publishing? No
- Uploaded via: twine/6.2.0 CPython/3.11.9
File hashes
| Algorithm | Hash digest | |
|---|---|---|
| SHA256 |
eb52a8bea0750f2871508f30bd57face1117411471518dccb51ad85587c4753e
|
|
| MD5 |
0f13940bf36f2c709d7eb1e6a1c313fb
|
|
| BLAKE2b-256 |
460fe229b0cd027900f922e5b0896a613617506467d796e98395d360bf9fb2be
|






