Generating Jira report to see issue trends.

Project description
Jira HTML Report
jira-html-report is a Python script designed to generate reports from Jira. This script allows you to fetch and process data from your Jira projects, providing insights and summaries that can help you manage your projects more effectively.
Features
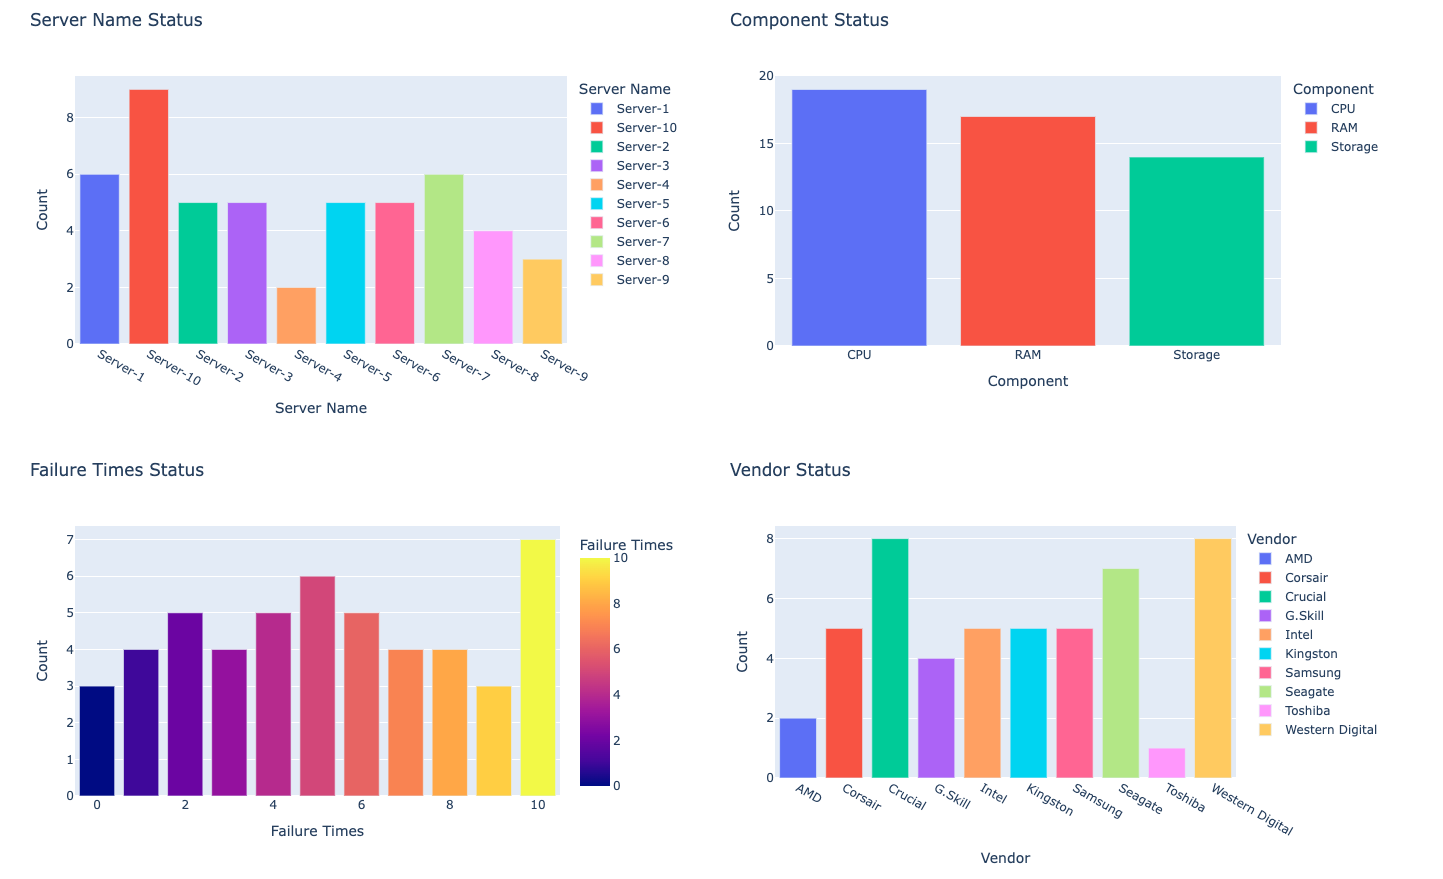
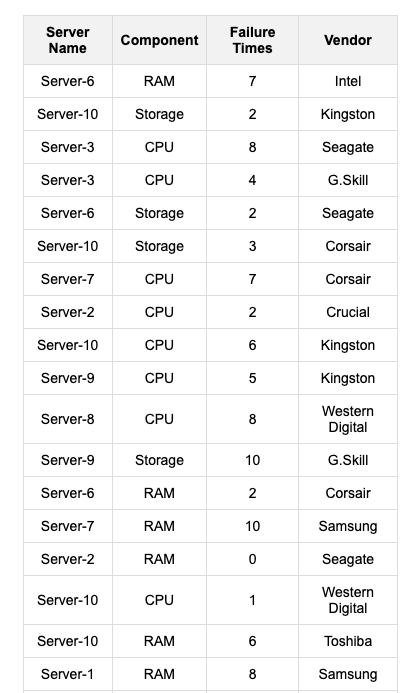
- HTML report with charts and table sheet
- Fetch data from Jira projects
- Generate summary reports
- Customizable report formats
- Easy to use and configure
Sample charts and table
Requirements
- Python 3.x
- Python external packages
jira
plotly
pandas
jinja2
Installation
Choose one of way what you desire
-
Pypi package management:
pip install jira-html-report
-
Clone the repository:
git clone https://github.com/freeyssu/jira-html-report.git
cd jira-html-report
pip install -r requirements.txt
Directory and files
.
├── jira_html_report/
│   ├── html_templates/
│   │   ├── chart_templates.j2
│   │   ├── report_templates.j2
│   │   └── table_templates.j2
│   ├── data.py
│   └── report.py
└── samples/
    ├── sample.html
    ├── sample.ipynb
    └── sa,ple.py
Usage
- Initialize HTMLReport instance
from jira_html_report import HTMLReport
html_report = HTMLReport(server='https://YOUR_JIRA_SERVER', username=USERNAME password=PASSWORD)
- Query Jira items by
JQLthen generate PandasDataFrame
jql = 'Project = TEST AND created > -7d'

# define fields what you extract from the queried Jira items
fields_for_charts = [
    'customfield_1000',     # custom fields
    'customfield_2000',     # what you want to get
    'customfield_3000',     # you should put field-id
    'status',
    'assignee',
    'reporter',
    'priority',
    'components'
]
fields_for_table = [
    'customfield_4000',     # you can add/remove any field for chart or table
    'status',
    'assignee'
]

# generate main DataFrame and sub DataFrames for chart.
# sub DataFrames are grouped by the selected fields and counted the rows. it has two columns (field name and Count)
chart_df, chart_sub_dfs = html_report.generate_dataframes_by_jql(jql=jql, fields=fields_for_charts, jql_search_limit=100)
table_df, table_sub_dfs = html_report.generate_dataframes_by_jql(jql=jql, fields=fields_for_table, jql_search_limit=100)

########################################################
# do something here to update the main or sub dataframes
# e.g. update column name
########################################################
- Draw charts
figures = {}
for field_name, sub_df in sub_dfs.items():
    figures[field_name] = html_report.generate_chart_figure(
        df=sub_df,
        chart_type='bar',
        chart_title=f'{sub_df.columns[0]} Status',
        x=sub_df.columns[0],
        y=sub_df.columns[1])

########################################################
# do something here to update chart properties
# figures['customfield_1000'].update_layout(...)
# figures['assignee'].update_traces(...)
# figures['field_x'] ...
########################################################
- Generate HTML code blocks for chart and table sheet
# generate HTML code block for charts
html_charts = {}
for field_name, figure in figures.items():
    html_charts[field_name] = html_report.generate_html_chart(
        figure=figure, chart_template_path='chart_template.j2', static_chart=True)

# generate HTML code block for table
html_table = html_report.generate_html_table(
    df=table_df, table_template_path='table_template.j2')
- Generate HTML report
# generate a combined report with charts and table
html_report = html_report.generate_html_report(
    report_template_path='report_template.j2', html_charts=html_charts, html_table=html_table)

# save the generated HTML
with open('jira_report.html', 'wb') as f:
    f.write(html_report.encode())
HTML template modification
There are three Jinja2 templates under html_templates dir to generate a HTML report.
You can modify or add any HTML properties/Python vars.
- Add/update vars or properties in Jinja2 template
<!-- add <h2> tag to html_templates/report_template.j2 -->
<h2> {{ new_h2_string_in_report }} </h2>
- Populate the vars
html_report = html_report.generate_html_report(
    report_template_path='report_template.j2',
    html_charts=html_charts,
    html_table=html_table,
    new_h2_string_in_report="ADDED NEW H2 STRING")


Download files
Download the file for your platform. If you're not sure which to choose, learn more about installing packages.
Source Distribution
Built Distribution
Filter files by name, interpreter, ABI, and platform.
If you're not sure about the file name format, learn more about wheel file names.
Copy a direct link to the current filters
File details
Details for the file jira_html_report-0.5.0.tar.gz.
File metadata
- Download URL: jira_html_report-0.5.0.tar.gz
- Upload date:
- Size: 292.3 kB
- Tags: Source
- Uploaded using Trusted Publishing? No
- Uploaded via: twine/6.1.0 CPython/3.12.8
File hashes
| Algorithm | Hash digest | |
|---|---|---|
| SHA256 |
5064448b064393eb37ab5a0fc22c4145ec5aadbc192c13d20ed092894ac52a63
|
|
| MD5 |
8f0802b4c1cb6e5102e5849adaed576d
|
|
| BLAKE2b-256 |
aa7c516f2d9c9cff4d3625f2cfa87af425b811e76c8054e1c85b6389a38c3501
|
File details
Details for the file jira_html_report-0.5.0-py3-none-any.whl.
File metadata
- Download URL: jira_html_report-0.5.0-py3-none-any.whl
- Upload date:
- Size: 8.3 kB
- Tags: Python 3
- Uploaded using Trusted Publishing? No
- Uploaded via: twine/6.1.0 CPython/3.12.8
File hashes
| Algorithm | Hash digest | |
|---|---|---|
| SHA256 |
755eaa275da731a61ee22be233904c334d73de2ff6327006268fd7fdc43dd854
|
|
| MD5 |
f5bc7decc0f7ccc3482180fc109ec195
|
|
| BLAKE2b-256 |
55c292aa8635953c5c0b2875d1709034d6bc67874dcc2752b2cc6cf24cf05cba
|


