
🐞 Jitterbug
A Python framework for inferring Internet path congestion from Round-Trip Time (RTT) measurements. Jitterbug splits an RTT time series at change points, then classifies each period as congested or not by combining a latency-jump test with a jitter test (jitter dispersion or Kolmogorov–Smirnov). It implements the method from Jitterbug: A New Framework for Jitter-Based Congestion Inference (PAM 2022) and ships the paper's dataset so you can reproduce it in one command.




✨ Features
- 📉 Congestion inference from RTTs alone: no active probing beyond the pings you already have
- 🔀 Pluggable change point detection:
rupturesout of the box, the paper's Bayesian detector (bcp) as an extra - 📐 Two jitter tests: jitter dispersion (moving IQR + moving average) or a Kolmogorov–Smirnov test between periods
- 🧩 Non-sequential mode: cluster 15-minute intervals by (latency, jitter) with a Gaussian mixture or k-means and compare each cluster with the baseline, no matter when its intervals occur
- 📁 Multiple input formats: CSV, scamper JSON, and InfluxDB queries
- 📊 Rich terminal output: summary and per-period tables, plus JSON or CSV results files
- ⚙️ Typed configuration: Pydantic models, YAML/JSON config files,
JITTERBUG_*environment variables - 🧪 Reproducible: the PAM 2022 dataset (47 163 measurements) and its reference results are bundled
- 🐍 Library and CLI: use
jitterbug analyzeor callJitterbugAnalyzerfrom your own code
🚀 Quick Start
Installation
From PyPI:
pip install jitterbug-inference              # core: ruptures detector, CLI, library
pip install "jitterbug-inference[bcp]"       # + the paper's Bayesian detector
The distribution is named
jitterbug-inferencebecausejitterbugon PyPI is an unrelated project; the import isimport jitterbugand the command isjitterbug.pip install jitterbuginstalls the wrong package.
For development, clone and use uv:
git clone https://github.com/estcarisimo/jitterbug.git
cd jitterbug
uv sync
source .venv/bin/activate   # or prefix every command below with `uv run`
See docs/INSTALLATION.md for pip from a clone, pinned versions and troubleshooting.
Optional back ends
| Extra | Installs | Use it for |
|---|---|---|
bcp |
bayesian-changepoint + torch | The Bayesian detector used in the paper |
clustering |
scikit-learn | The non-sequential mode (--mode clustering) |
influx |
influxdb-client | Loading RTTs straight from InfluxDB |
zstd |
zstandard (not needed on Python 3.14+) | Reading and writing .zst-compressed files |
visualization |
matplotlib | jitterbug visualize and the plotting helpers |
jupyter |
JupyterLab, ipykernel | The notebooks in examples/ |
all |
everything above |
pip install "jitterbug-inference[bcp,visualization]"   # the paper's setup plus figures
uv sync --extra all                                     # from a clone: everything
System requirements
- Python 3.10 or higher
📖 Usage
Analyze a file
# Print the summary and the congestion periods found in the bundled dataset
jitterbug analyze examples/network_analysis/data/raw.csv

# Save the full results
jitterbug analyze examples/network_analysis/data/raw.csv --output results.json

# Reproduce the paper: Bayesian change points + KS test (needs `uv sync --extra bcp`)
jitterbug analyze examples/network_analysis/data/raw.csv --algorithm bcp --method ks_test

# Non-sequential mode: cluster intervals by (latency, jitter) (needs `--extra clustering`)
jitterbug analyze examples/network_analysis/data/raw.csv --mode clustering

# Only the summary table
jitterbug analyze examples/network_analysis/data/raw.csv --summary-only

# CSV instead of JSON (Parquet is also supported if `pyarrow` is installed)
jitterbug analyze rtts.csv --output results.csv --output-format csv

# Zstandard-compressed input and output: a trailing .zst is enough (needs the `zstd` extra
# before Python 3.14)
jitterbug analyze rtts.csv.zst --output results.json.zst
Validate input before analyzing
jitterbug validate rtts.csv --verbose
Plot the analysis
# Five PNG figures (raw RTT, minimum RTT, change points, verdicts, confidence) at 300 dpi;
# needs `uv sync --extra visualization`
jitterbug visualize examples/network_analysis/data/raw.csv --output-dir plots
The figures are described in docs/VISUALIZATION_USAGE.md, together with the JitterbugPlotter API for your own scripts.
Configuration files
# Write a template with every option and its default
jitterbug config --template --output config.yaml

# Use it
jitterbug analyze rtts.csv --config config.yaml
Additional commands
jitterbug version
jitterbug --help
jitterbug analyze --help
Python API
from pathlib import Path

from jitterbug import JitterbugAnalyzer, JitterbugConfig

config = JitterbugConfig()  # or JitterbugConfig.from_file(Path("config.yaml"))
analyzer = JitterbugAnalyzer(config)

results = analyzer.analyze_from_file("examples/network_analysis/data/raw.csv")

for period in results.get_congested_periods():
    print(period.start_timestamp, period.end_timestamp, period.confidence)

summary = analyzer.get_summary_statistics(results)
print(
    f"{summary['congested_periods']} congested periods, "
    f"{summary['congestion_duration_seconds']:.0f} s in total"
)
analyze_from_dataframe(df) accepts a pandas DataFrame with epoch and values columns, and analyze(dataset) an RTTDataset you built yourself.
Input formats
The contract (columns, units, ordering, what is dropped) is in docs/INPUT_FORMATS.md.
CSV: one RTT sample per row, epoch seconds and milliseconds.
epoch,values
1512144010.0,63.86
1512144010.0,66.52
1512144020.0,85.2
scamper JSON (ping records, one per line):
{"type":"ping","src":"192.168.1.1","dst":"8.8.8.8","responses":[{"rtt":1.712,"tx":{"sec":1752855461,"usec":719258}}]}
InfluxDB (uv sync --extra influx):
from jitterbug.io import DataLoader

dataset = DataLoader().load_from_influxdb(
    url="http://localhost:8086",
    token="...",
    org="my-org",
    bucket="network-metrics",
    query='from(bucket:"network-metrics") |> range(start: -1h) |> filter(fn: (r) => r._measurement == "rtt")',
)
🔧 Configuration
Every option lives in a Pydantic model and can be set from a YAML/JSON file or from the CLI flags. jitterbug config --template prints the full set; the important ones:
analysis_mode: sequential      # sequential | clustering (see docs/CLUSTERING_MODE.md)

change_point_detection:
  algorithm: ruptures          # ruptures | bcp
  threshold: 0.25
  min_time_elapsed: 1800       # seconds between change points
  ruptures_model: rbf
  ruptures_penalty: 10.0

jitter_analysis:
  method: jitter_dispersion    # jitter_dispersion | ks_test
  threshold: 0.25
  moving_average_order: 6
  moving_iqr_order: 4
  significance_level: 0.05

latency_jump:
  threshold: 0.5               # minimum-RTT increase (ms) that counts as a jump

data_processing:
  minimum_interval_minutes: 15 # width of the minimum-RTT intervals
  outlier_detection: true
  outlier_threshold: 3.0

clustering:                    # used when analysis_mode is clustering
  algorithm: gmm               # gmm | kmeans | kmeans_silhouette
  min_period_intervals: 2      # temporal smoothing, in intervals
  min_ks_statistic: 0.1        # smallest KS statistic that counts as a jitter change

output_format: json            # json | csv | parquet (parquet needs pyarrow)
verbose: false
Top-level options can also come from environment variables with the JITTERBUG_ prefix:
export JITTERBUG_VERBOSE=true
export JITTERBUG_OUTPUT_FORMAT=csv
How the analysis works
- Minimum-RTT intervals: the raw samples are binned (15 min by default) and the minimum of each bin is kept, which removes most queueing noise.
- Change point detection on the minimum-RTT series marks the boundaries between periods.
- Latency jump: a period is a candidate if its mean minimum RTT rises above the previous period's by more than
latency_jump.threshold. - Jitter test: jitter dispersion (variance of the filtered jitter series) or a KS test of the RTT distributions on both sides of the change point.
- Congestion inference: a period is congested when both tests agree; each result carries a confidence and the evidence behind it.
The clustering mode (--mode clustering) replaces steps 2–3's sequential comparison: intervals are clustered by (minimum RTT, jitter IQR) and each cluster is compared with the lowest-latency one, wherever its intervals fall in time. On the paper dataset the Gaussian mixture recovers all 15 reference congestion periods, plus 2 at the ends of the data where the sequential reference has no verdict. See docs/CLUSTERING_MODE.md.
ruptures and bcp are the two detectors evaluated in the paper; see docs/ALGORITHM_SELECTION_GUIDE.md for when to use which.
🏗️ Architecture
src/jitterbug/
├── analyzer.py             # JitterbugAnalyzer: orchestrates the pipeline below
├── models/                 # Pydantic models
│   ├── rtt_data.py         #   RTTMeasurement, RTTDataset, MinimumRTTDataset
│   ├── analysis.py         #   ChangePoint, LatencyJump, JitterAnalysis, CongestionInference
│   └── config.py           #   JitterbugConfig and the per-stage configs (BaseSettings)
├── detection/              # Change point detection
│   ├── change_point_detector.py   # dispatch on config.algorithm
│   └── algorithms.py       #   RupturesDetector, BayesianChangePointDetector (bcp)
├── analysis/               # Period classification
│   ├── latency_jump_analyzer.py
│   ├── jitter_analyzer.py  #   jitter dispersion and KS test
│   ├── congestion_inference_analyzer.py
│   └── clustering_analyzer.py     # non-sequential mode (GMM / k-means over intervals)
├── io/                     # DataLoader (CSV, scamper JSON, InfluxDB) and exporters
├── cli/main.py             # Typer CLI: analyze, validate, config, visualize, version
└── visualization/          # JitterbugPlotter (matplotlib): the figures behind `jitterbug visualize`
Bundled data: examples/network_analysis/data/raw.csv is the PAM 2022 dataset, and examples/network_analysis/expected_results/ holds the paper's reference output for both jitter methods.
🧪 Development
# Clone repository
git clone https://github.com/estcarisimo/jitterbug.git
cd jitterbug

# Environment with the dev tools (the `dev` dependency group is installed by default)
uv sync --extra visualization

# Install pre-commit hooks (ruff lint + format on staged files)
uv run pre-commit install
Running tests
uv run pytest
uv run pytest --cov=jitterbug --cov-report=term-missing
uv run pytest tests/test_cli.py -v
The fast suite runs in about twenty seconds and needs no network; the Bayesian regression tests (-m slow) add about two seconds and need the bcp extra. Coverage is about 90 % and CI fails below 75 %.
Code quality
uv run ruff check src/ tests/ examples/ tools/
uv run ruff format src/ tests/ examples/ tools/
uv run mypy src/jitterbug
ruff check, ruff format --check and mypy are all enforced in CI. See CONTRIBUTING.md for the pull request workflow.
Building
uv build
uv pip install dist/*.whl
📊 Example Output
jitterbug analyze examples/network_analysis/data/raw.csv with the default ruptures detector:
📊 Analysis Summary
┌─────────────────────┬────────────┐
│ Total Periods       │ 22         │
│ Congested Periods   │ 11         │
│ Congestion Ratio    │ 24.44%     │
│ Total Duration      │ 1197000.0s │
│ Congestion Duration │ 292497.0s  │
│ Average Confidence  │ 0.90       │
└─────────────────────┴────────────┘

🔍 Congestion Periods
┏━━━━━━━━━━━━━┳━━━━━━━━━━━━━┳━━━━━━━━━━┳━━━━━━━━━━━━┳━━━━━━━━━━━━┳━━━━━━━━━━━━━┓
┃             ┃             ┃          ┃            ┃ Latency    ┃ Jitter      ┃
┃ Start (UTC) ┃ End (UTC)   ┃ Duration ┃ Confidence ┃ Jump       ┃ Change      ┃
┡━━━━━━━━━━━━━╇━━━━━━━━━━━━━╇━━━━━━━━━━╇━━━━━━━━━━━━╇━━━━━━━━━━━━╇━━━━━━━━━━━━━┩
│ 2017-12-02  │ 2017-12-02  │ 27000.0s │ 0.90       │ ✓          │ ✓           │
│ 12:00:10    │ 19:30:10    │          │            │            │             │
│ 2017-12-03  │ 2017-12-03  │ 27000.0s │ 0.90       │ ✓          │ ✓           │
│ 11:45:09    │ 19:15:09    │          │            │            │             │
│ 2017-12-04  │ 2017-12-04  │ 18000.0s │ 0.90       │ ✓          │ ✓           │
│ 14:00:10    │ 19:00:10    │          │            │            │             │
│ ...         │ ...         │          │            │            │             │
└─────────────┴─────────────┴──────────┴────────────┴────────────┴─────────────┘
The dataset shows the daily congestion episodes the paper analyzes. With the Bayesian detector and the KS test (--algorithm bcp --method ks_test) the output matches the reference in examples/network_analysis/expected_results/:
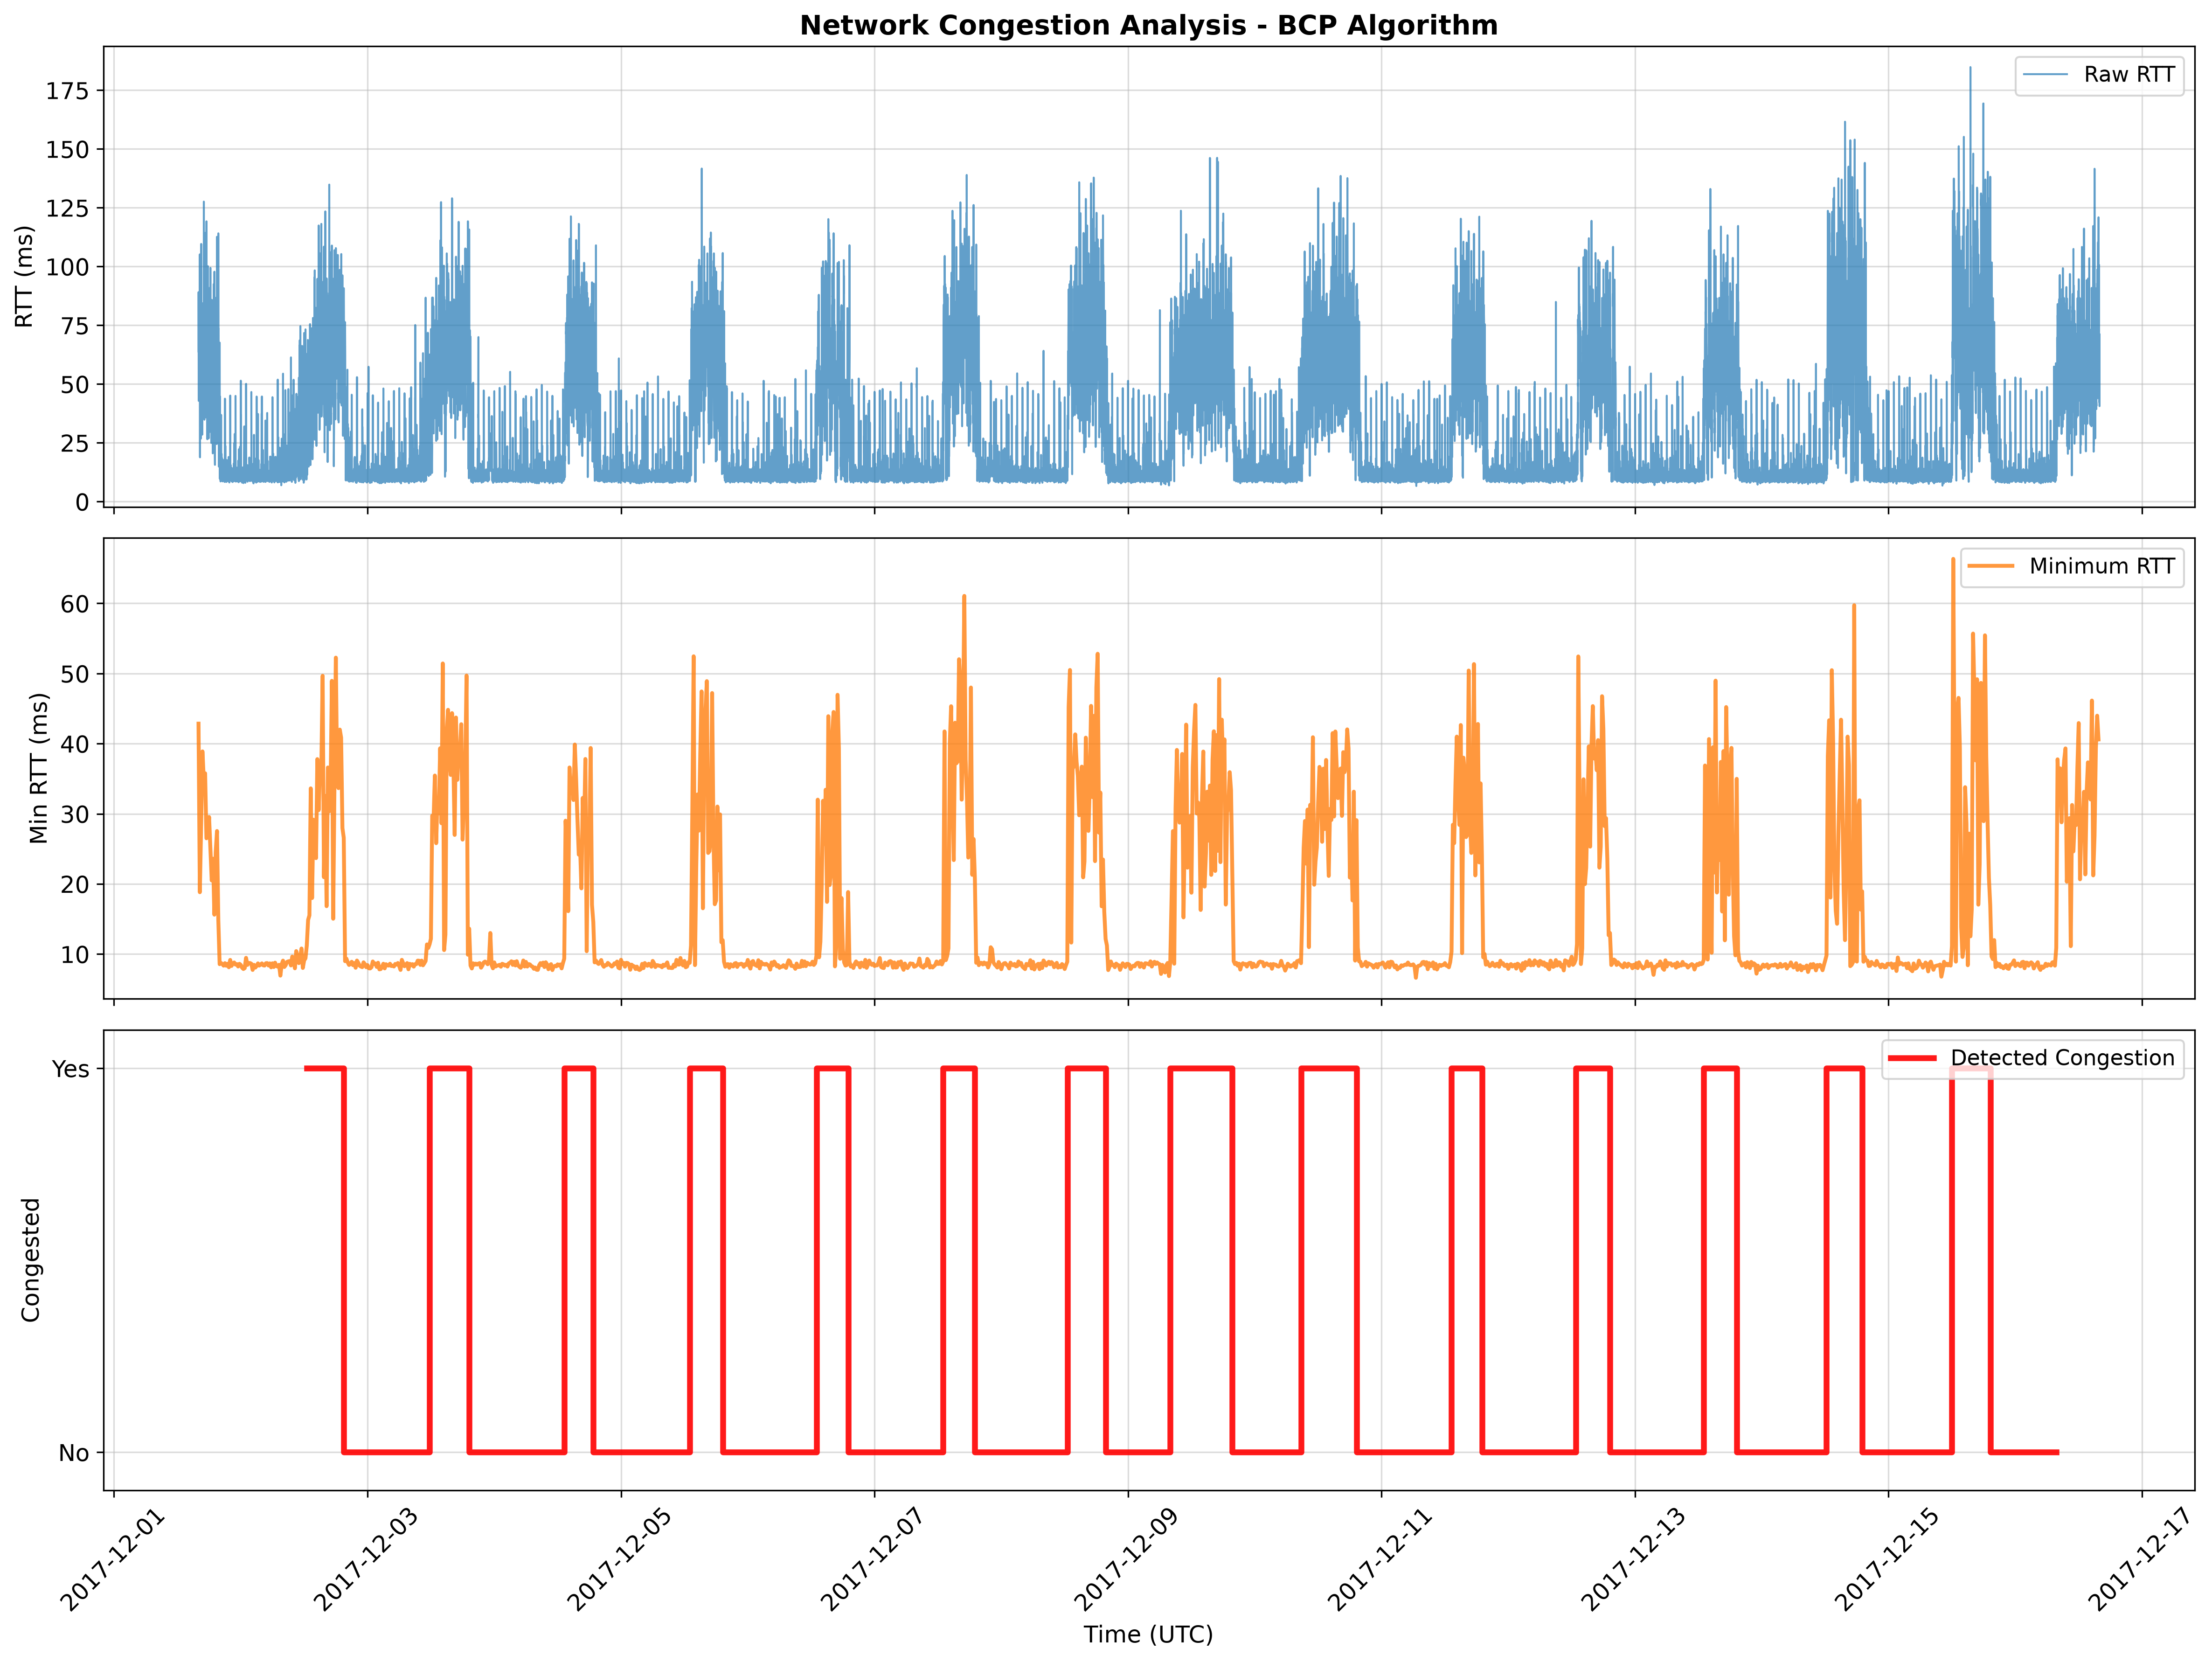
Each entry in results.json carries the period, the verdict, and the evidence:
{
  "start_timestamp": "2017-12-02 12:00:10+00:00",
  "end_timestamp": "2017-12-02 19:30:10+00:00",
  "is_congested": true,
  "confidence": 0.9,
  "latency_jump": {"has_jump": true, "magnitude": 20.62, "threshold": 0.5},
  "jitter_analysis": {"method": "jitter_dispersion", "has_significant_jitter": true, "jitter_metric": 14.55}
}
🤝 Contributing
Contributions are welcome! Please see the Contributing Guide for the development setup, the checks every change must pass, and the pull request workflow.
- Fork the repository
- Create a feature branch (
git switch -c feat/amazing-feature) - Commit your changes (
git commit -m 'feat: add amazing feature') - Push to the branch (
git push origin feat/amazing-feature) - Open a Pull Request
Project documentation
| Document | Contents |
|---|---|
| CONTRIBUTING.md | Development setup, workflow, PR expectations |
| CHANGELOG.md | Release history |
| AGENTS.md | Guidance for AI coding agents working in this repo |
| SECURITY.md | Vulnerability reporting, and what data this tool handles |
| CODE_OF_CONDUCT.md | Community standards |
| docs/INSTALLATION.md | Installation details and troubleshooting |
| docs/INPUT_FORMATS.md | Input contract: CSV, scamper JSON, DataFrame, InfluxDB |
| docs/ALGORITHM_SELECTION_GUIDE.md | Choosing a change point detector |
| docs/ALGORITHM_USAGE.md | Per-detector options and examples |
| docs/VISUALIZATION_USAGE.md | jitterbug visualize, the five figures, JitterbugPlotter |
| examples/README.md | Scripts and notebooks |
📄 License
This project is licensed under the MIT License - see the LICENSE file for details.
🔗 Related Resources
- Jitterbug paper (PAM 2022)
- bayesian_changepoint_detection: the Bayesian detector behind the
bcpextra - ruptures: the default change point library
- scamper: the measurement tool whose JSON output Jitterbug reads
🙏 Acknowledgments
Jitterbug is the software behind the following paper. If you use it in your research, please cite it (also available as CITATION.cff for GitHub's "Cite this repository" button):
Paper: "Jitterbug: A New Framework for Jitter-Based Congestion Inference" Authors: Esteban Carisimo, Ricky K. P. Mok, David D. Clark, and K. C. Claffy Conference: Passive and Active Measurement (PAM), March 2022 Link: https://doi.org/10.1007/978-3-030-98785-5_7
@InProceedings{carisimo2022jitterbug,
  author    = {Carisimo, Esteban and Mok, Ricky K. P. and Clark, David D. and Claffy, K. C.},
  title     = {Jitterbug: A New Framework for Jitter-Based Congestion Inference},
  booktitle = {Passive and Active Measurement},
  year      = {2022},
  publisher = {Springer International Publishing},
  pages     = {155--179},
  doi       = {10.1007/978-3-030-98785-5_7}
}
Thanks to the authors of ruptures and bayesian_changepoint_detection for the libraries this framework builds on.
1 maintainer

Release files for jitterbug-inference 2.3.0
For a detailed explanation of source distributions (sdists) and built distributions (wheels), please see the package formats documentation.
Source distribution (sdist)
| File | Size | Uploaded | |
|---|---|---|---|
| jitterbug_inference-2.3.0.tar.gz | 52.1 kB | Details |
Built distribution (wheel)
| File | Interpreter | ABI | Platform | Reset |
|---|---|---|---|---|
| jitterbug_inference-2.3.0-py3-none-any.whl | Python 3 | none | any | Details |
Total release size: 108.9 kB
Release files / jitterbug_inference-2.3.0.tar.gz
| Download URL | jitterbug_inference-2.3.0.tar.gz |
|---|---|
| Size | 52.1 kB |
| Tags | Source |
|
SHA-256 checksum How to use checksums |
0c2399290e7854b0ad80e94f339dec11943ac81a21f19c12618edee4508ccf25
|
|
BLAKE2b-256 checksum How to use checksums |
f259a71abe9cbcbfa3318ff28bcfdb6d33b5c69b0affe7e0991c7e5bfd60d614
|
| Upload date | |
|
Uploaded using Trusted Publishing? What is trusted publishing? |
Yes |
| Uploaded via |
twine/7.0.0 CPython/3.13.14
|
Provenance
Provenance describes where a file came from. On PyPI, provenance is shared via attestations, which provide a verifiable record of the build or publishing details. View details, limitations and caveats.


PyPI Publish Attestation
PyPI verified that this artifact, at this checksum, originated from the publisher listed below.
Signed by GitHub Actions, verified by PyPI on Sep 24, 2026.
Transparency logRelease files / jitterbug_inference-2.3.0-py3-none-any.whl
| Download URL | jitterbug_inference-2.3.0-py3-none-any.whl |
|---|---|
| Size | 56.8 kB |
| Tags | Python 3 |
|
SHA-256 checksum How to use checksums |
5ad51df35960549527d2b091e96d992f73a1a59264e3cbada43ddb65e8af8955
|
|
BLAKE2b-256 checksum How to use checksums |
d52490edb72945fe9695303fc8ef2de9c556be29db794a0ee5836f7043f427f6
|
| Upload date | |
|
Uploaded using Trusted Publishing? What is trusted publishing? |
Yes |
| Uploaded via |
twine/7.0.0 CPython/3.13.14
|
Provenance
Provenance describes where a file came from. On PyPI, provenance is shared via attestations, which provide a verifiable record of the build or publishing details. View details, limitations and caveats.
PyPI Publish Attestation
PyPI verified that this artifact, at this checksum, originated from the publisher listed below.
Signed by GitHub Actions, verified by PyPI on Sep 24, 2026.
Transparency log













