
jsonantt


jsonantt generates beautiful Gantt chart images from a simple JSON description.
Charts are rendered with matplotlib so they can be saved as .png, .pdf, .svg, and more.
📖 Full documentation: https://jsonantt.readthedocs.io
Open the web GUI · Run the GUI locally
Features
- Infinitely nestable tasks — define sub-tasks, sub-sub-tasks, etc., using either
tasksor legacychildren. - Composable task files — import task trees from other JSON files with
filename, either inline or nested under a wrapper task. - Auto date computation — parent task start/end are derived automatically from children when not specified.
- Milestone markers — easy
"milestone": trueflag with chart-level defaults and per-milestone marker overrides, including milestone chains on one row via adatelist. - Major milestones, rollups, and numbering — distinguish major milestones from regular milestones, optionally roll only major milestones up onto summary bars, add milestone edge colours, and label milestones as
M1,M2, ... in markers and tables. - Optional task descriptions and extra fields — add long-form context per task, plus arbitrary metadata like assignee or cost for table output.
- Fully colourable — set colours per-task; children inherit their parent's colour.
- Recursive child colour lightening — inherited subtask colours can optionally lighten at each nested level.
- Clean, indented y-axis labels — task names are left-aligned with proper indentation per depth level.
- Table output mode — render a task summary table with the same hierarchy and colour cues.
- Funded burn output — render cost-over-time charts and period matrix tables from numeric task fields.
- PNG / PDF / SVG output — whatever matplotlib supports.
- Interactive studio — open the GUI or run
jsonantt servefor a JSON editor with interactive Gantt, Table, Burn, Burndown, Burnup, and Burn table views.
Installation
pip install jsonantt
Or, directly from source:
git clone https://github.com/briday1/jsonantt.git
cd jsonantt
pip install -e .
Quick start
1. Create a JSON description
{
  "title": "My Project",
  "dateformat": "%Y-%m-%d",
  "style": {
    "milestone_color": "#FFD700",
    "milestone_marker": "D"
  },
  "tasks": [
    {
      "name": "Phase 1 – Planning",
      "tasks": [
        { "name": "Requirements", "start": "2024-01-08", "end": "2024-01-19" },
        { "name": "Architecture",  "start": "2024-01-15", "end": "2024-01-31" }
      ]
    },
    { "name": "Planning done", "milestone": true, "date": ["2024-01-24", "2024-01-31"] },
    {
      "name": "Phase 2 – Build",
      "color": "#70AD47",
      "children": [
        { "name": "Backend",  "start": "2024-02-01", "end": "2024-03-01" },
        { "name": "Frontend", "start": "2024-02-12", "end": "2024-03-08" }
      ]
    },
    { "name": "Launch", "milestone": true, "date": "2024-04-01", "color": "#FF5757" }
  ]
}
2. Generate the chart or table
CLI:
jsonantt project.json project.png
jsonantt project.json project.pdf   # vector PDF
jsonantt project.json project.svg   # scalable SVG
jsonantt --dpi 300 project.json project.png   # high-resolution PNG
jsonantt -r 1 project.json project.png   # top-level tasks only
jsonantt --renderdepth 2 project.json project.png   # include one child level
jsonantt -t project.json project-table.png   # task name / description table
jsonantt -t project.json project-table.svg   # scalable SVG table
jsonantt -t project.json project-table.csv   # CSV table export
jsonantt --dpi 300 -t project.json project-table.png   # high-resolution PNG table
jsonantt agreed.json compare.png --compare actual.json   # outline vs actual compare chart
jsonantt -t agreed.json compare-table.csv --compare actual.json   # compare table with signed offsets
jsonantt --burn project.json burn.png --burn-field cost --burn-period month --burn-group 0
jsonantt --burn-table project.json burn-table.csv --burn-field cost --burn-period quarter --burn-group 0
jsonantt project.json project.png --date-line today --date-line-color "#C00000"   # single target line
Python API:
See the complete Python and HTTP API reference for every mode, CLI-option mapping, source settings, comparison, and local-file/Git endpoints.
from jsonantt import load_chart, render_burn_chart, render_burn_table, render_chart, render_compare_chart, render_compare_table, render_table

config = load_chart("project.json")
actual = load_chart("actual.json")
render_chart(config, "project.png", dpi=150)
render_chart(config, "summary.png", dpi=150, render_depth=1)
render_table(config, "project-table.png", dpi=150)
render_compare_chart(config, actual, "compare.png", dpi=150)
render_compare_table(config, actual, "compare-table.csv", dpi=150)
render_burn_chart(config, "burn.png", dpi=150, field="cost", period="month", group_by=0)
render_burn_table(config, "burn-table.csv", dpi=150, field="cost", period="quarter", group_by=0)
render_depth=0 renders all nested levels. 1 renders only top-level tasks, 2 includes one level of children, and so on.
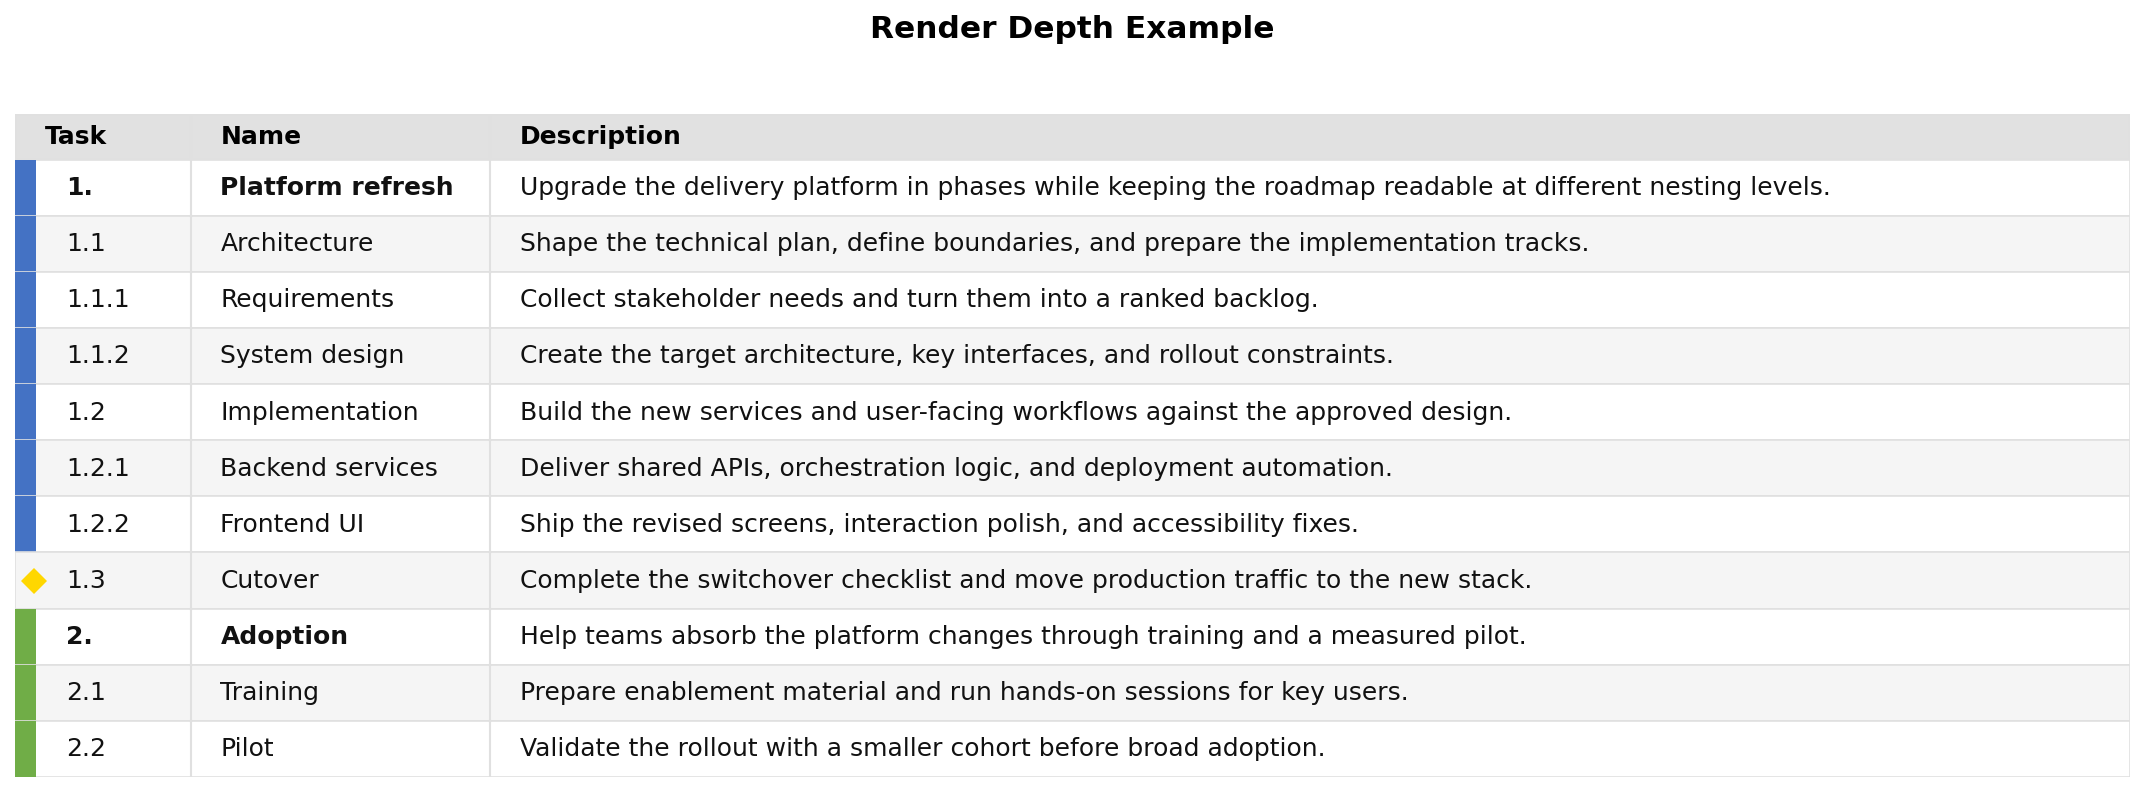
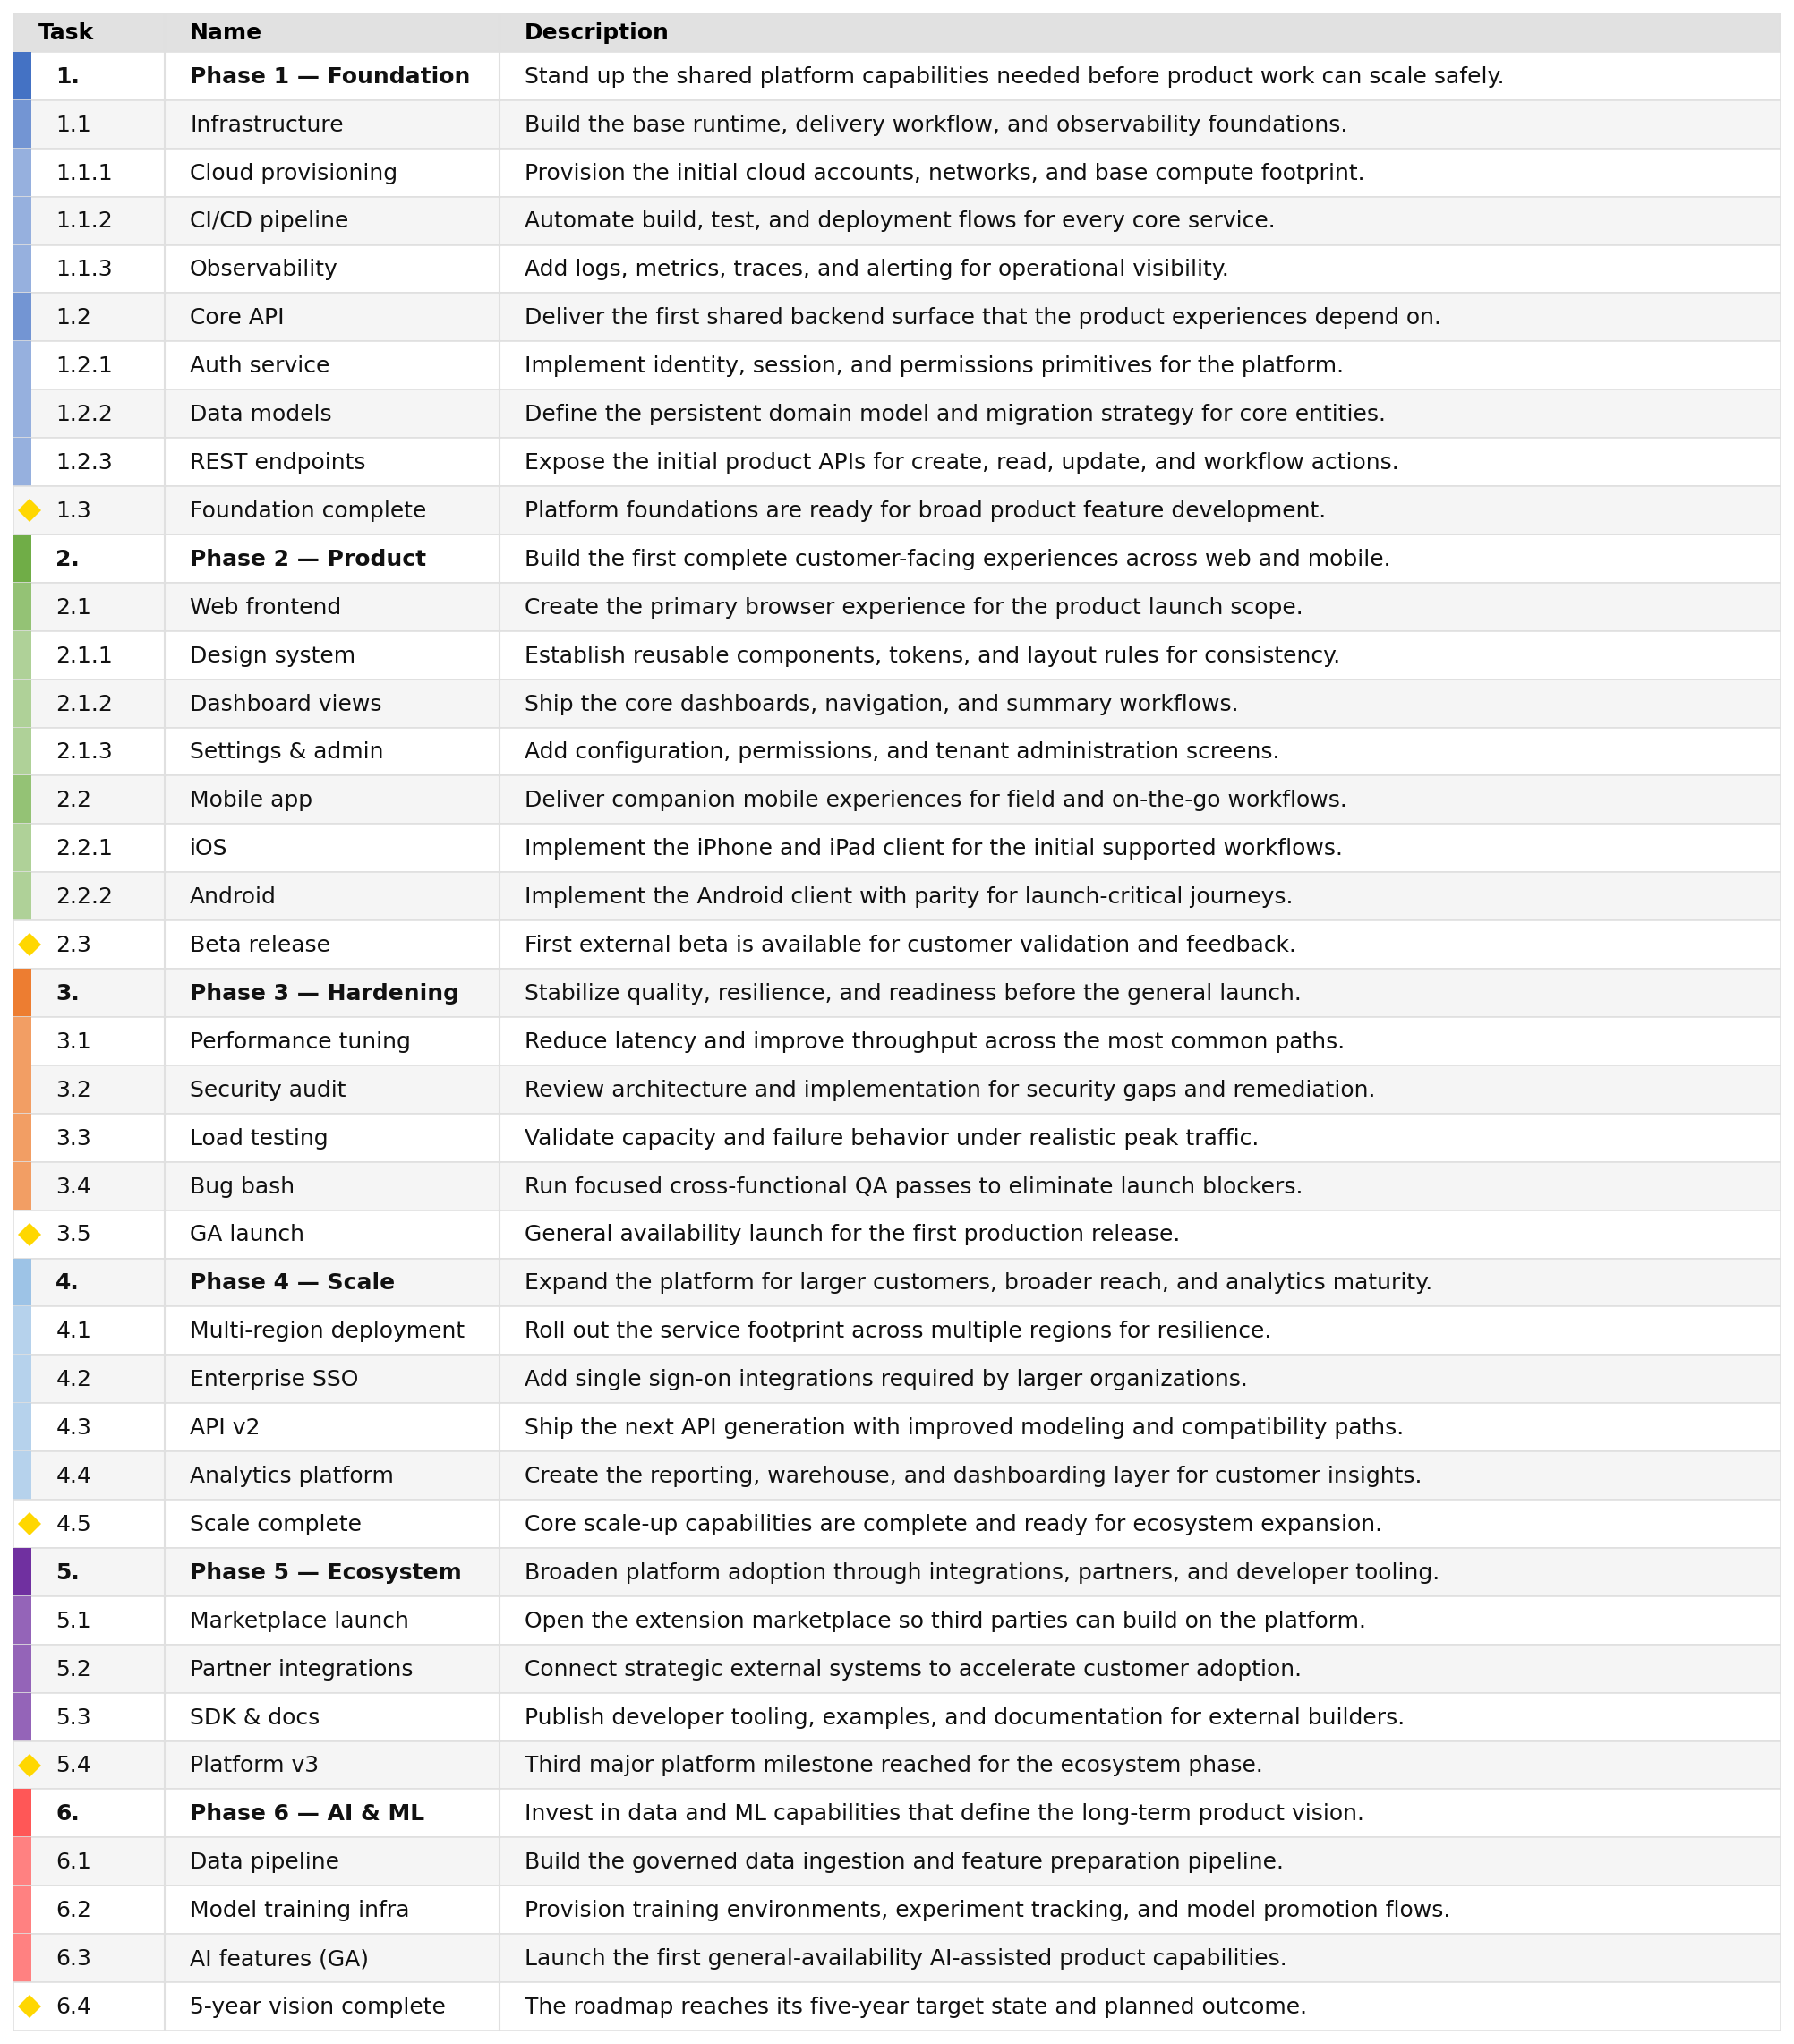
--table / -t switches the output to a table view. By default it renders Task, Name, and Description. The Task column keeps hierarchy numbering, the Name column stays unindented, style.table_colorize controls the side color accent, and style.table_show_markers controls whether milestone rows use a diamond marker in that gutter.
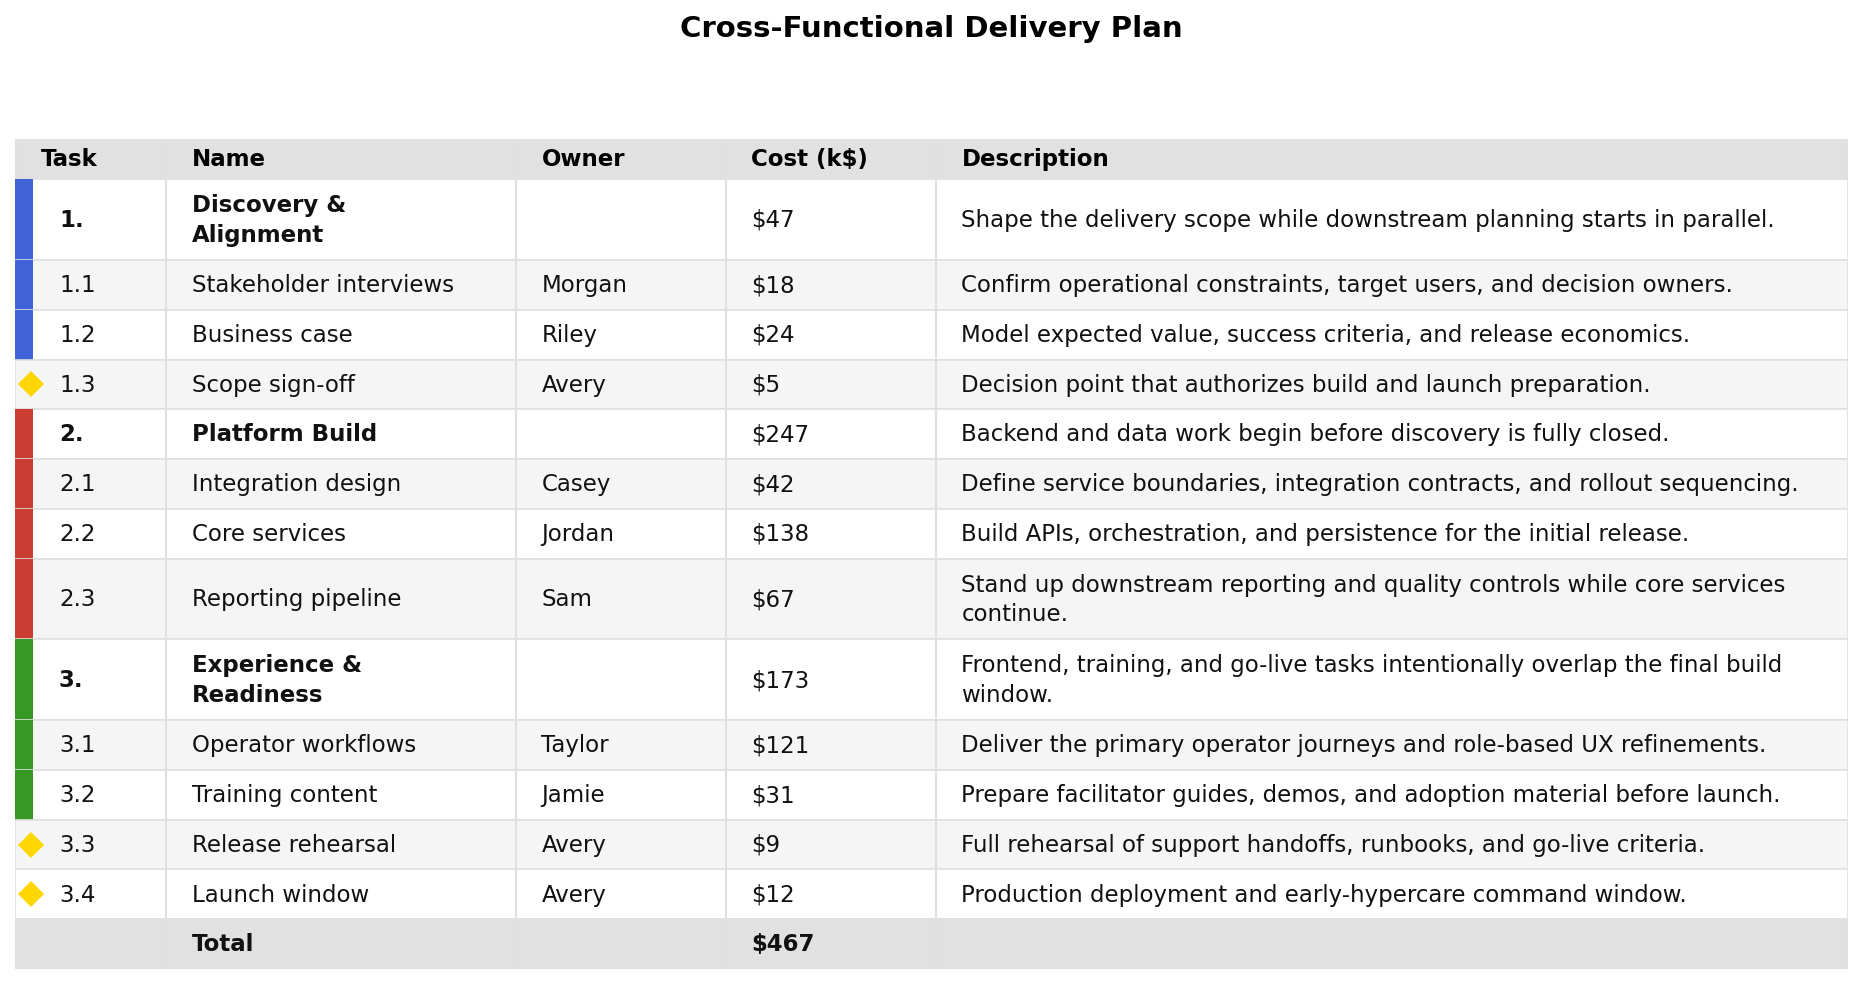
You can customize the table columns with style.table_columns. Each entry can be either a string field name or an object with field and optional title. The special fields task, name, and description preserve the existing behavior; any other field is read from the task object, including extra task keys like assignee, cost, or fte.
Column objects can also opt into numeric aggregation. Use rollup: "sum" to show a recursively summed value on parent rows, total: true to add a footer total for that column, and total_level to control which task depth contributes to that footer. When rollup is enabled, totals default to depth 0 so parent rollups are not double-counted.
For display-only unit conversion, set display_factor on the column. This multiplies the numeric value one time at render/export time, after the raw value has been read and after any rollup sum has been calculated. That makes it suitable both for converting FTE into annual dollars and for showing large values in k or M units by pairing a factor with a custom header title.
{
  "style": {
    "table_columns": [
      "task",
      "name",
      { "field": "assignee", "title": "Owner" },
      { "field": "fte", "title": "Annual Cost ($)", "rollup": "sum", "total": true, "total_level": 0, "display_factor": 250000 },
      "description"
    ]
  },
  "tasks": [
    {
      "name": "API Design",
      "start": "2024-01-01",
      "end": "2024-01-10",
      "assignee": "Morgan",
      "fte": 1.2,
      "description": "Finalize endpoints and review contracts."
    }
  ]
}
Examples:
- FTE to annualized dollars:
{ "field": "fte", "title": "Annual Cost ($)", "display_factor": 250000 } - Dollars to thousands:
{ "field": "cost", "title": "Cost (k$)", "display_factor": 0.001 } - Dollars to millions:
{ "field": "cost", "title": "Cost ($M)", "display_factor": 0.000001 }
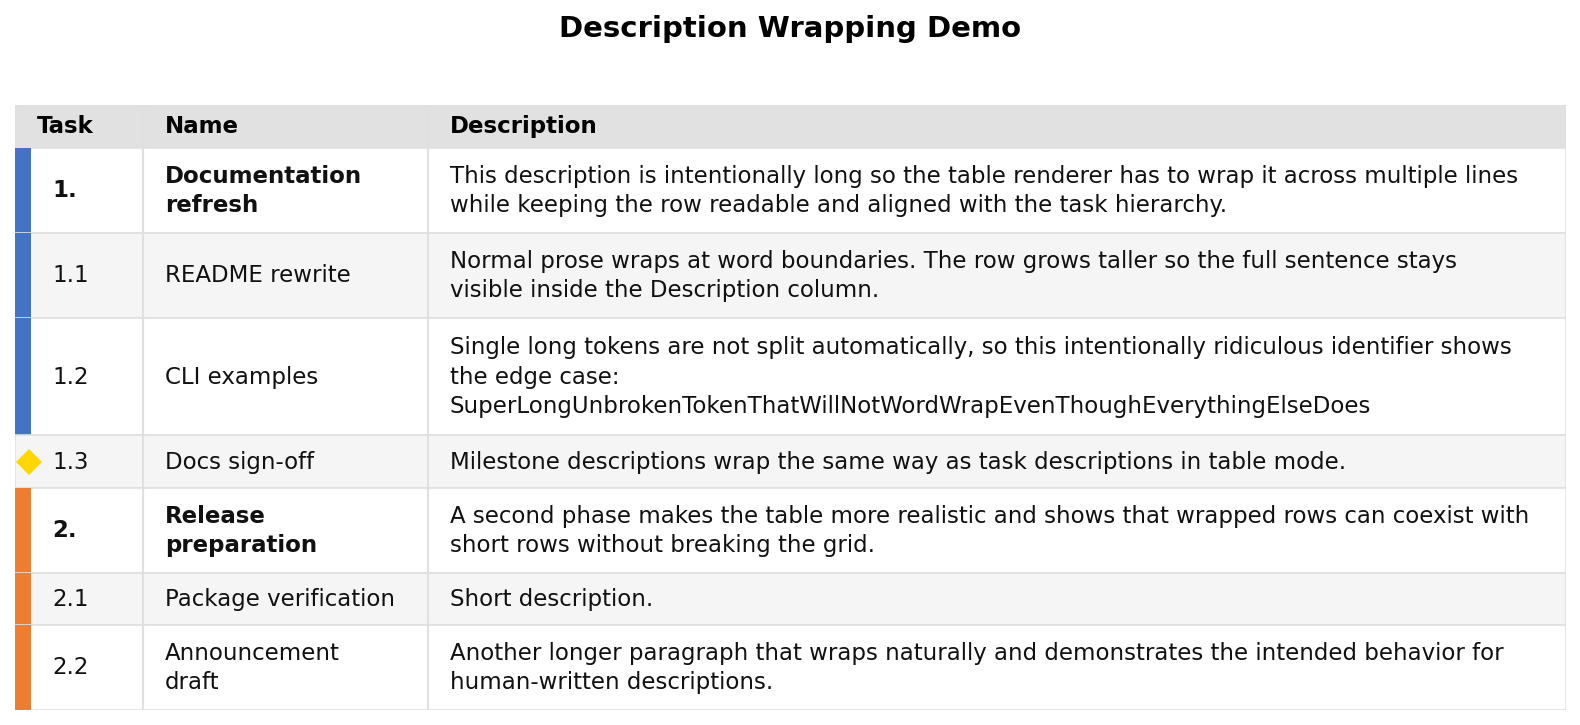
Description and Name cells wrap to the measured rendered width of the column, and the row height expands to fit the wrapped lines. Very long unbroken tokens are not split mid-word, so they can still clip horizontally.
--milestones-only works with --table to render only milestone rows in a dedicated milestone table. --no-milestones does the opposite and excludes milestones.
If the table output path ends in .csv, jsonantt writes CSV instead of an image. .csv output is only accepted for --table/--burn-table modes; Gantt and burn charts must be exported as .png (with --dpi) or .svg, and the CLI reports a clear error for any other extension or combination.
The studio uses this same jsonantt.renderer (matplotlib) code
for interactive SVG previews and PNG/SVG/CSV exports. jsonantt serve runs it
locally; static hosting runs the bundled Python source in a Pyodide worker.
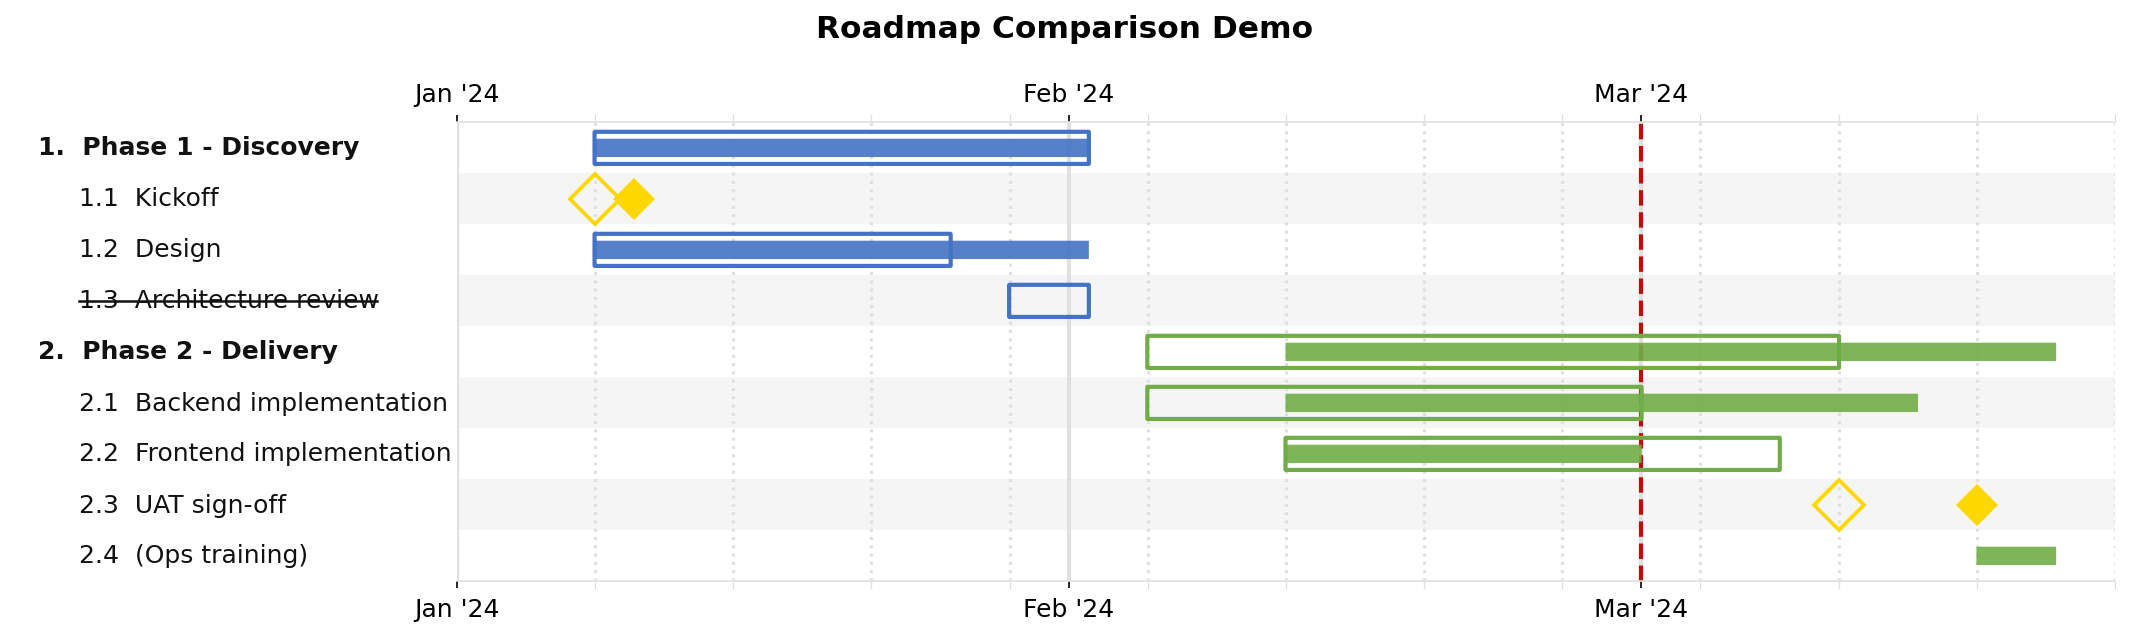
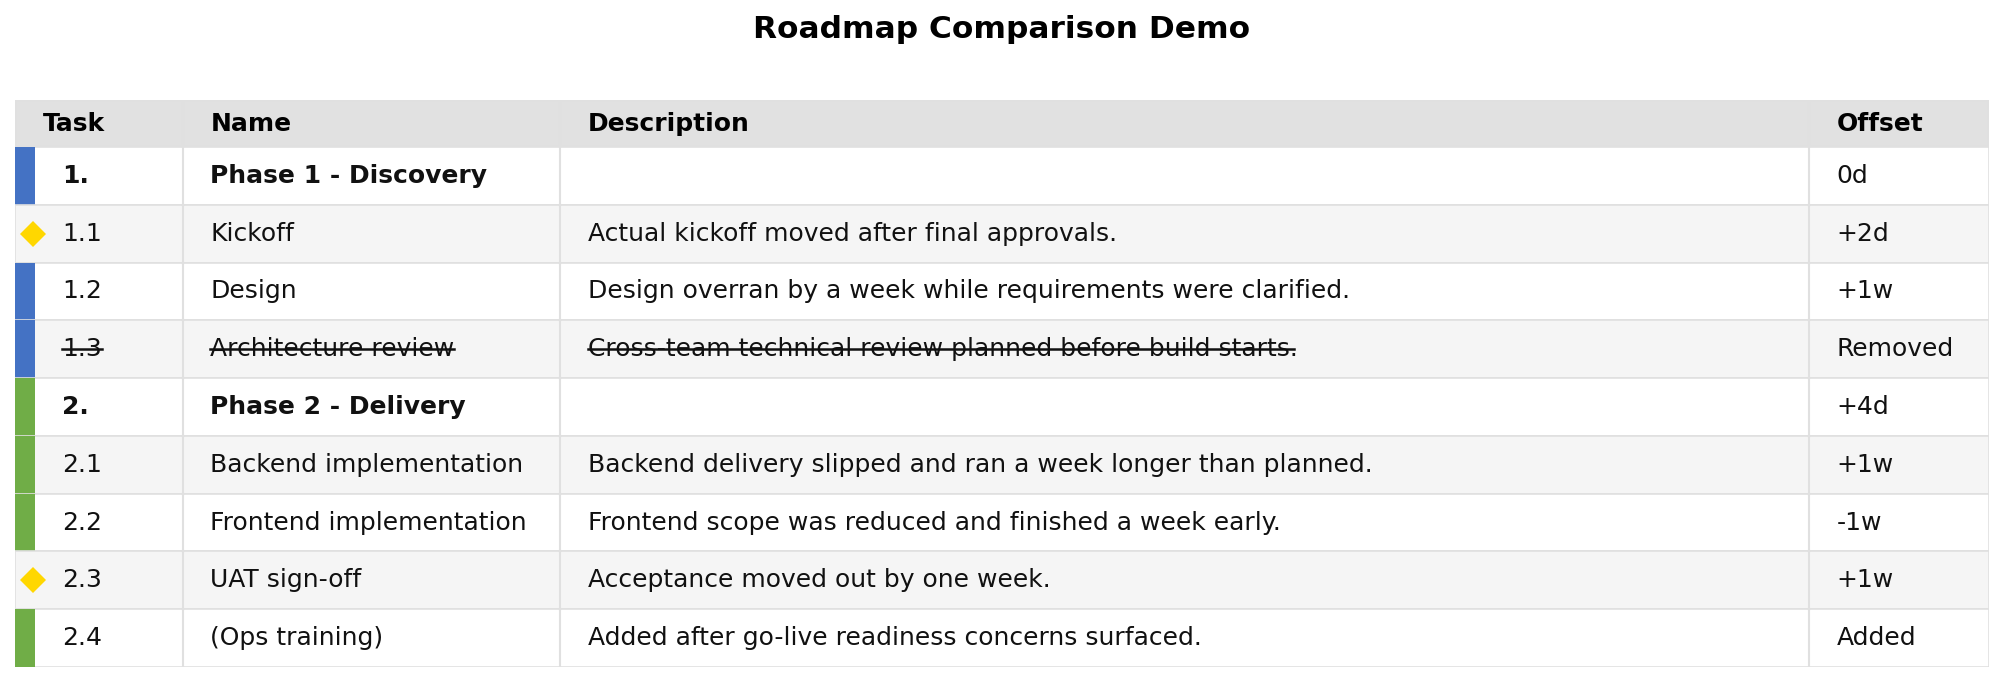
--compare turns the first JSON input into the planned/agreed baseline and overlays the second JSON as the updated/actual state. In compare charts, planned bars are drawn as slightly larger unfilled outlines, actual bars are drawn normally, removed planned tasks are struck through with no actual bar, and actual-only tasks render as normal filled bars. In compare tables and CSV output, the Offset column shows signed duration changes like +2d, -1w, +3mo, or +1y; milestones use the signed date shift instead.
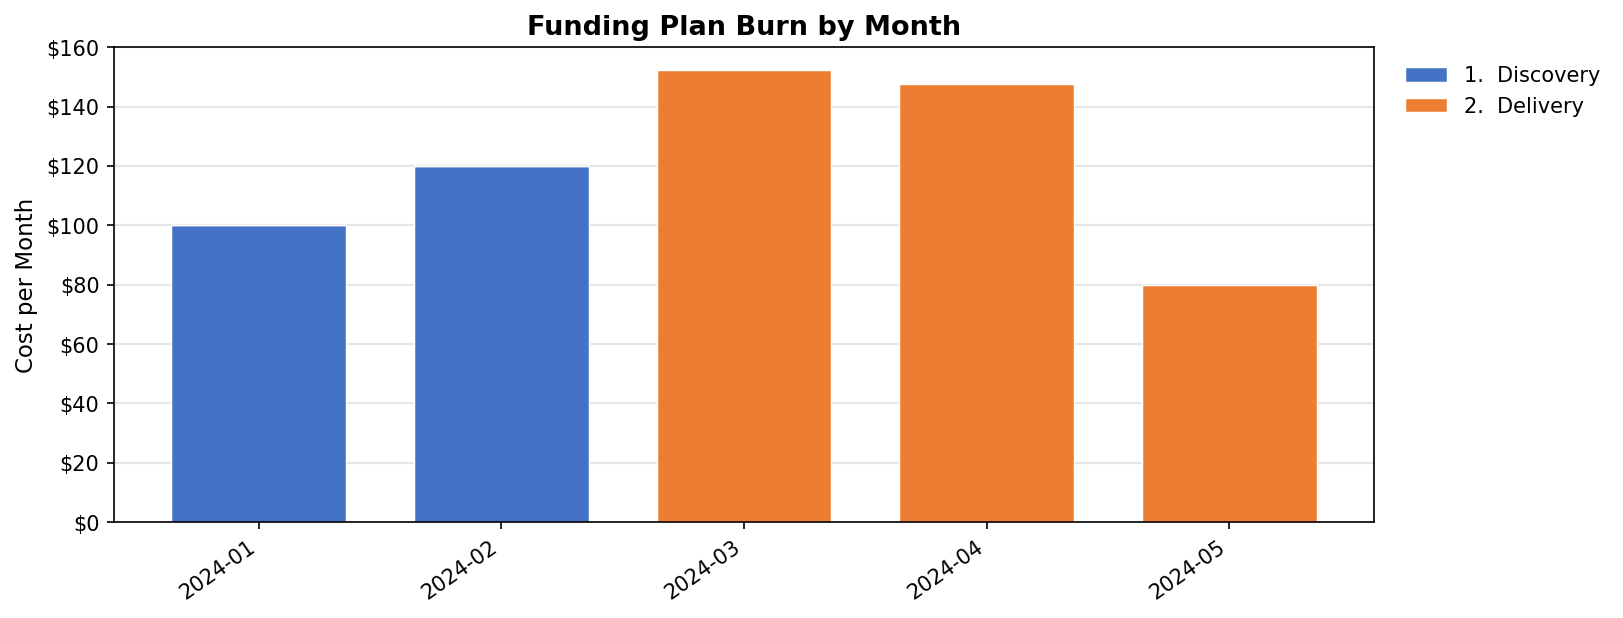
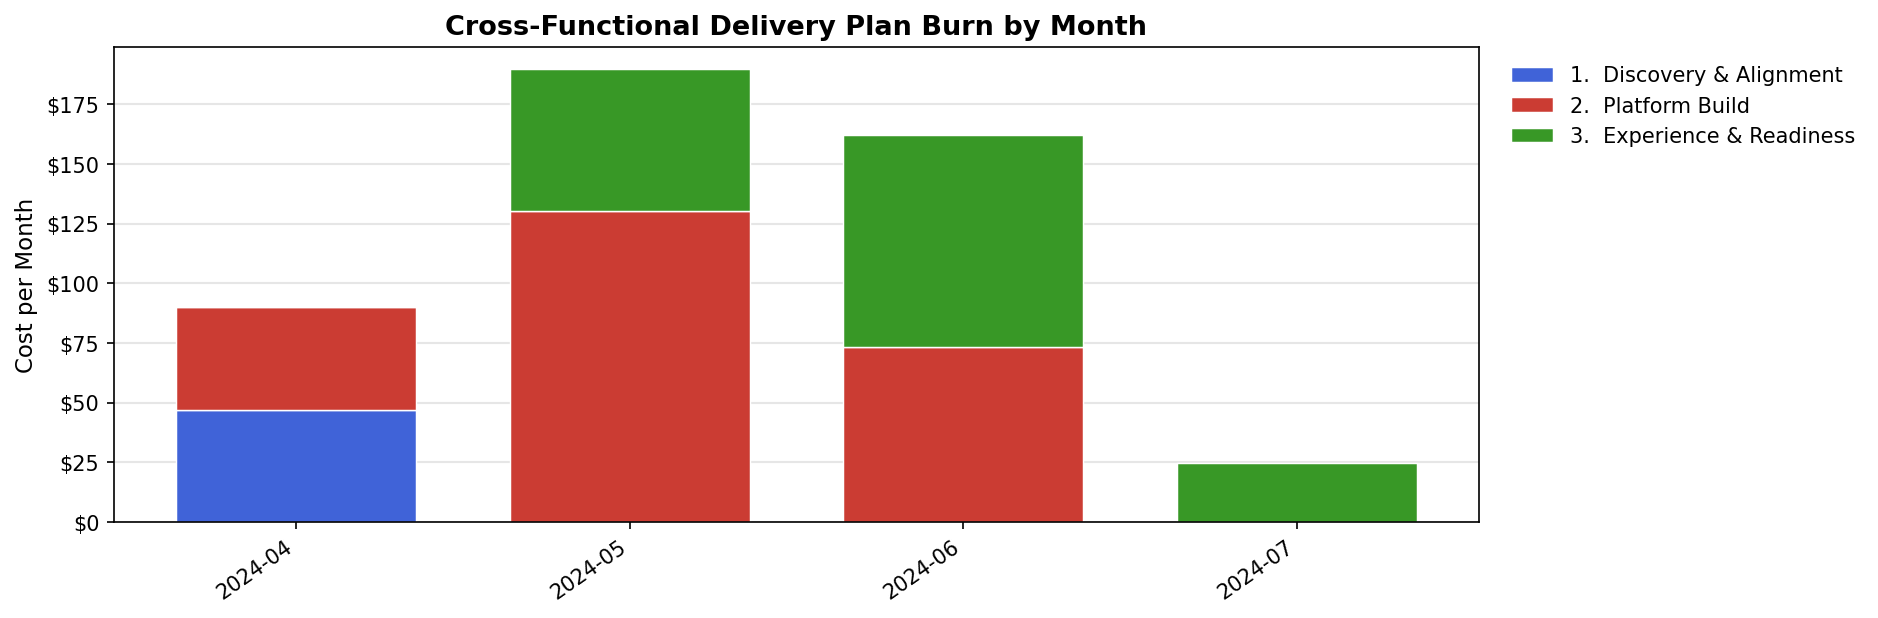
--burn renders a funded burn chart from a numeric task field such as cost. Burn output always allocates from the lowest tasks that actually carry a numeric value, spreads each task uniformly over its duration, and only then groups the result. That means collapsing to top-level or total views does not lose deeper task spend.
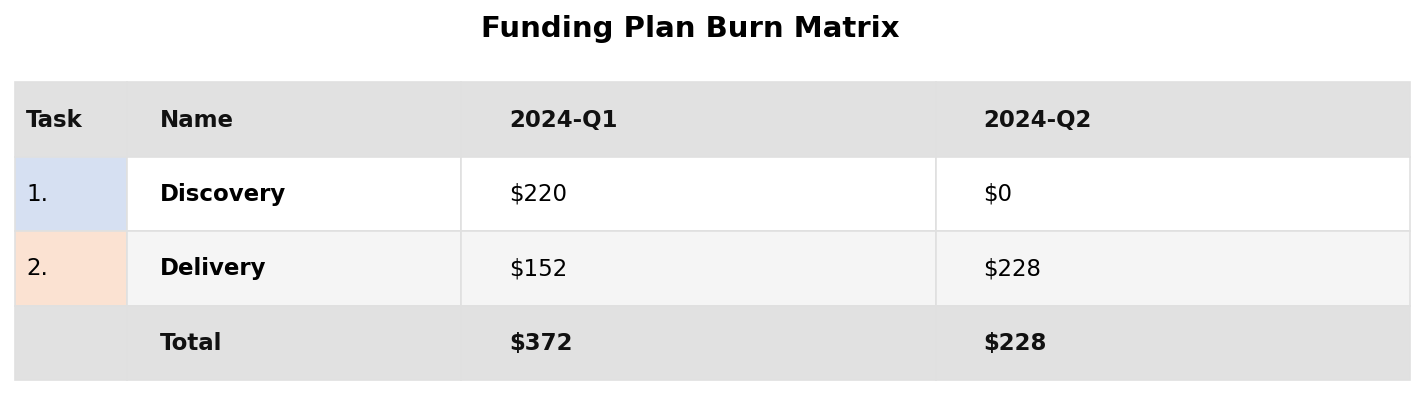
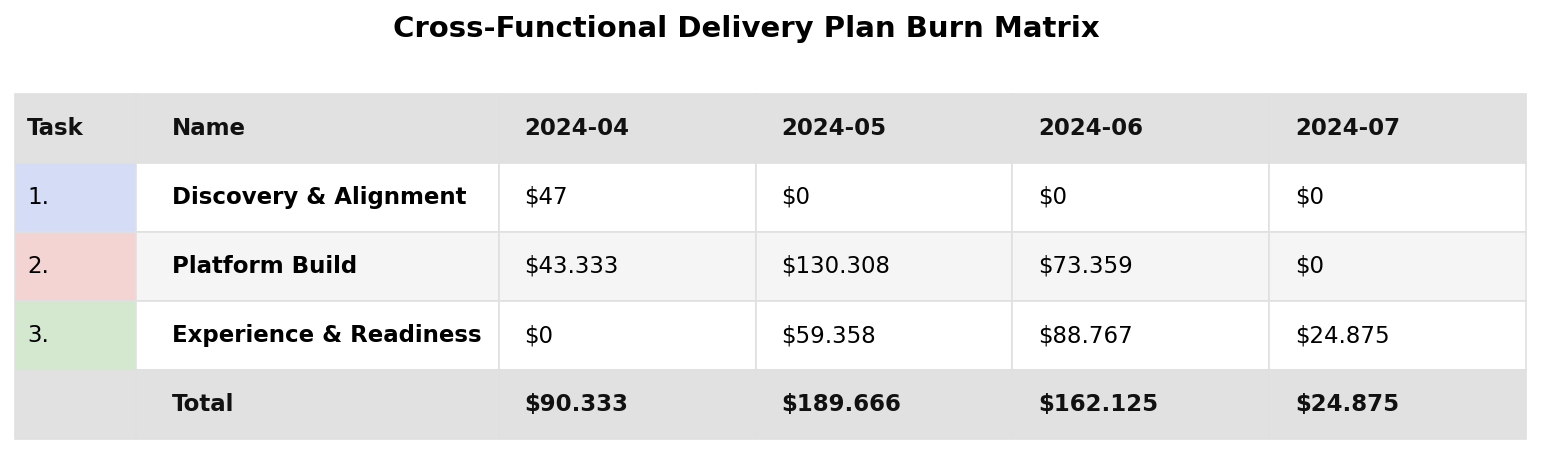
Use --burn-period to choose day, week, month, quarter, or year. Use --burn-group total for one overall series, --burn-group leaf for the lowest direct-cost tasks, or a depth integer where 0 is top-level, 1 is subtasks, 2 is sub-subtasks, and so on. --burn-table renders the same burn data as a matrix with one row per grouped task and one column per time bucket. --burn-display-factor applies a display-only multiplier once, after burn allocation, so the same scaling rules used for cost tables also work here.
--burndown renders remaining planned allocation; --burnup renders cumulative
planned allocation with dotted, colour-matched budget lines per task/group:
jsonantt --burndown project.json burndown.png --burn-period quarter
jsonantt --burnup project.json burnup.png --burn-period quarter --burn-group leaf --dpi 300
Use --date-line to draw a single vertical reference line on Gantt, burndown, or burnup outputs. It accepts either a date in the input file's dateformat or the special value today. Use --date-line-color to control its color. The source setting style.today_marker also enables today's marker in these views, including GUI previews and exports. Burn markers appear only within the plotted date range.
Interactive studio
To display cost values as currency in thousands or millions, set optional style
fields such as "value_prefix": "$", "value_scale": "millions", and
"value_decimals": 2. A raw cost of 1250000 then displays as $1.25M in
graphs and tables, including exports. Defaults preserve existing output; raw
numbers never change. Configure this in Chart settings → Value display, or
see the value-formatting reference.
The CLI also accepts display overrides (without editing your JSON):
jsonantt --burnup project.json burnup.png --value-scale millions --value-prefix '$' --value-decimals 2
jsonantt --burn-table project.json burn.csv --value-scale thousands --value-prefix '$'
Scales are units, thousands, millions, and billions. --value-suffix adds
an annotation without scaling; --value-fields cost,budget selects amount fields.
For burn views, CLI overrides apply to the selected --burn-field by default.
All options are optional; existing output and source values are unchanged.
All six previews use the CLI renderer's SVG directly: Gantt, Table, Burn, Burndown, Burnup, and Burn table. These are interactive SVG elements—not pictures—with task/arrow selection and tooltips. Local instances use Python on the server; static hosting runs the same Python sources in a Pyodide worker. There is no approximate browser drawing fallback. Built-in demos ship with exact, interactive Python-rendered SVG previews. Previously rendered charts restore from a bounded browser cache on refresh, keyed to source, view settings, and renderer build. Python warms up in the background for edits and exports; matplotlib downloads alongside the interpreter. New uncached charts still need the runtime on first use.
Gantt has view controls for Rollup depth and Roll up milestones, saved in the source and shared with exports. Task Properties includes editable Cost in its original units, before any display scaling.
Launch the jsonantt GUI — no installation needed. Try the delivery demo, milestones demo, or cost/burn demo.
For a local instance with PNG/SVG/CSV exports, jsonantt serve opens the same studio — a
source sidebar, a live canvas, and a properties/objects side panel, styled after
pugflow:
jsonantt serve                  # start with the built-in starter chart
jsonantt serve project.json     # open an existing chart
jsonantt serve --port 8080 --no-browser
- Sidebar — JSON editor with line numbers and syntax highlighting. Every edit re-renders the canvas instantly; parse errors are shown inline without discarding the last good render.
- Canvas tabs — Gantt (default, live-updating) and Table (the same task table the
CLI renders, honouring
style.table_columns,table_colorize, andtable_show_markers). Table filters show all rows, milestones only, or tasks without milestones. Burn shows period-spend bars; separate Burndown and Burnup tabs show remaining and cumulative planned allocation. Burnup includes dotted task/group budget lines. Burn table shows period totals. All share field, period, grouping, and scaling controls. Clicking a bar, milestone, or table row keeps the objects panel and properties box in sync. - Chart settings — the Settings → Chart settings… dialog exposes the overall chart
configuration:
title,dateformat, chartstart/end(with a calendar date picker), the time scale (major/minor ticks, fiscal calendar), table columns/options, and appearance (colours, row height, render depth, …). Every change rewrites the JSON source, so it persists through the same undo/redo and save flow as any other edit. - Objects panel — tasks, milestones, and arrows; selecting one highlights it on the canvas.
- Properties box — edit
name,id,start,end,duration,not_before, colour, milestone flags, and description. Date fields have a calendar popup that writes dates in the chart's owndateformat. A Relationships section lists what the entry depends on (upstream:not_before, parent, incoming arrows) and what depends on it (downstream: subtasks, chained tasks, outgoing arrows). Every related entry is clickable. - New adds a task or milestone; Add subtask in task properties creates a child from either Gantt or table view. Set scheduling dependencies with Not before; existing arrows remain editable. Undo/redo, zoom, dark mode, and local PNG/SVG/CSV exports are available.
GUI edits format the source with two-space indentation and a trailing newline.
For standalone source formatting, use jsonantt fmt from the command line.
The hosted GUI supports editing, interactive previews, and PNG/SVG/CSV export through Pyodide. Choose File → Export… for PNG/SVG and PNG resolution, or File → Save CSV… in a table view. Open File → Compare… for comparisons: upload any baseline JSON, or use Git history… to select a dated commit (SHA and message included). On the local server, File → Open local file… selects a file by its full path so Git history follows that file, including renames. The baseline is read-only; the current editor is the actual/updated side. Toggle File → Compare mode off to return to ordinary output. While enabled, every existing output tab uses that baseline: Gantt/table use the CLI comparison renderers; burn views show exact baseline/current drawings side by side.
Refresh/revisit restores unsaved source (even temporarily invalid JSON), the current file, view/filter/zoom, comparison baseline, panels, and up to 20 undo/redo entries from browser storage. This does not save to disk. Storage is browser/origin specific; private mode, clearing site data, or storage limits can prevent recovery. Use Save JSON… for a durable copy. An explicit different demo or startup file opens that document instead of restoring the previous workspace.
Run your own local instance
Install Python 3.8 or newer, then create an environment and install jsonantt. On macOS/Linux:
python3 -m venv .venv
source .venv/bin/activate
python -m pip install --upgrade jsonantt
jsonantt serve
On Windows (PowerShell):
py -m venv .venv
.\.venv\Scripts\python.exe -m pip install --upgrade jsonantt
.\.venv\Scripts\jsonantt.exe serve
The server opens http://127.0.0.1:4174/ in your browser. Keep the terminal running; press Ctrl+C there to stop the server. You can also open http://127.0.0.1:4174/?demo=3 to try the cost demo locally.
jsonantt serve project.json                  # load a chart from disk
jsonantt serve --port 8080 --no-browser       # open http://127.0.0.1:8080/ yourself
For the latest development version, clone this repository, create/activate an environment as above, then install the checkout:
git clone https://github.com/briday1/jsonantt.git
cd jsonantt
python -m pip install -e .
jsonantt serve examples/simple.json
Use File → Save JSON… to download your edits; opening a local chart does not overwrite its file automatically. After updating Python code or upgrading the package, restart the server so exports use the new renderer, then refresh the browser.
To build and serve a static instance (no Python rendering server at runtime):
python -m jsonantt.static_site --output _site
python -m http.server 8080 --directory _site
For immediate first-visit demo previews, build with --prerender (requires Node.js).
The Pages workflow enables this automatically. The build bundles the current Python source; do not deploy only
jsonantt/web. The Pages workflow performs this build for every Python or GUI
change. The browser needs WebAssembly, module workers, and CDN access on first
load. If those are unavailable, use jsonantt serve; no alternate chart style
is substituted. Rendering data stays in the browser on static hosts.
See the local-server documentation for more options, including access from another device on your network.
jsonantt fmt
jsonantt fmt project.json            # reformat in place
jsonantt fmt project.json -o out.json
cat project.json | jsonantt fmt      # read stdin, write stdout
fmt runs the canonical jsonantt formatter (2-space indent, trailing newline, key order
preserved). The studio uses the same formatter, so both paths produce identical files.
JSON reference
| Field | Type | Description |
|---|---|---|
title |
string | Optional chart title shown at the top |
dateformat |
string | strptime format string (default: "%Y-%m-%d") |
start |
date string | Optional chart x-axis start date (overrides task dates) |
end |
date string | Optional chart x-axis end date |
style |
object | Visual style overrides (see below) |
tasks |
array | Top-level list of task objects |
children |
array | Legacy alias for top-level tasks |
Task object
| Field | Type | Description |
|---|---|---|
name |
string | Required. Task label |
description |
string | Optional long-form text used by table output |
| any other key | any JSON value | Preserved on the task and available to style.table_columns for table output |
id |
string | Unique identifier used for not_before references |
start |
date string | Bar start date |
end |
date string | Bar end date |
duration |
string or int | Duration from start (or resolved not_before end): "14d", "2w", "3m", "2y", or a plain integer (days) |
not_before |
string | id of another task — this task starts immediately after that task ends |
color |
CSS hex string | Bar colour, or milestone colour override for an individual milestone (e.g. "#4472C4") |
edge_color |
CSS hex string | Optional milestone outline colour override for an individual milestone |
milestone |
boolean | Render as a diamond milestone instead of a bar |
major_milestone |
boolean | Mark this milestone as a major milestone; it still behaves like a milestone but can use separate default styling and rollup rules |
date |
date string or array of date strings | Milestone date, or a list of milestone dates to draw multiple markers on the same row when milestone: true |
marker |
string | Milestone marker override for an individual milestone (matplotlib marker symbol such as "D", "o", "s", "*") |
marker_size |
number | Override milestone diamond size in points |
bold |
boolean | Render label in bold (top-level tasks are auto-bolded by default) |
filename |
string | Path to another JSON file whose task tree should be imported at this location |
tasks |
array | Nested sub-tasks (preferred key, infinitely nestable) |
children |
array | Legacy alias for nested sub-tasks |
Auto date computation: When a task has
childrenbut no explicitstart/end, the dates are computed automatically as the earliest child start and latest child end, recursively.
Milestone chains: When
milestone: true,datemay be either one date string or a list of date strings. A list draws multiple milestone markers on the same task row while keeping the same label, description, color, and marker settings.
Milestone numbering: When
style.number_milestonesistrue, milestones are numberedM1,M2, ... in tree order. The marker keeps its configured shape and theMlabel is drawn inside it. Tables use the sameMlabels in theTaskcolumn instead of hierarchy numbers for milestone rows.
Milestone rollup: When
style.rollup_milestonesistrueand deeper rows are hidden byrender_depth, descendant milestones are not listed as separate rows. Instead their milestone markers are drawn on top of the visible ancestor bar they roll up into. This happens recursively, so deeply nested hidden milestones keep rolling up until they land on a visible row.
Major milestone styling:
major_milestone: trueimpliesmilestone: true. Major milestones can have a separate default fill, edge colour, marker, and size through thestyle.major_milestone_*fields. Task-levelcolor,edge_color,marker, andmarker_sizestill override both milestone and major milestone defaults.
Major-only rollup: When both
style.rollup_milestonesandstyle.rollup_major_milestones_onlyaretrue, hidden regular milestones stay hidden while hidden major milestones roll up onto the visible ancestor bar.
{
  "title": "Release Gates",
  "tasks": [
    {
      "name": "Release Track",
      "tasks": [
        {
          "name": "Gate Reviews",
          "description": "Same milestone row, repeated checkpoints.",
          "milestone": true,
          "date": ["2024-06-01", "2024-06-15", "2024-07-01"],
          "marker": "D",
          "color": "#C0504D"
        },
        {
          "name": "Executive Approval",
          "major_milestone": true,
          "date": "2024-07-08"
        }
      ]
    }
  ]
}
tasks and children are interchangeable at both the chart root and inside nested task objects. If both are present on the same object, jsonantt reads both lists in order.
filename lets you build a larger plan from smaller task files. A task entry that is only { "filename": "phase.json" } inlines the referenced file's tasks at that position. When filename appears alongside normal task fields like name or description, the referenced file's tasks are imported as that task's children. The included file's style, title, chart start/end, and arrows are ignored during inclusion; only its task tree is used.
In the GUI, use File → Append JSON…. Select multiple files (or load a folder for nested includes), check the files to append, reorder them, and choose Append tasks inline or One parent task per file. Click Append selected files to confirm. Files referenced by another selected file are kept available for include resolution but are initially unchecked to avoid importing their tasks twice.
GUI composition uses the CLI's task inclusion rules and converts imported dates
to the destination chart's date format. It creates editable snapshots, not
live filename links: Save JSON produces one portable document, original files
are untouched, and Undo removes an entire append operation. Duplicate task IDs,
missing include files, or circular includes leave the current document unchanged.
Use filename references in CLI-managed sources when you want live file links.
{
  "title": "Combined Plan",
  "tasks": [
    { "filename": "composed-discovery.json" },
    {
      "name": "Delivery Program",
      "filename": "composed-delivery.json"
    }
  ]
}
Duration formats:
d/day/days,w/week/weeks,m/month/months,y/year/years— e.g."14d","2w","3m","1y".
Style object
| Field | Default | Description |
|---|---|---|
width |
14 |
Figure width in inches |
row_height |
0.3 |
Height of each task row in inches |
bar_height |
0.5 |
Bar height as a fraction of row_height |
font_size |
12 |
Base font size in points |
indent_size |
3 |
Spaces added per depth level in labels |
label_fraction |
0.0 |
Fraction of figure width used for labels; 0 means auto-size from measured text width |
subtask_lightening_pct |
0.0 |
Percentage to lighten inherited subtask colours at each nested level; 20 means each inherited step moves 20% toward white |
colors |
palette | Array of default hex colours cycled per top-level task |
background |
"#FFFFFF" |
Figure background colour |
grid_color |
"#E0E0E0" |
Vertical gridline colour |
row_band_color |
"#F5F5F5" |
Alternating row band colour |
milestone_color |
"#FFD700" |
Default milestone colour |
milestone_edge_color |
null |
Optional default milestone outline colour |
milestone_marker |
"D" |
Default milestone marker symbol |
milestone_size |
14 |
Default milestone marker size in points |
rollup_milestones |
false |
When rows are hidden by render_depth, draw descendant milestone markers on the visible ancestor bar instead of dropping them |
rollup_major_milestones_only |
false |
When milestone rollup is enabled, restrict rolled-up overlays to hidden major milestones |
number_milestones |
false |
Number milestones as M1, M2, ... inside their markers and in table Task cells |
major_milestone_color |
null |
Optional default fill colour for major milestones |
major_milestone_edge_color |
null |
Optional default outline colour for major milestones |
major_milestone_marker |
null |
Optional default marker symbol for major milestones |
major_milestone_size |
null |
Optional default marker size in points for major milestones |
major_tick |
null |
Major tick unit: "year", "quarter", "month", "week" |
minor_tick |
null |
Minor tick unit: "quarter", "month", "week", "day" |
fiscal_year_start |
null |
Fiscal year start as "MM" or "MM-DD" (e.g. "10-01" for 1 October). Year/quarter ticks snap to the fiscal calendar and are labelled FY26, Q1 FY26, … (fiscal years are named after the calendar year they end in) |
major_grid_width |
2.0 |
Major gridline linewidth |
minor_grid_width |
1.5 |
Minor gridline linewidth |
tick_position |
"top" |
X-axis label position: "top", "bottom", or "both" |
bold_tasks |
true |
Auto-bold top-level (depth 0) task labels |
number_tasks |
true |
Prefix task labels with hierarchy numbers like 1, 1.1, 1.2 |
table_colorize |
true |
Show a task-coloured accent bar in table output; when false, both accent bars and milestone markers are suppressed |
table_show_markers |
true |
Replace the accent bar with a milestone diamond for milestone rows in table output when table colours are enabled |
table_columns |
[] |
Ordered table column definitions. Empty means the default Task, Name, Description columns. Entries can be field-name strings or objects like { "field": "cost", "title": "Cost (k$)", "rollup": "sum", "total": true, "total_level": 0, "display_factor": 0.001 } |
Examples
See the examples/ folder for ready-to-run JSON files.
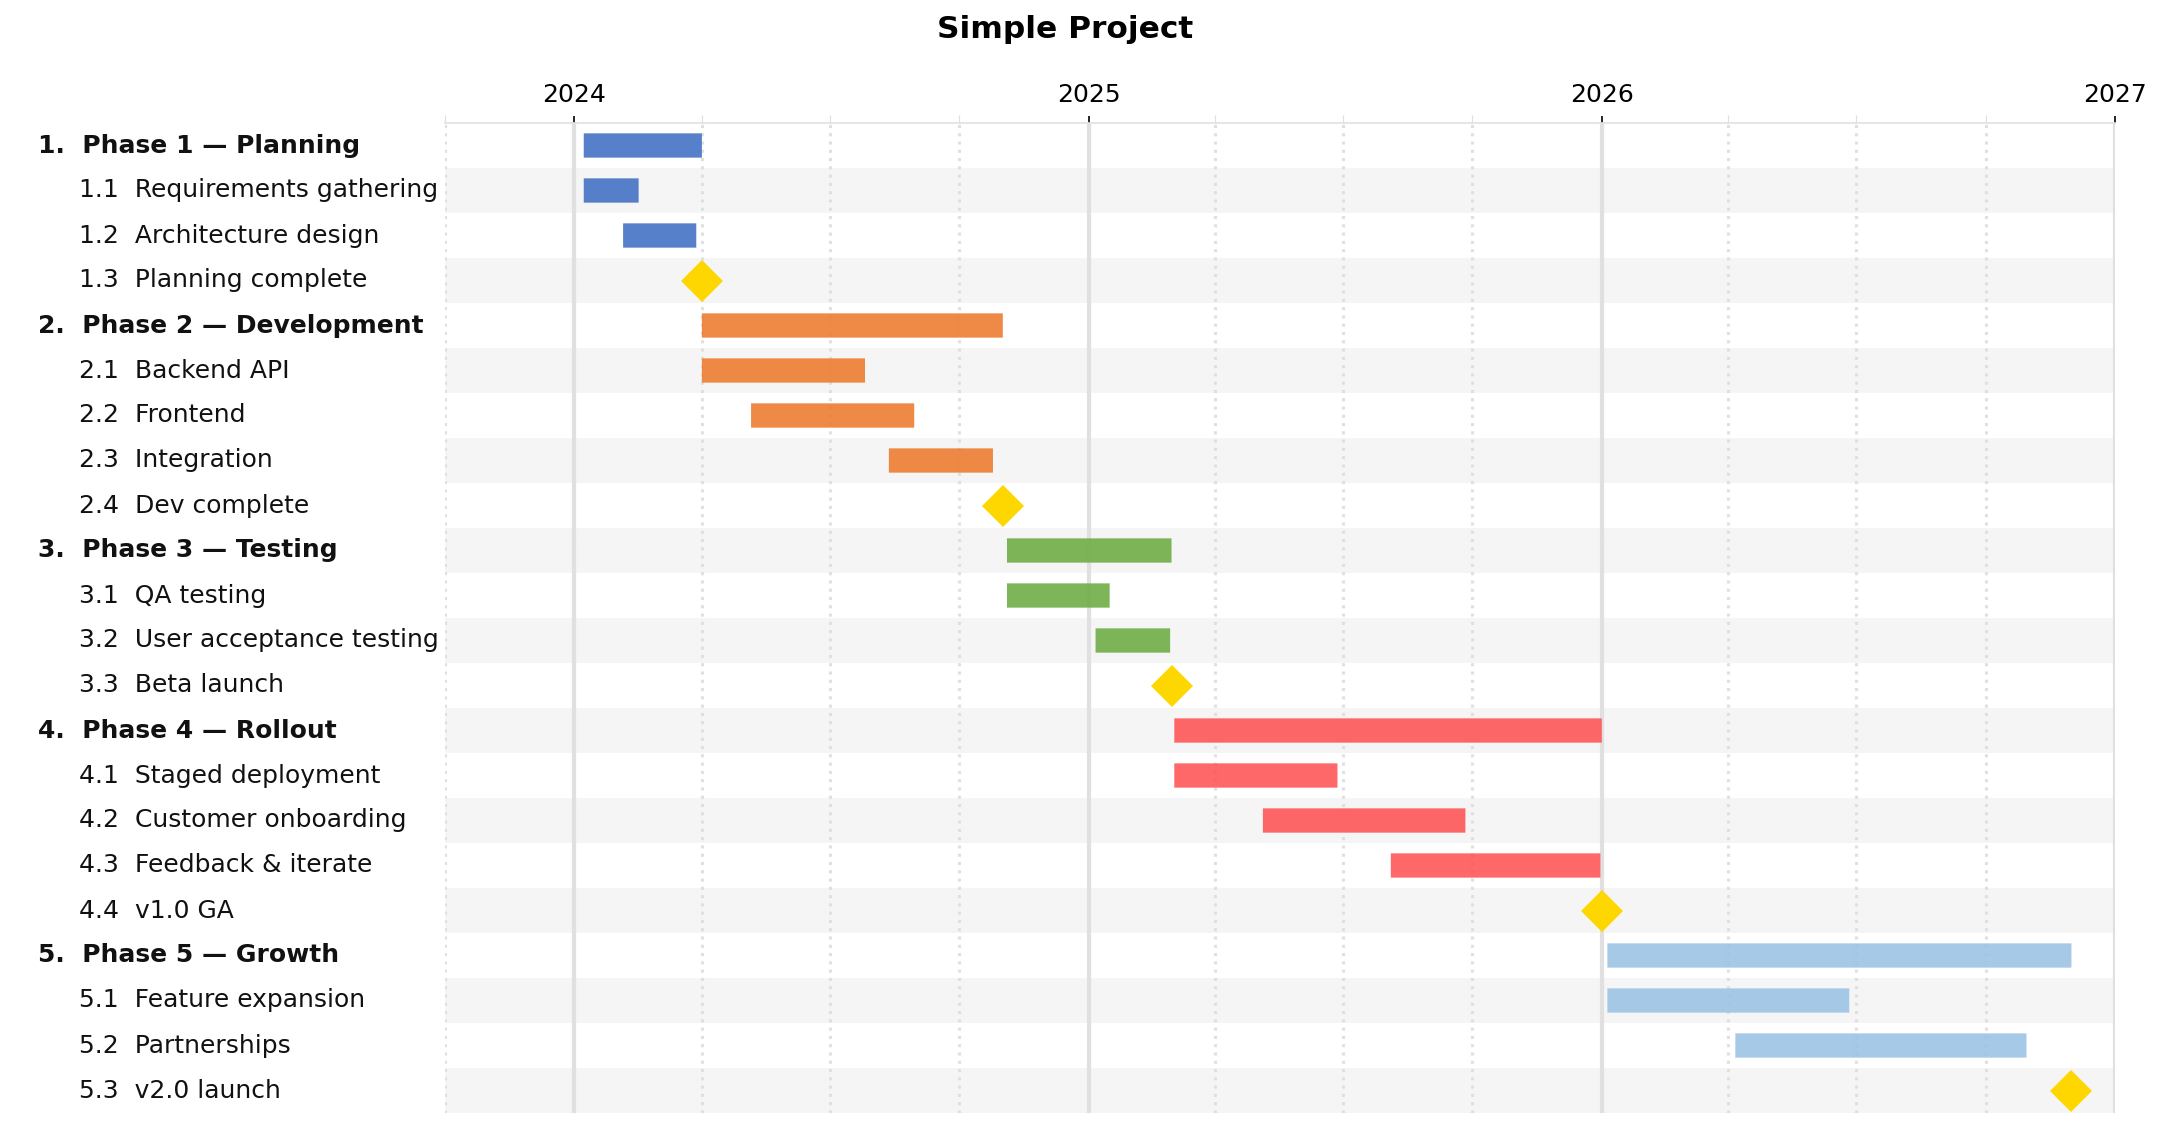
Simple project
examples/simple.json — a five-phase project with milestones
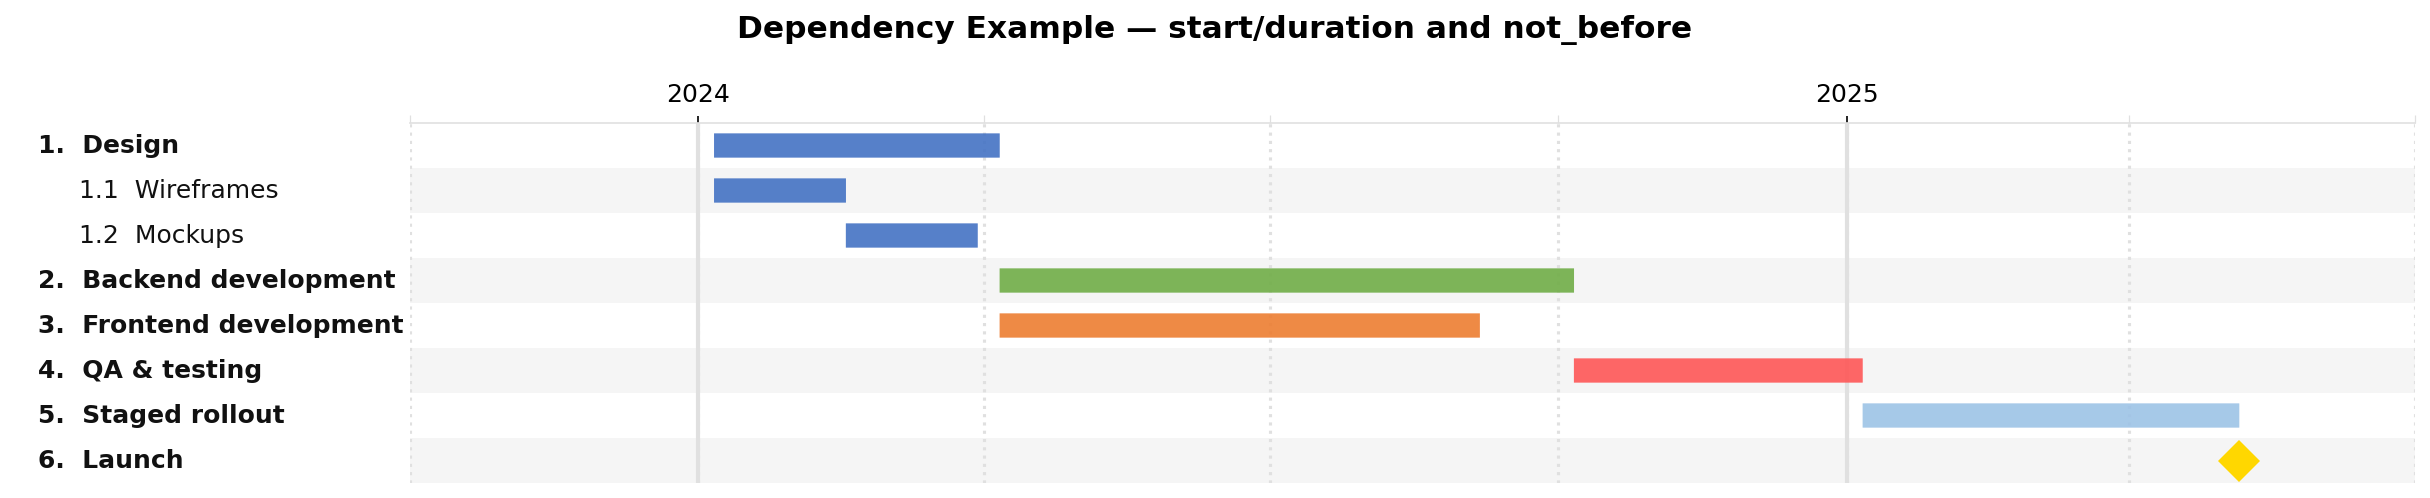
Dependencies
examples/dependencies.json — id, duration, and not_before
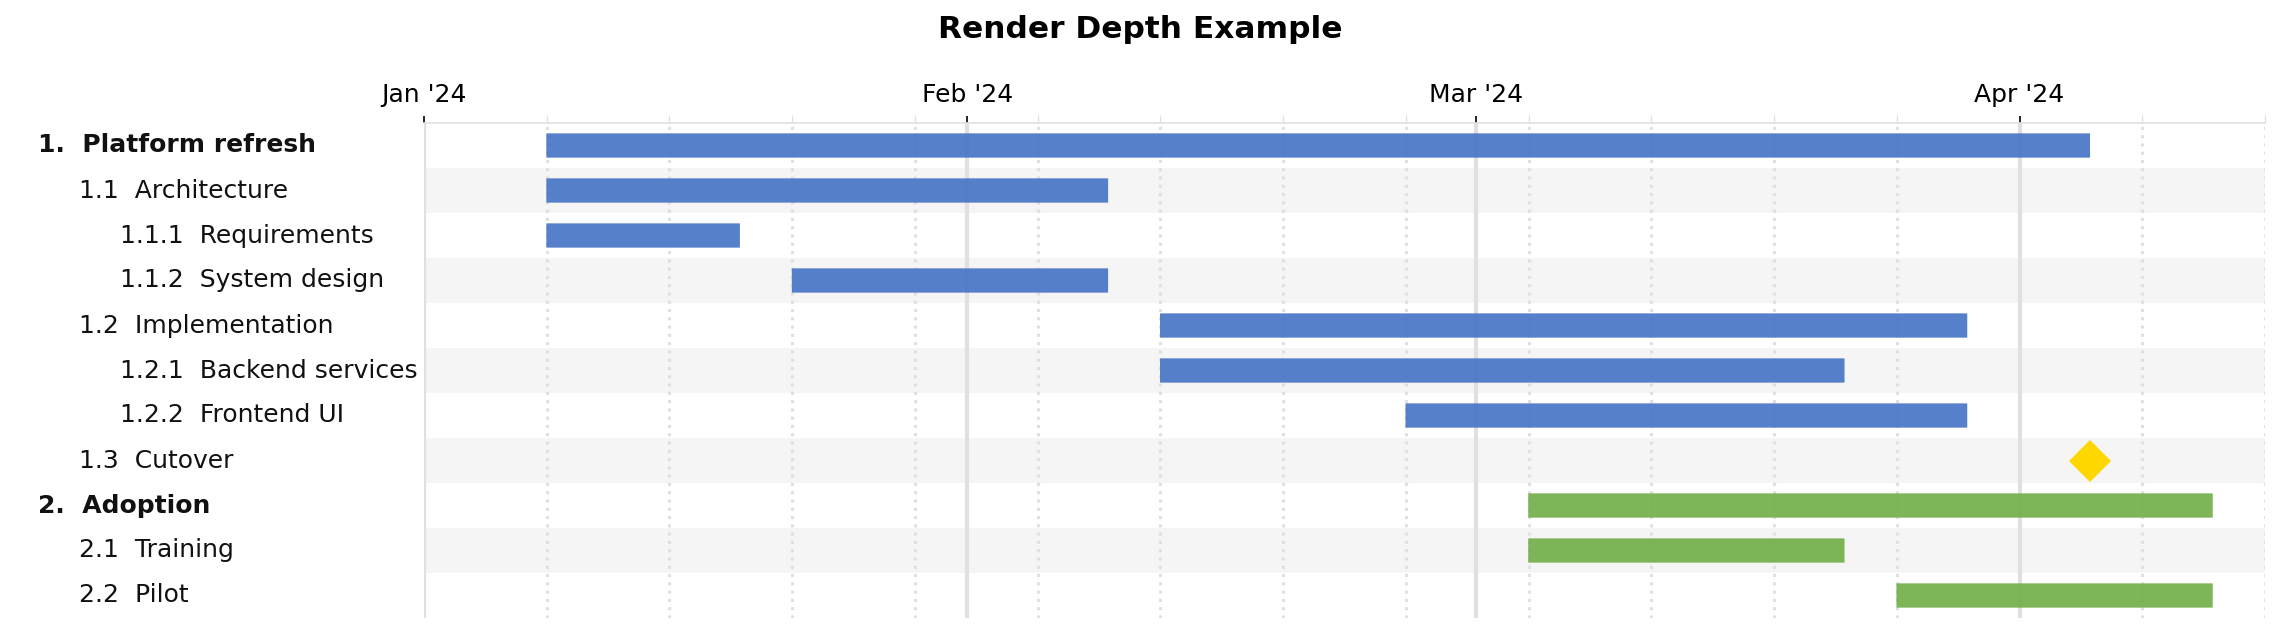
Render depth
examples/renderdepth.json — nested tasks that are useful with -r / --renderdepth
Full depth, render_depth=0:
One child level, -r 2:

Top level only, -r 1:
Chained milestones
examples/chained-milestones.json — nested tasks with multiple milestone dates on one row
Composed plans
examples/composed-plan.json — combines multiple task files with filename, including nested chained milestones
Major milestone rollup
examples/major-milestones.json — distinguishes regular vs major milestones, numbers them, and rolls up only hidden major milestones

Table output, -t:
Milestones only, -t --milestones-only:

No milestones, -t --no-milestones:
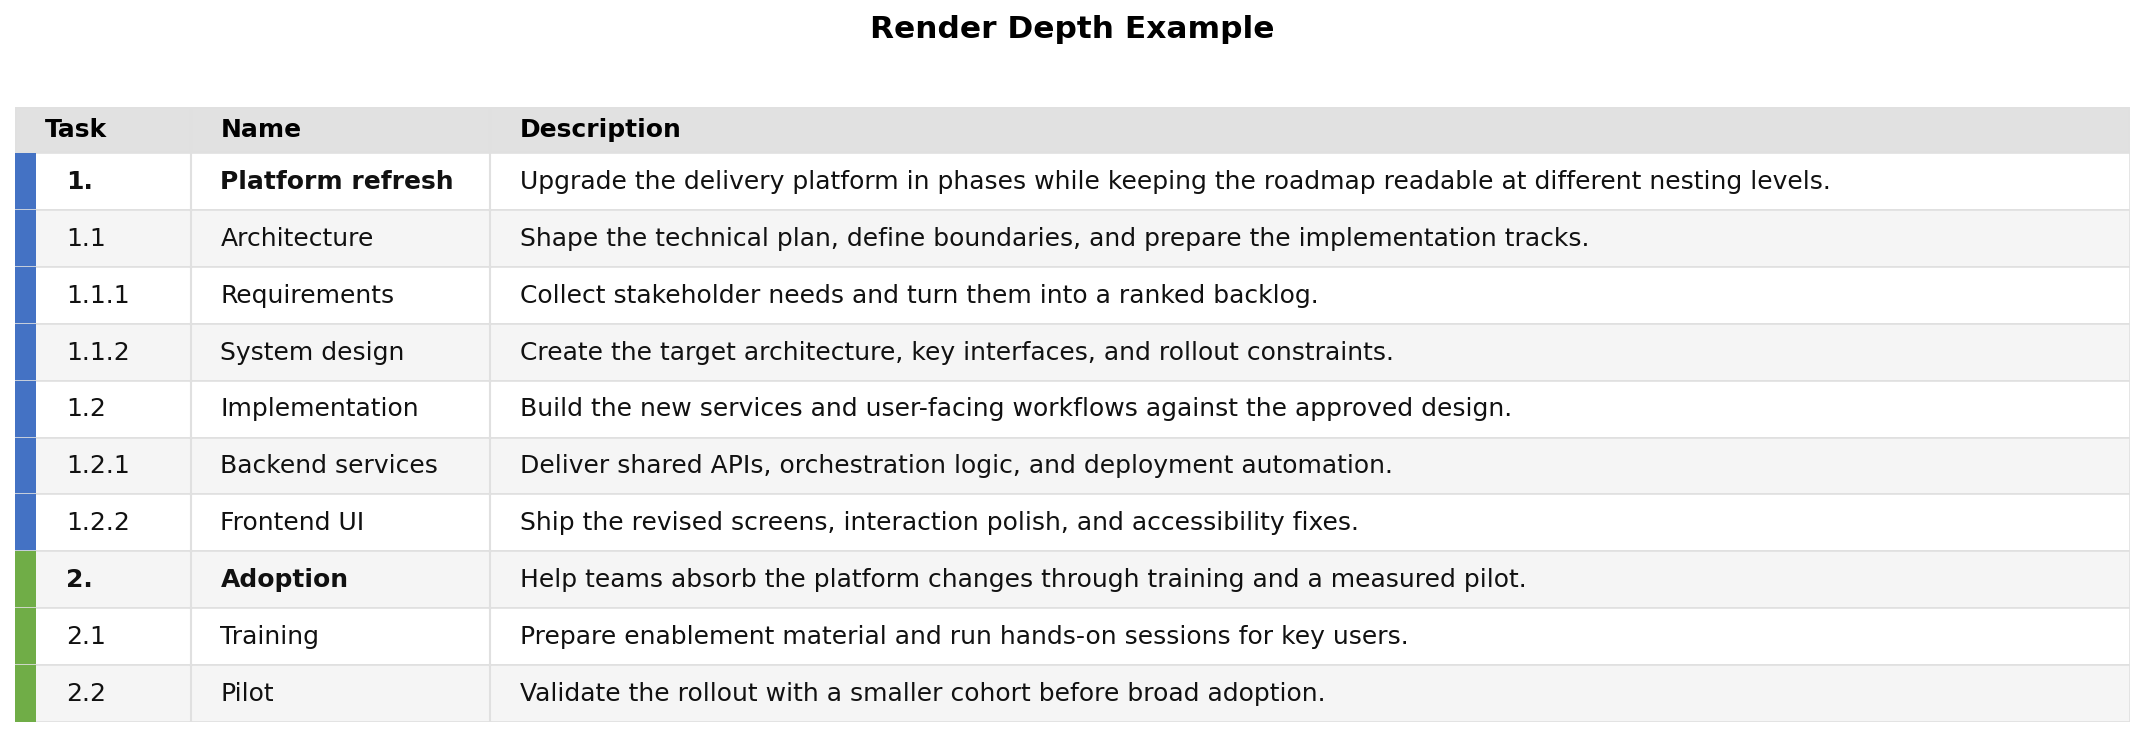
Try the same file with different depth limits:
jsonantt examples/renderdepth.json examples/renderdepth-all.png      # full depth
jsonantt -r 1 examples/renderdepth.json examples/renderdepth-top.png # top-level only
jsonantt -r 2 examples/renderdepth.json examples/renderdepth-mid.png # one child level
jsonantt -t examples/renderdepth.json examples/renderdepth-table.png # task table view
jsonantt -t --milestones-only examples/renderdepth.json examples/renderdepth-milestones.png # milestones only
jsonantt -t --no-milestones examples/renderdepth.json examples/renderdepth-no-milestones.png # exclude milestones
jsonantt -t examples/renderdepth.json examples/renderdepth-table.csv # CSV table export
Funding burn
examples/funding.json — direct task costs allocated uniformly over time, then grouped into top-level burn output
Monthly burn chart, --burn --burn-period month --burn-group 0:
Quarter burn table, --burn-table --burn-period quarter --burn-group 0:
Color schemes
examples/colors.json — custom palette, background, grid, row band, milestone colours, and custom milestone markers

Compare mode
examples/compare-planned.json and examples/compare-actual.json — planned vs actual comparison with a CLI date line
Compare chart:
Compare table image:
CSV export:
Description wrapping
examples/description-wrap.json — demonstrates normal word wrapping in table output and the edge case where a single unbroken token will not wrap
Table output, -t:
CSV export:
examples/description-wrap-table.csv
Custom table fields
examples/costs.json — shows style.table_columns with custom Owner and Cost columns sourced from task fields like assignee and cost
CSV export:
Overlapping cost plan
examples/costs-overlap.json — a more realistic cost plan with overlapping workstreams, nested tasks, milestones, and rolled-up Cost (k$) values
Chart output:
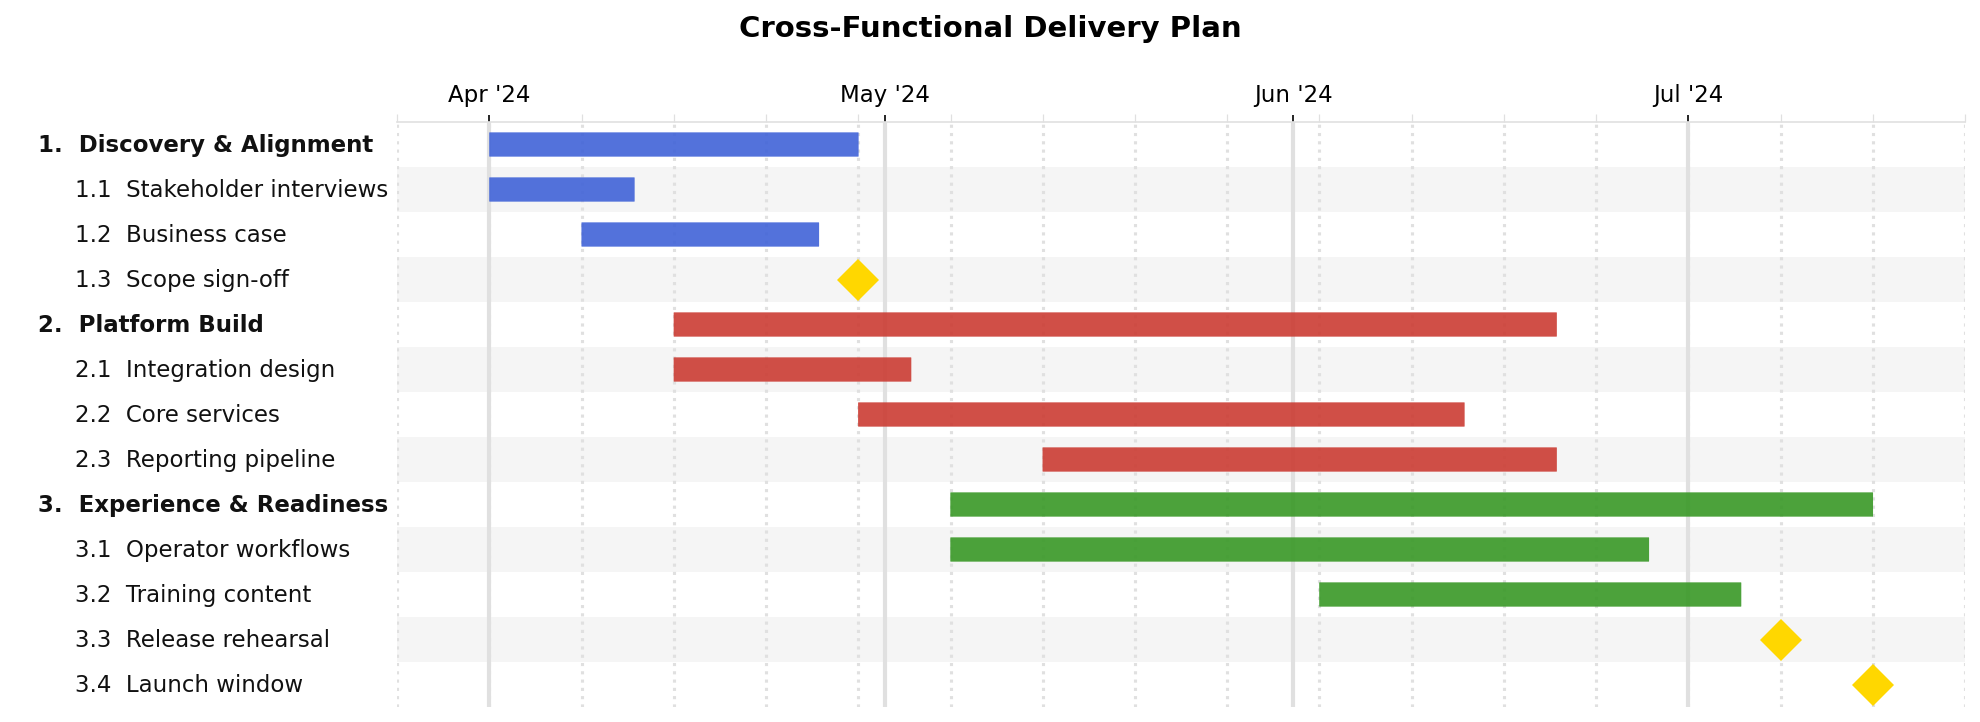
Table output, -t:
CSV export:
examples/costs-overlap-table.csv
Monthly burn chart, --burn --burn-period month --burn-group 0 --burn-display-factor 0.001:
Monthly burn matrix, --burn-table --burn-period month --burn-group 0 --burn-display-factor 0.001:
Burn CSV export:
examples/costs-overlap-burn-table.csv
Complex roadmap
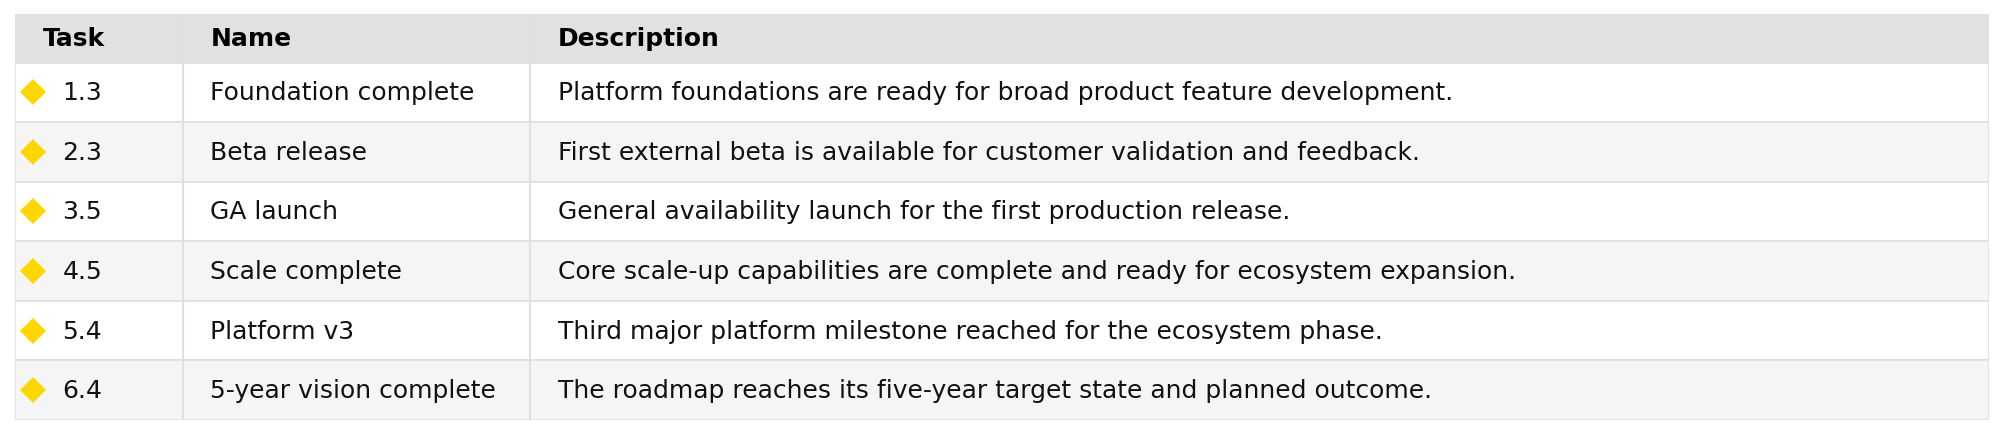
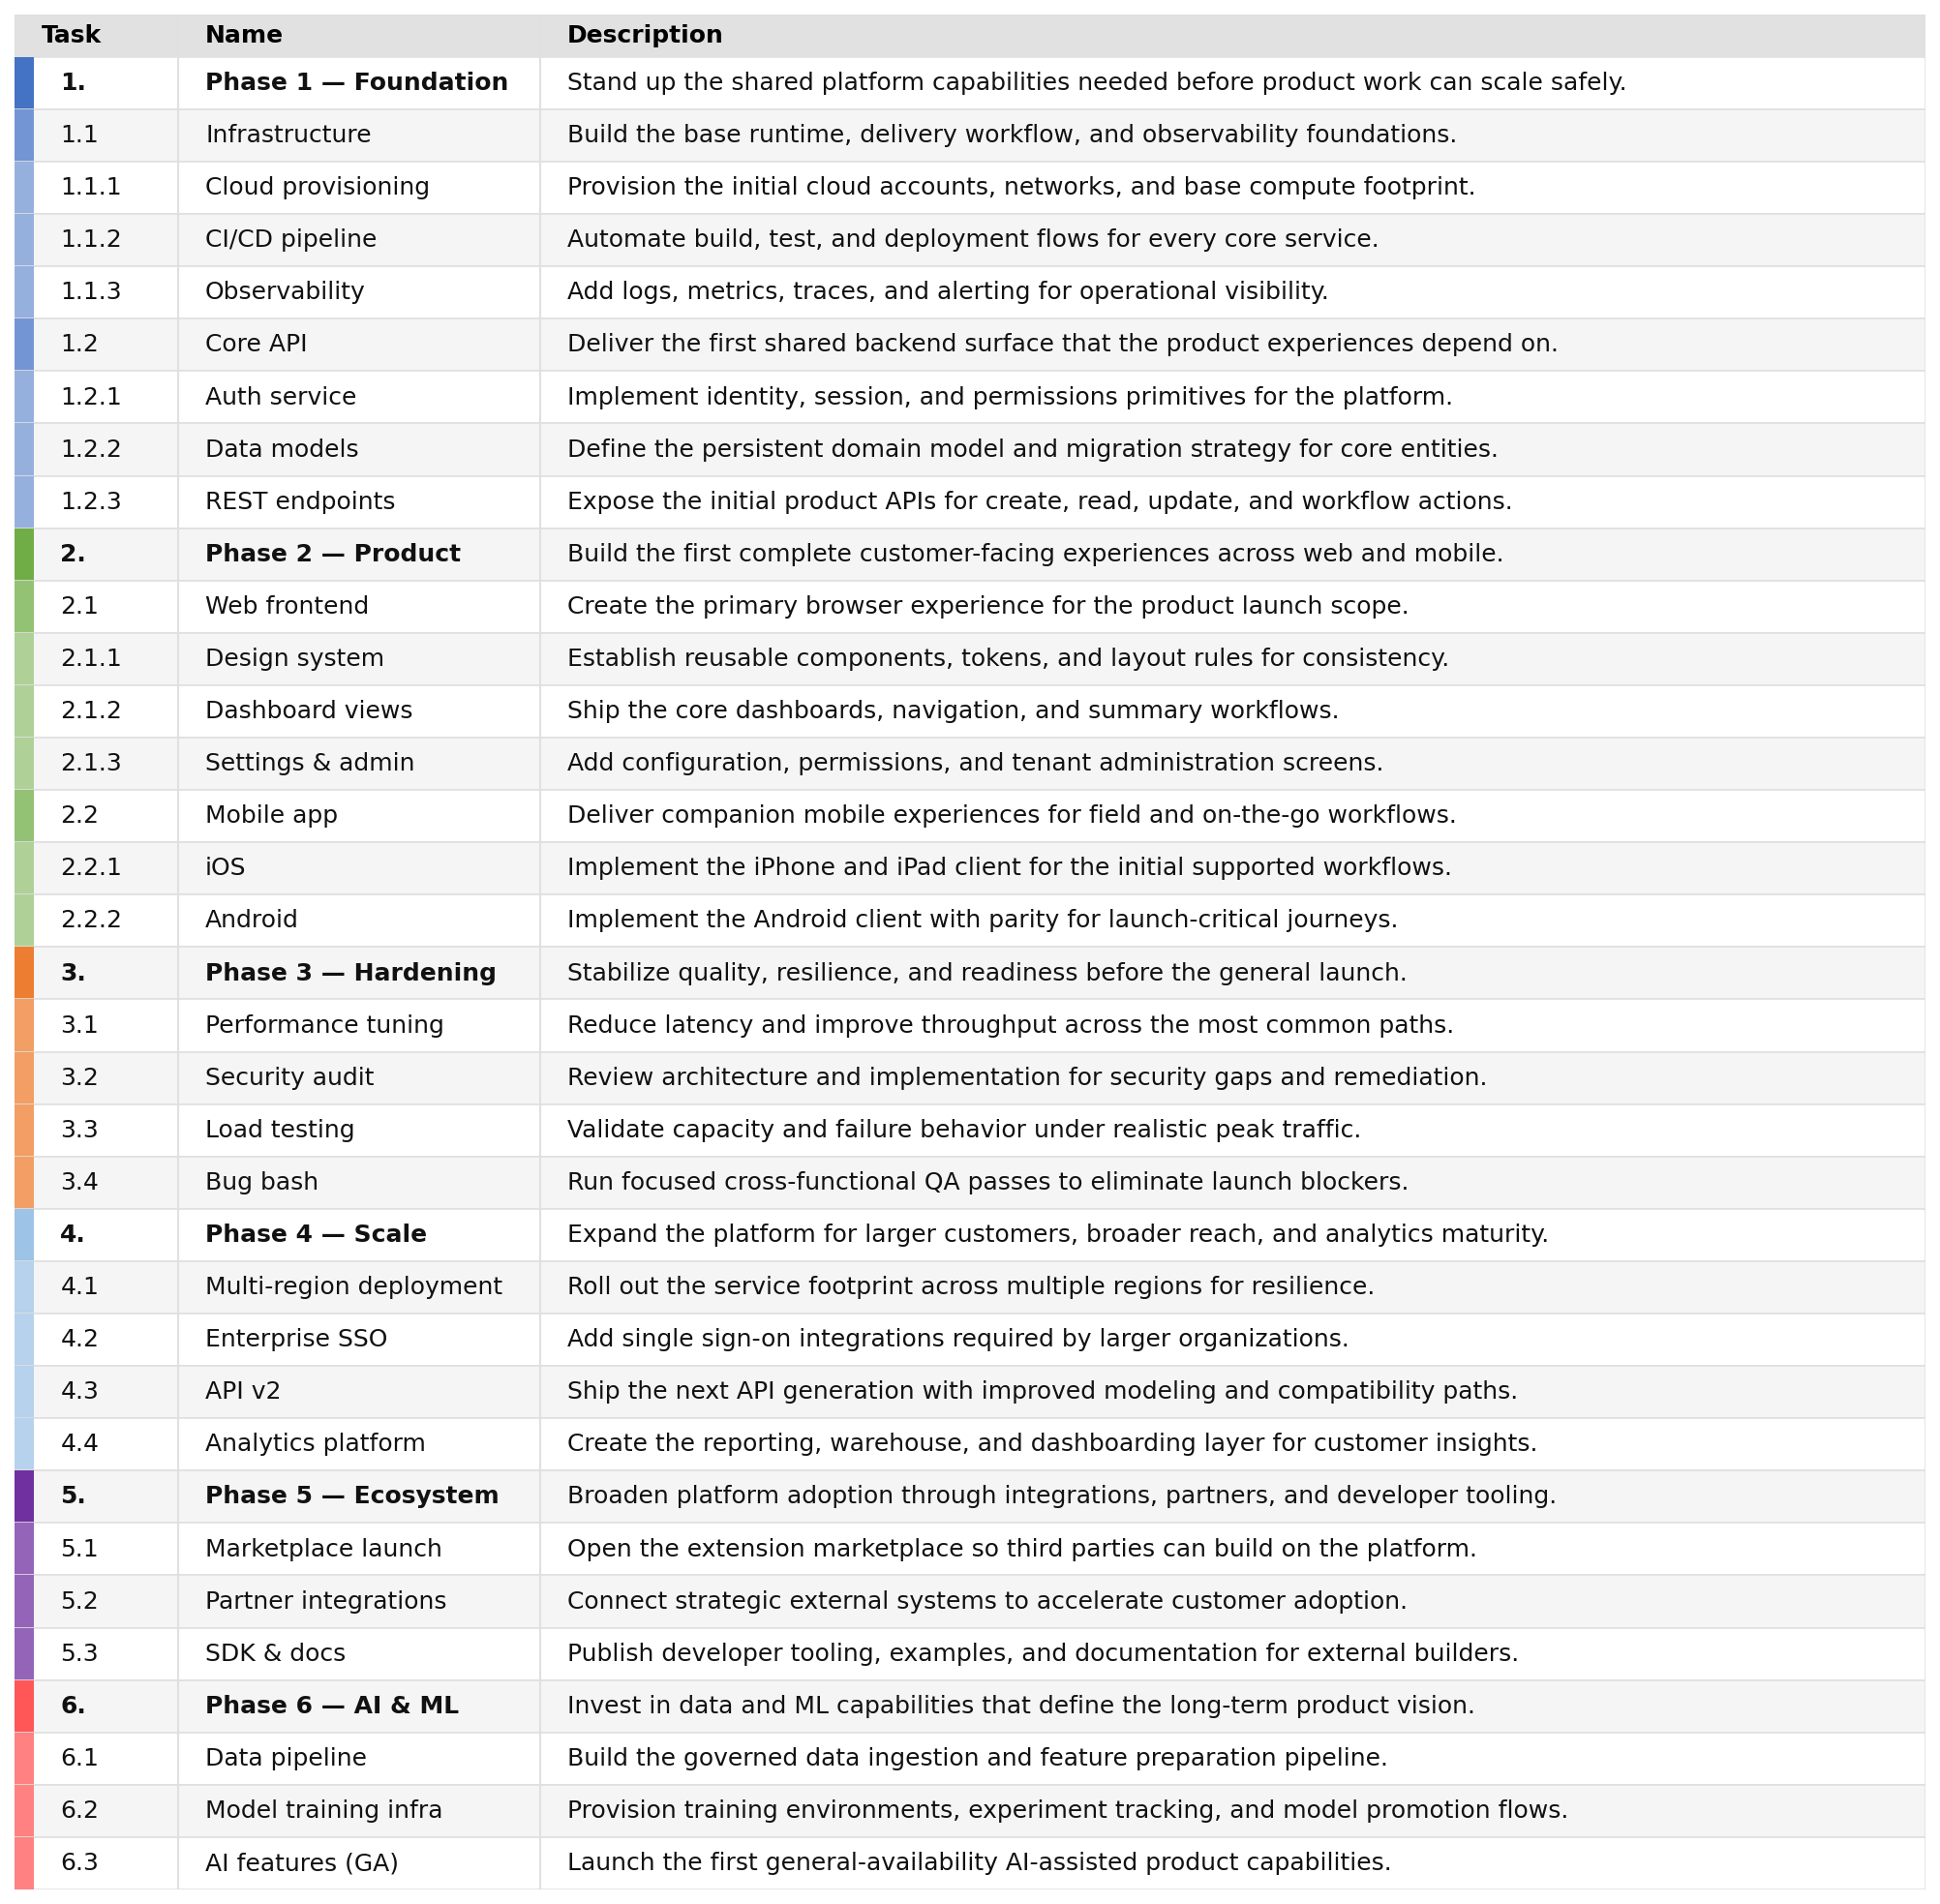
examples/complex.json — a multi-year roadmap with deep nesting, task descriptions, and custom colours
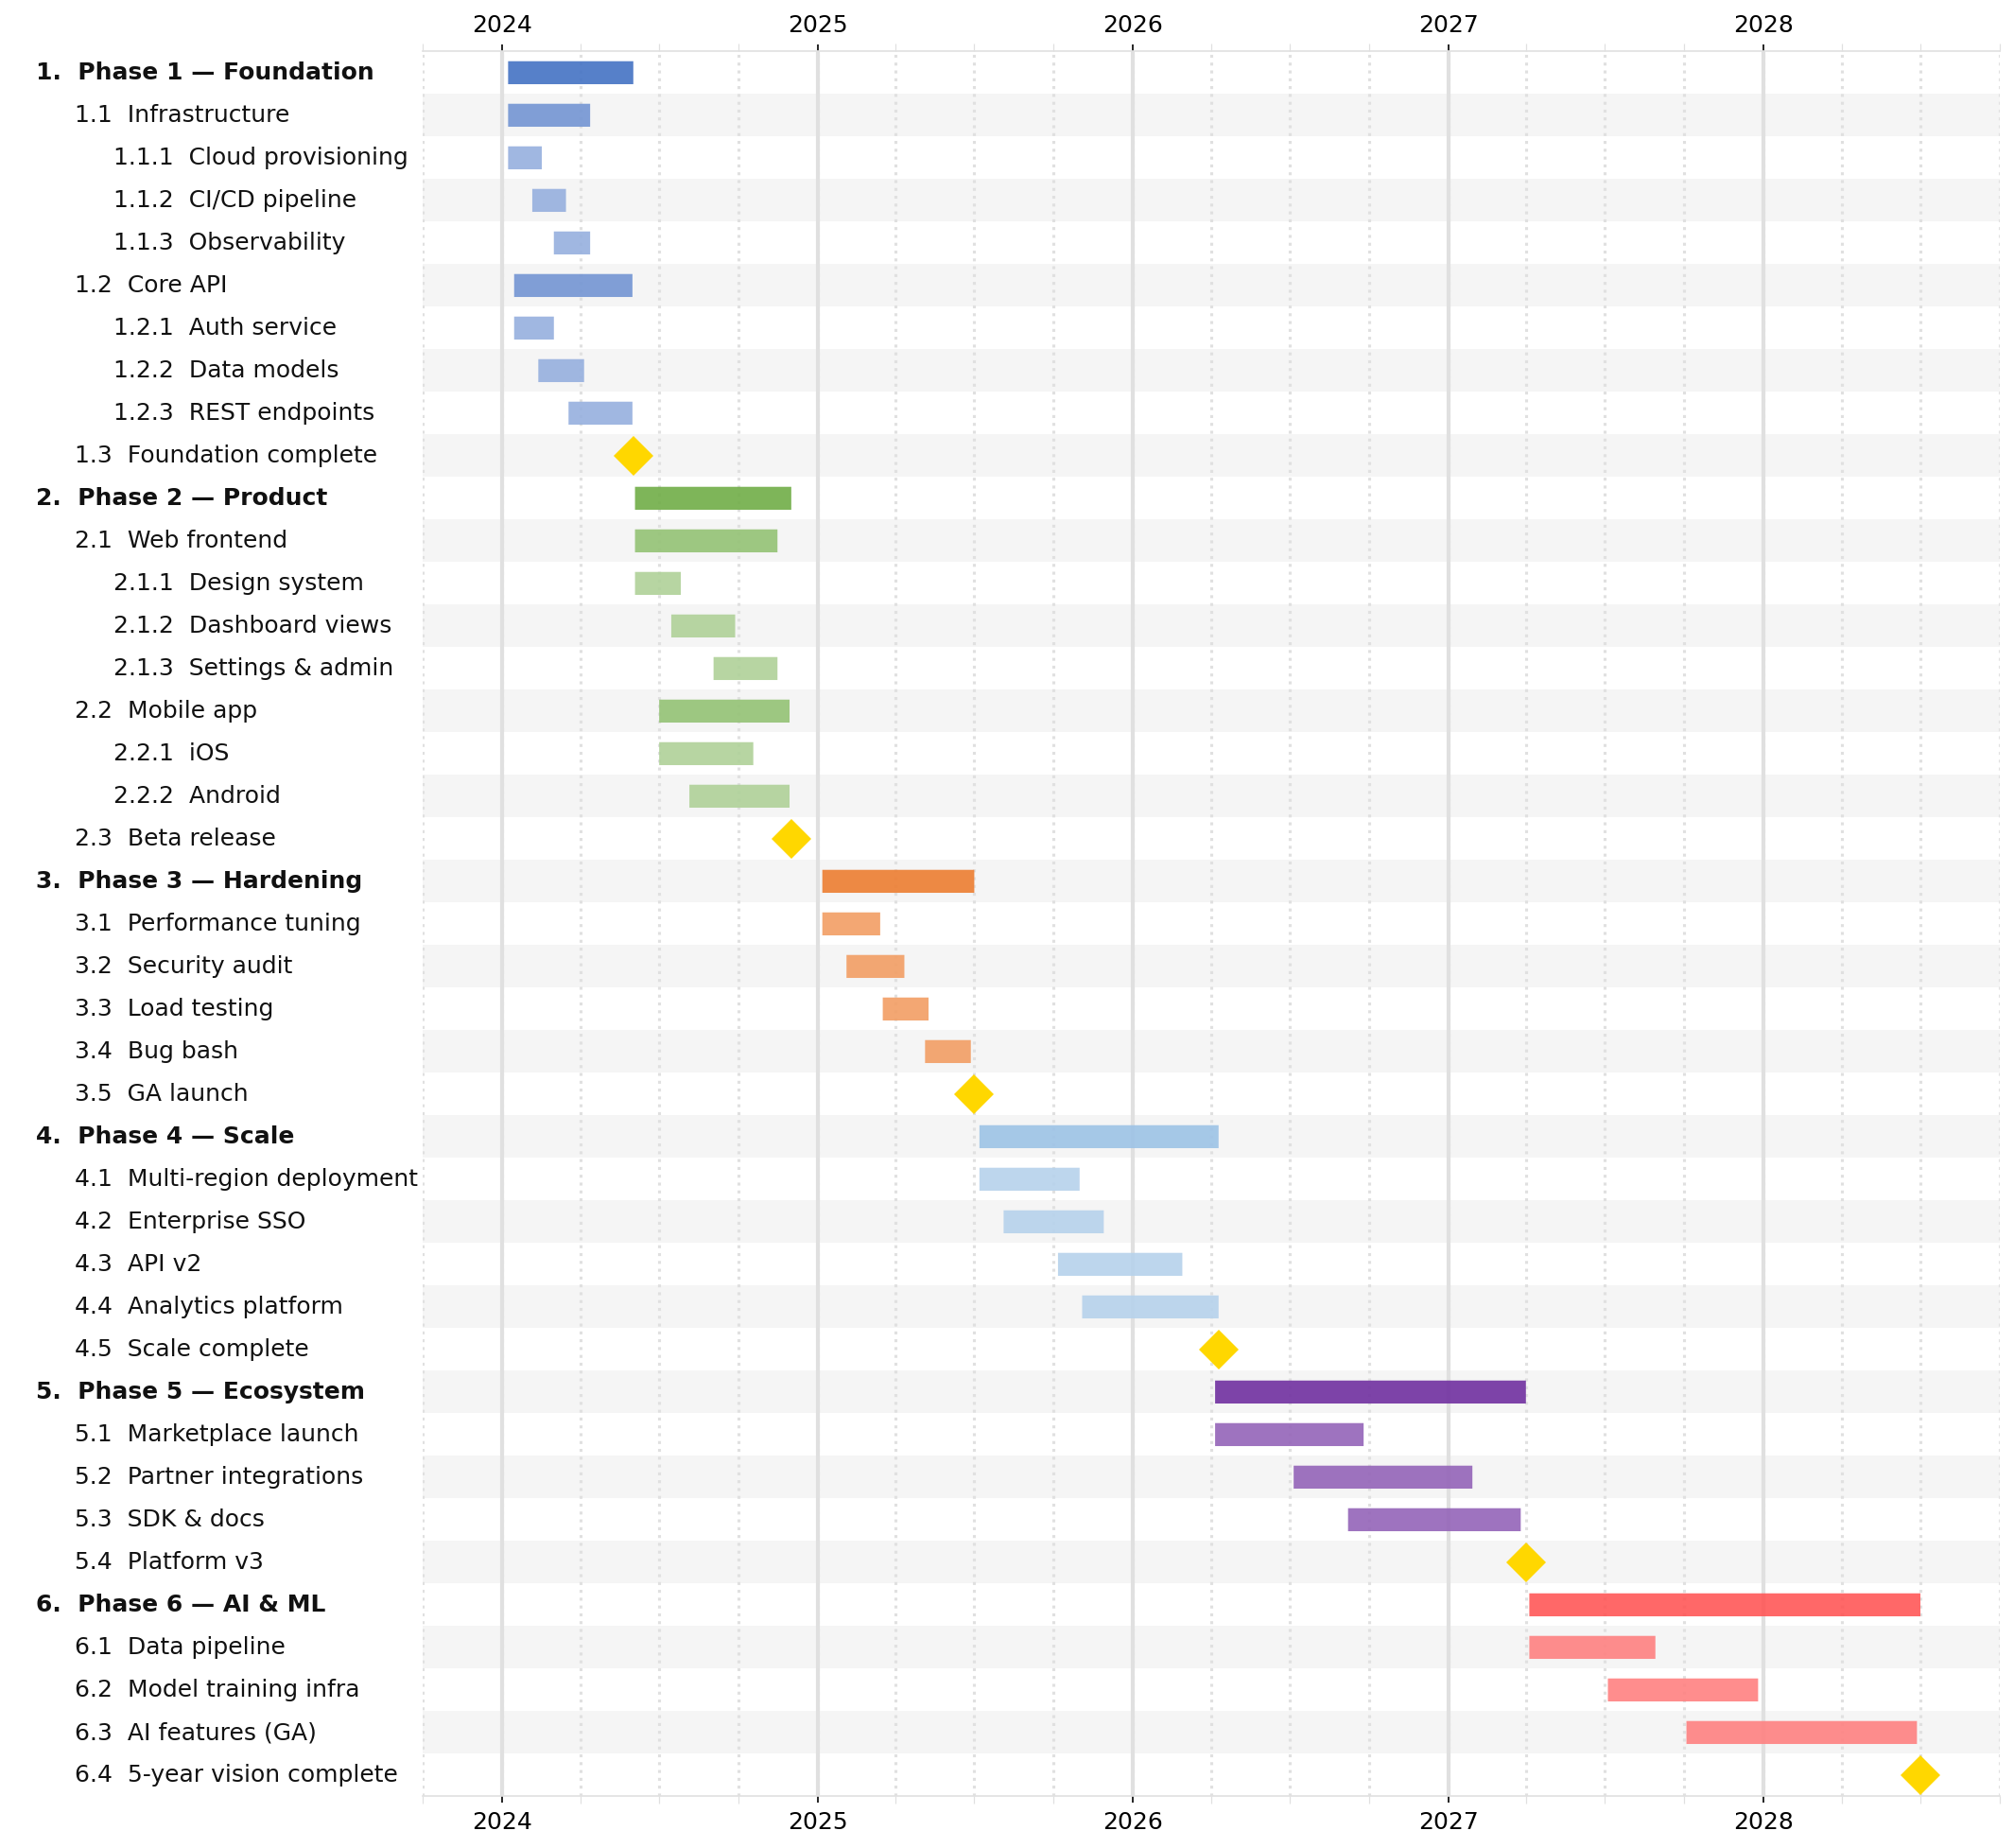
Table output, -t:
Milestones only, -t --milestones-only:
No milestones, -t --no-milestones:
How to Run
jsonantt examples/simple.json examples/simple.png                    # basic milestones
jsonantt examples/dependencies.json examples/dependencies.png        # not_before scheduling
jsonantt examples/renderdepth.json examples/renderdepth.png          # full nested view
jsonantt -r 1 examples/renderdepth.json examples/renderdepth-top.png # top-level only
jsonantt -r 2 examples/renderdepth.json examples/renderdepth-mid.png # one child level
jsonantt -t examples/renderdepth.json examples/renderdepth-table.png # task table with descriptions
jsonantt -t --milestones-only examples/renderdepth.json examples/renderdepth-milestones.png # milestone table
jsonantt -t --no-milestones examples/renderdepth.json examples/renderdepth-no-milestones.png # table without milestones
jsonantt -t examples/renderdepth.json examples/renderdepth-table.csv # CSV export
jsonantt examples/colors.json examples/colors.png                    # custom palette and background
jsonantt examples/compare-planned.json examples/compare.png --compare examples/compare-actual.json --date-line 2024-03-01 --date-line-color "#C00000" # compare chart with target line
jsonantt -t examples/compare-planned.json examples/compare-table.png --compare examples/compare-actual.json # compare table image
jsonantt -t examples/compare-planned.json examples/compare-table.csv --compare examples/compare-actual.json # compare table CSV
jsonantt -t examples/description-wrap.json examples/description-wrap-table.png # wrapped descriptions table image
jsonantt -t examples/description-wrap.json examples/description-wrap-table.csv # wrapped descriptions CSV
jsonantt -t examples/costs.json examples/costs-table.csv                # custom cost/owner columns CSV
jsonantt examples/complex.json examples/complex.png                  # deep roadmap example
jsonantt -t examples/complex.json examples/complex-table.png         # full complex table
jsonantt -t --milestones-only examples/complex.json examples/complex-milestones.png # complex milestones only
jsonantt -t --no-milestones examples/complex.json examples/complex-no-milestones.png # complex without milestones
1 maintainer

Download files
Download the file for your platform. If you're not sure which to choose, learn more about installing packages.
Source Distribution
Built Distribution
Filter files by name, interpreter, ABI, and platform.
If you're not sure about the file name format, learn more about wheel file names.
Copy a direct link to the current filters
File details
Details for the file jsonantt-2026.35.tar.gz.
File metadata
- Download URL: jsonantt-2026.35.tar.gz
- Upload date:
- Size: 171.5 kB
- Tags: Source
- Uploaded using Trusted Publishing? No
- Uploaded via:
twine/7.0.0 CPython/3.13.14
File hashes
| Algorithm | Hash digest | |
|---|---|---|
| SHA256 |
f7574e0d5017468caf94bf9181c9193333a1228c4d1a1c9c5447a243820c463a
|
|
| MD5 |
f74e1bf1ce87e565ff44738c23182c0b
|
|
| BLAKE2b-256 |
447a1551372fb6ace053d0f5c5b86047e04270942ccafd156c321e81db46fe18
|
File details
Details for the file jsonantt-2026.35-py3-none-any.whl.
File metadata
- Download URL: jsonantt-2026.35-py3-none-any.whl
- Upload date:
- Size: 133.8 kB
- Tags: Python 3
- Uploaded using Trusted Publishing? No
- Uploaded via:
twine/7.0.0 CPython/3.13.14
File hashes
| Algorithm | Hash digest | |
|---|---|---|
| SHA256 |
4b44717c2e40c6bc0b364e0570a568f2aa5f829fbff831389a9347659b189a43
|
|
| MD5 |
e31f98830d1950425ac724746de9e4c4
|
|
| BLAKE2b-256 |
20c5f11184f6c6f61bd26bd3f311f65b91e735c04c172b0cd091cb7a16fd897a
|














