
A visualization tool for job shop scheduling problems.

Project description



Job Shop Scheduling Problem Visualisations
About The Project
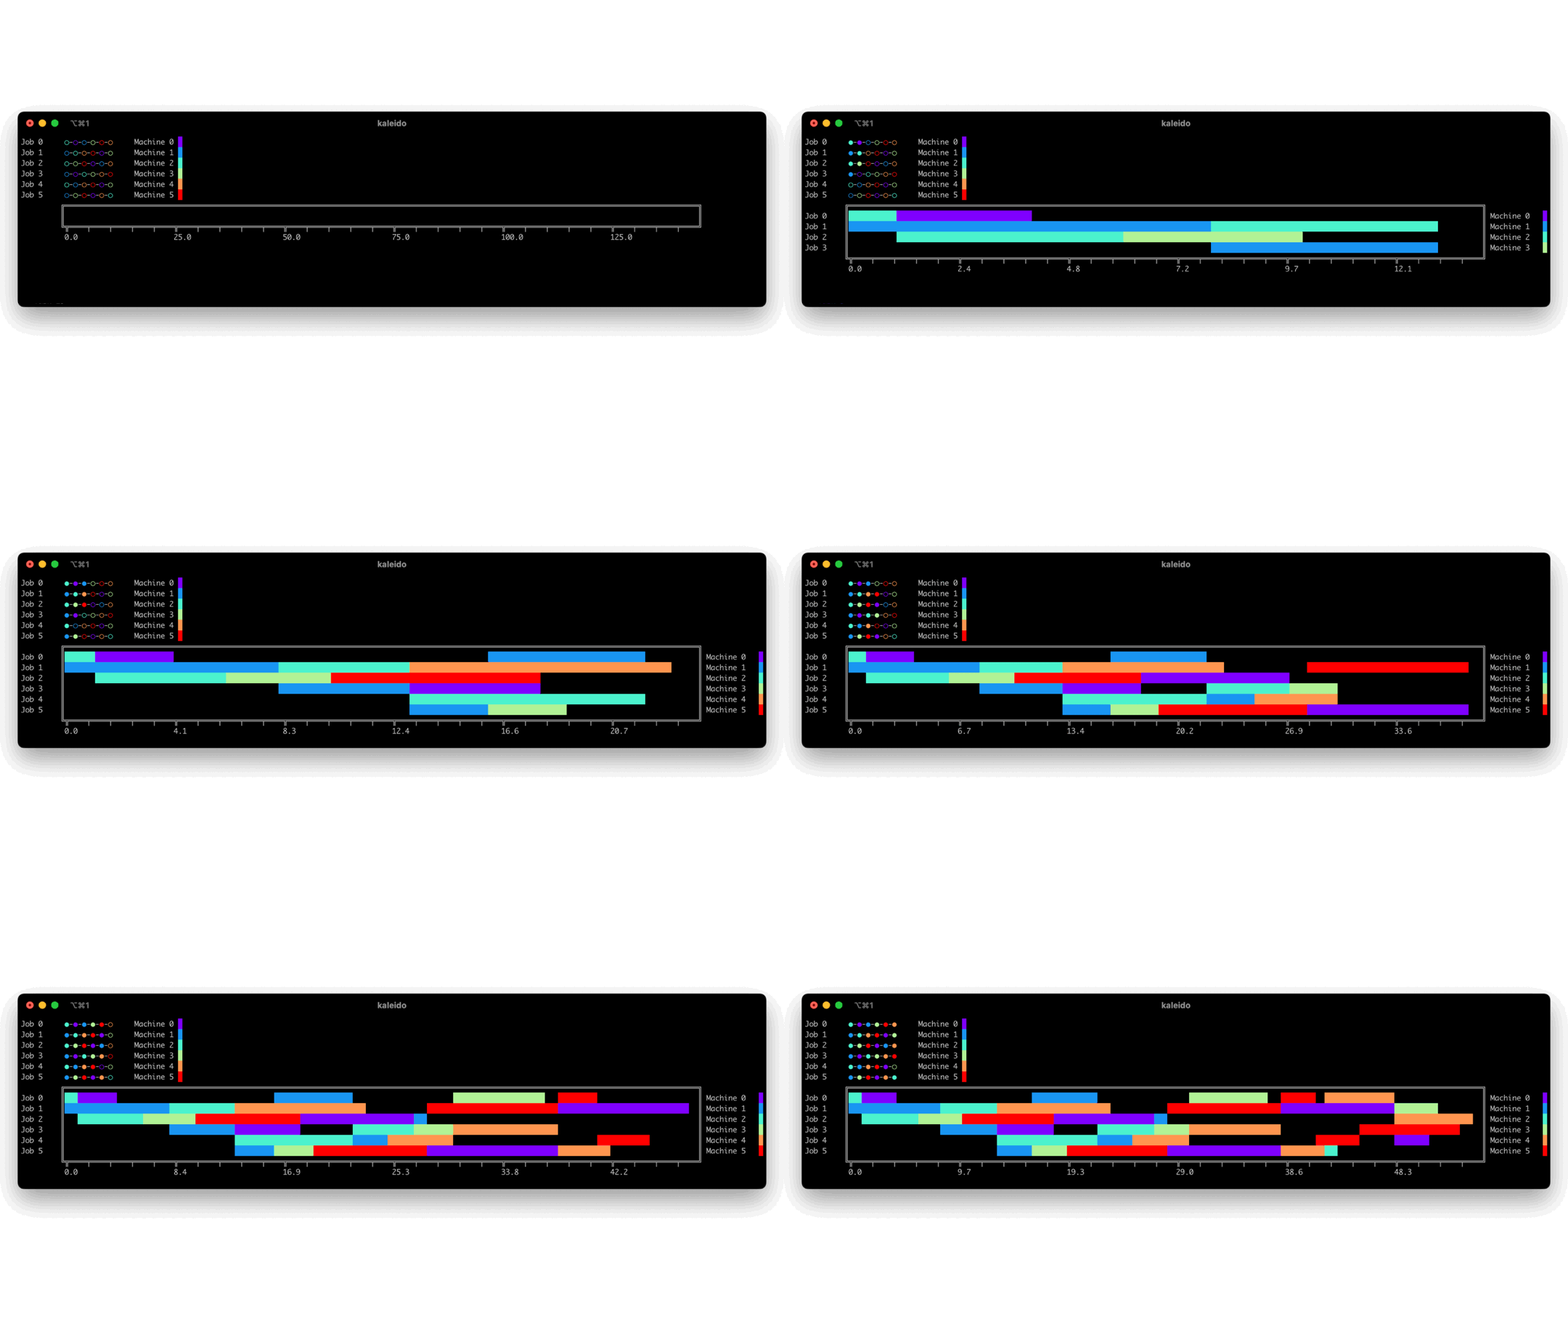
Ths project provides visualisation for the Job Shop Scheduling Problem (JSP).
This is focused on Gantt charts. The input date for the visualisation is inspired by plotly's Gantt chart api.
jsp-vis is a standalone package and in designed to be used in combination with a JSP-reinforcement learning environments that follow the Gymnasium Environment standard.
The render function of the environment can be used to render the Gantt chart.
Typically the render function can implement different modes like human, rgb_array or ansi rendering.
The jsp-vis package offers three different visualisations: console visualisation, rgb_array visualisation and window visualisation.
The window visualisation is essentially only rendering the rgb_array visualisation in a window using OpenCV.
The console visualisation might be used for the asni mode of a render function, the rgb_array visualisation for the rgb_array mode and the window visualisation for the human mode.
Installation
Install the package with pip:
pip install jsp-vis
Minimal Working Example: console visualisation
from jsp_vis.console import gantt_chart_console
import pandas as pd

df = pd.DataFrame([
   {'Task': 'Job 0', 'Start': 5, 'Finish': 16, 'Resource': 'Machine 0'},
   {'Task': 'Job 0', 'Start': 28, 'Finish': 31, 'Resource': 'Machine 1'},
   {'Task': 'Job 0', 'Start': 31, 'Finish': 34, 'Resource': 'Machine 2'},
   {'Task': 'Job 0', 'Start': 34, 'Finish': 46, 'Resource': 'Machine 3'},
   {'Task': 'Job 1', 'Start': 0, 'Finish': 5, 'Resource': 'Machine 0'},
   {'Task': 'Job 1', 'Start': 5, 'Finish': 21, 'Resource': 'Machine 2'},
   {'Task': 'Job 1', 'Start': 21, 'Finish': 28, 'Resource': 'Machine 1'},
   {'Task': 'Job 1', 'Start': 28, 'Finish': 32, 'Resource': 'Machine 3'}
])
num_of_machines = 4

gantt_chart_console(df, num_of_machines)
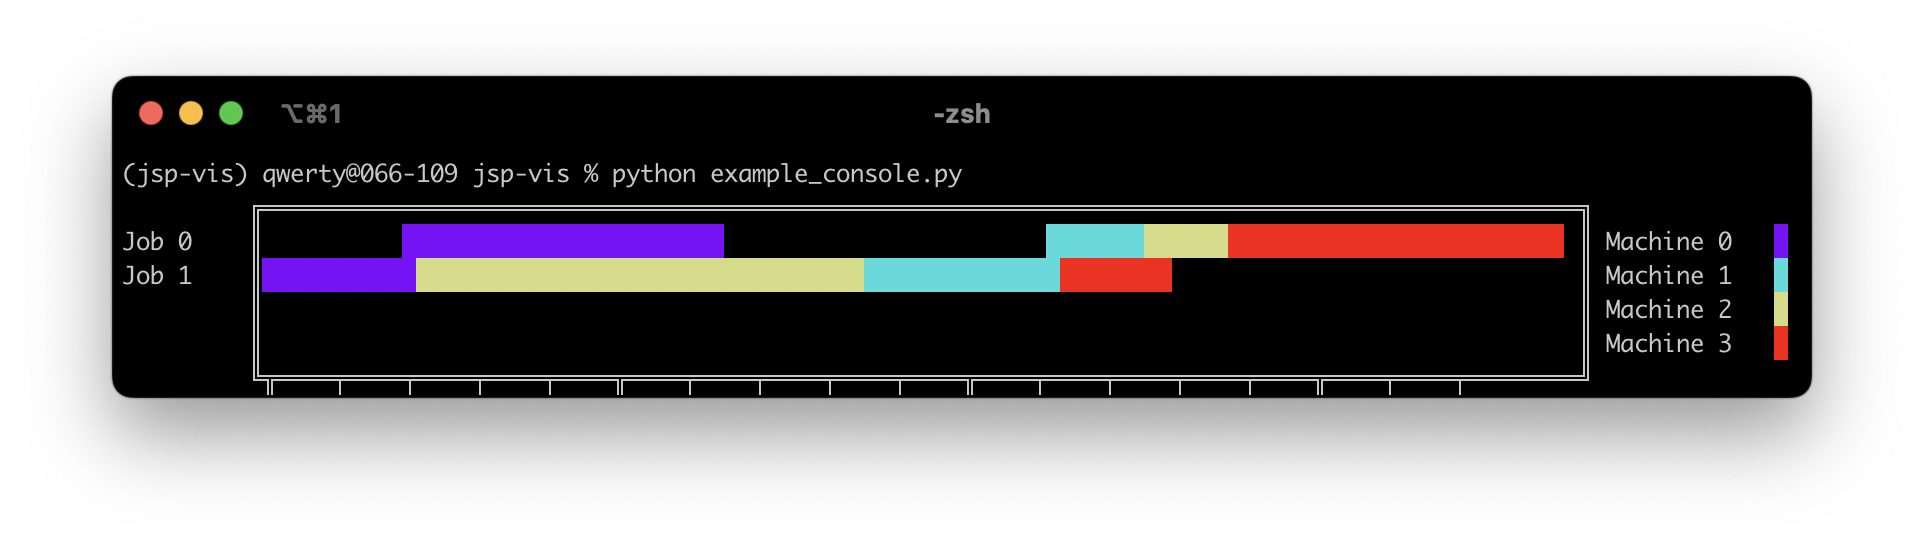
The code above will render the following Gantt chart in the console:
Minimal Working Example: console visualisation
from jsp_vis.cv2_window import render_gantt_in_window
import pandas as pd

df = pd.DataFrame([
   {'Task': 'Job 0', 'Start': 5, 'Finish': 16, 'Resource': 'Machine 0'},
   {'Task': 'Job 0', 'Start': 28, 'Finish': 31, 'Resource': 'Machine 1'},
   {'Task': 'Job 0', 'Start': 31, 'Finish': 34, 'Resource': 'Machine 2'},
   {'Task': 'Job 0', 'Start': 34, 'Finish': 46, 'Resource': 'Machine 3'},
   {'Task': 'Job 1', 'Start': 0, 'Finish': 5, 'Resource': 'Machine 0'},
   {'Task': 'Job 1', 'Start': 5, 'Finish': 21, 'Resource': 'Machine 2'},
   {'Task': 'Job 1', 'Start': 21, 'Finish': 28, 'Resource': 'Machine 1'},
   {'Task': 'Job 1', 'Start': 28, 'Finish': 32, 'Resource': 'Machine 3'}
])
num_of_machines = 4

render_gantt_in_window(
        df=df,
        n_machines=num_of_machines,
        wait=2000 # time in ms that the `cv2`-window is open.
        # wait=None # ''None'' will keep the window open till a keyboard occurs.
    )
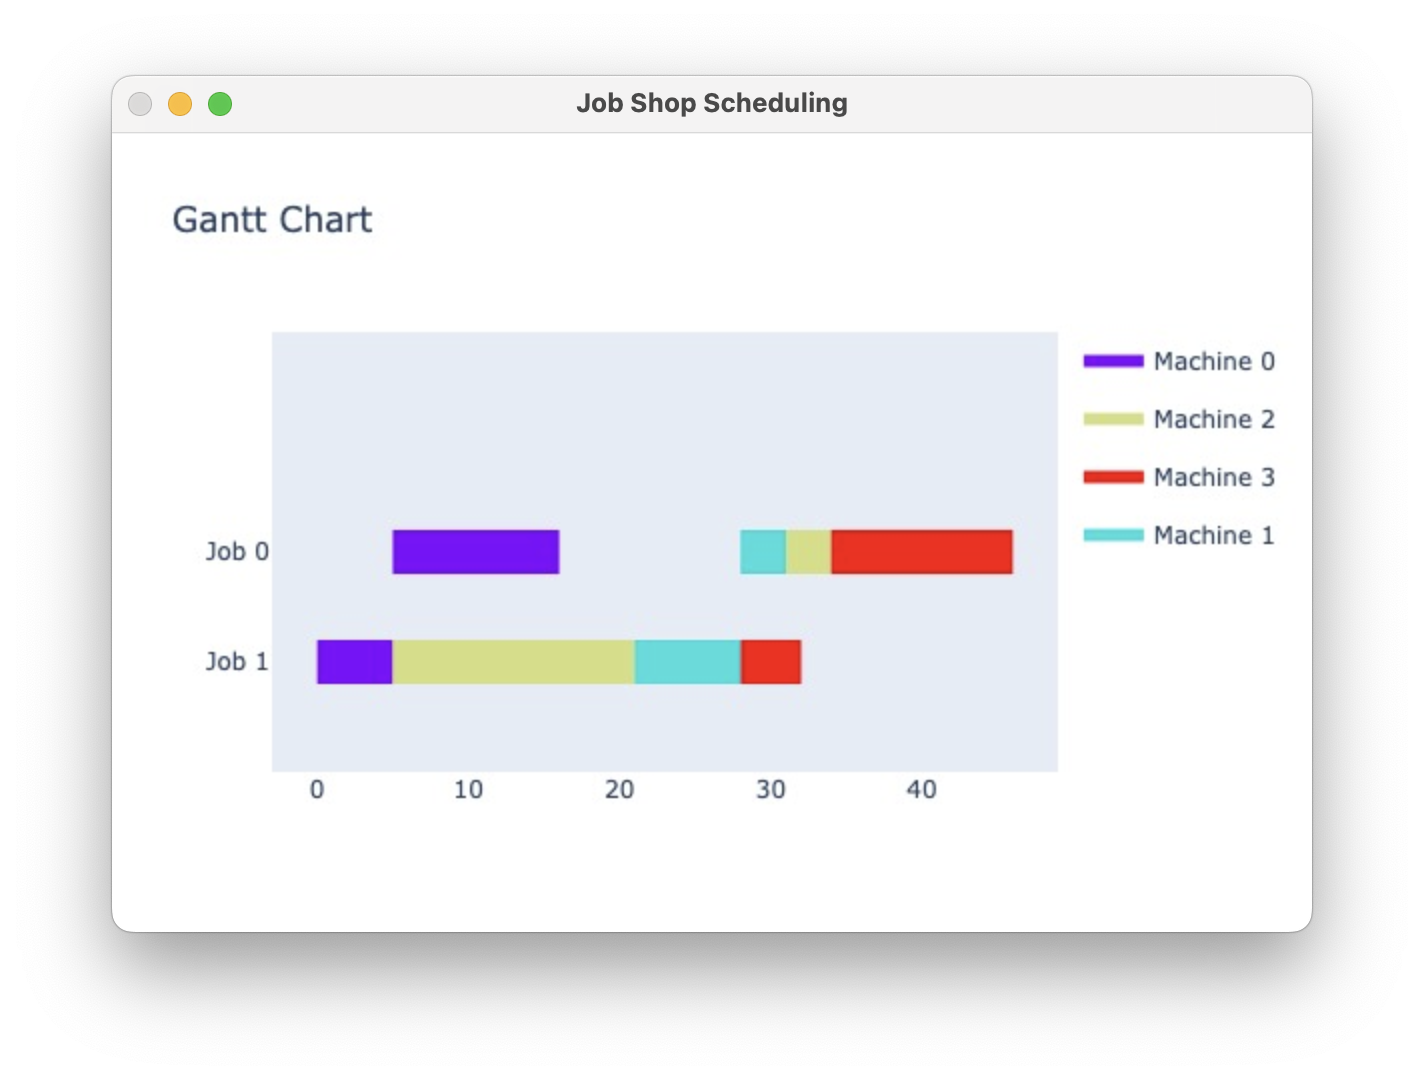
The code above will render the following Gantt chart in the console:
More Examples
For more examples you can have a look at the test files in the tests directory.
Every visualisation has its own test file and is tested on two different jsp instances defined in the conftest.py.
License
Distributed under the MIT License. See LICENSE.txt for more information.
Release history Release notifications | RSS feed


Download files
Download the file for your platform. If you're not sure which to choose, learn more about installing packages.
Source Distribution
Built Distribution
Filter files by name, interpreter, ABI, and platform.
If you're not sure about the file name format, learn more about wheel file names.
Copy a direct link to the current filters
File details
Details for the file jsp_vis-1.2.0.tar.gz.
File metadata
- Download URL: jsp_vis-1.2.0.tar.gz
- Upload date:
- Size: 11.2 kB
- Tags: Source
- Uploaded using Trusted Publishing? No
- Uploaded via: twine/6.2.0 CPython/3.13.14
File hashes
| Algorithm | Hash digest | |
|---|---|---|
| SHA256 |
8d75e96e70cc43c42455bef52dc4cd489f56c8328f3dcedee2287d5b4c905915
|
|
| MD5 |
aa767c7570ecde13f0c440ff66d4a420
|
|
| BLAKE2b-256 |
04e8587230a46e036ebe6106c1a91cc256048b8ee4e17c3a5b9de59163a8d6dd
|
File details
Details for the file jsp_vis-1.2.0-py3-none-any.whl.
File metadata
- Download URL: jsp_vis-1.2.0-py3-none-any.whl
- Upload date:
- Size: 9.6 kB
- Tags: Python 3
- Uploaded using Trusted Publishing? No
- Uploaded via: twine/6.2.0 CPython/3.13.14
File hashes
| Algorithm | Hash digest | |
|---|---|---|
| SHA256 |
9097c65404f5f838676b298b0a22240799ec7fd332c8f6d1872976f512e5afc3
|
|
| MD5 |
da7050f3bf740b70e6be6c55d490fd72
|
|
| BLAKE2b-256 |
89e471bf6dd691bad92ee69da676e280b91bdc3ea7bb4ef467887a2f86cdb2ed
|






