

Turn your Jupyter notebook into a branching graph of experiments.
JupyterLab 4 · .ipygb file format · runs at /graph · source-available
The problem
Every ML notebook starts clean and ends as a 2,000-line scroll of dead cells, half-tried models, and "wait — which run produced this number?" You try five approaches, comment out four, lose track of which features fed which model, and can never reproduce the good result. AI can write the code for you now — but your experiments are still a linear mess.
Notebooks are linear. Experimentation isn't.
What ipyGraph is
ipyGraph (a.k.a. Graphbook) is a JupyterLab 4 extension that turns a notebook into a branching DAG of cells. Every experiment is a branch on a living graph instead of a copy-pasted block you'll never find again. A shared data-prep step forks into competing models; each branch keeps its own state; you compare tips and keep the winner.
It ships with a plan-first AI copilot that designs the experiment graph, writes the code, runs it, and iterates — and an execution engine where one branch can never silently contaminate another.
You launch it with its own command and it opens at /graph:
pip install jupytergraph
jupytergraph          # opens JupyterLab at http://localhost:8888/graph
The .ipygb file format
ipyGraph adds a new document type: .ipygb (a "Graphbook"). It's a superset of the Jupyter notebook format — the same nbformat JSON with cells, outputs, and metadata — with a little extra per-cell ipygb metadata that records the graph:
"metadata": {
  "ipygb": {
    "parent_id": "root-1",        // which cell's outputs this one builds on
    "branch_name": "encode-nn",   // the branch this cell starts (optional)
    "parent_ids": ["a", "b"],     // 2+ parents = a merge cell
    "description": "…",           // shown in Plan view
    "inputs": { … }               // explicit variables a merge consumes
  }
}
Because it's a superset, the kernel, outputs, and rendering are ordinary Jupyter — nothing proprietary about how your code runs. And you can always export any root→tip path back to a plain .ipynb to share or hand off.
See it
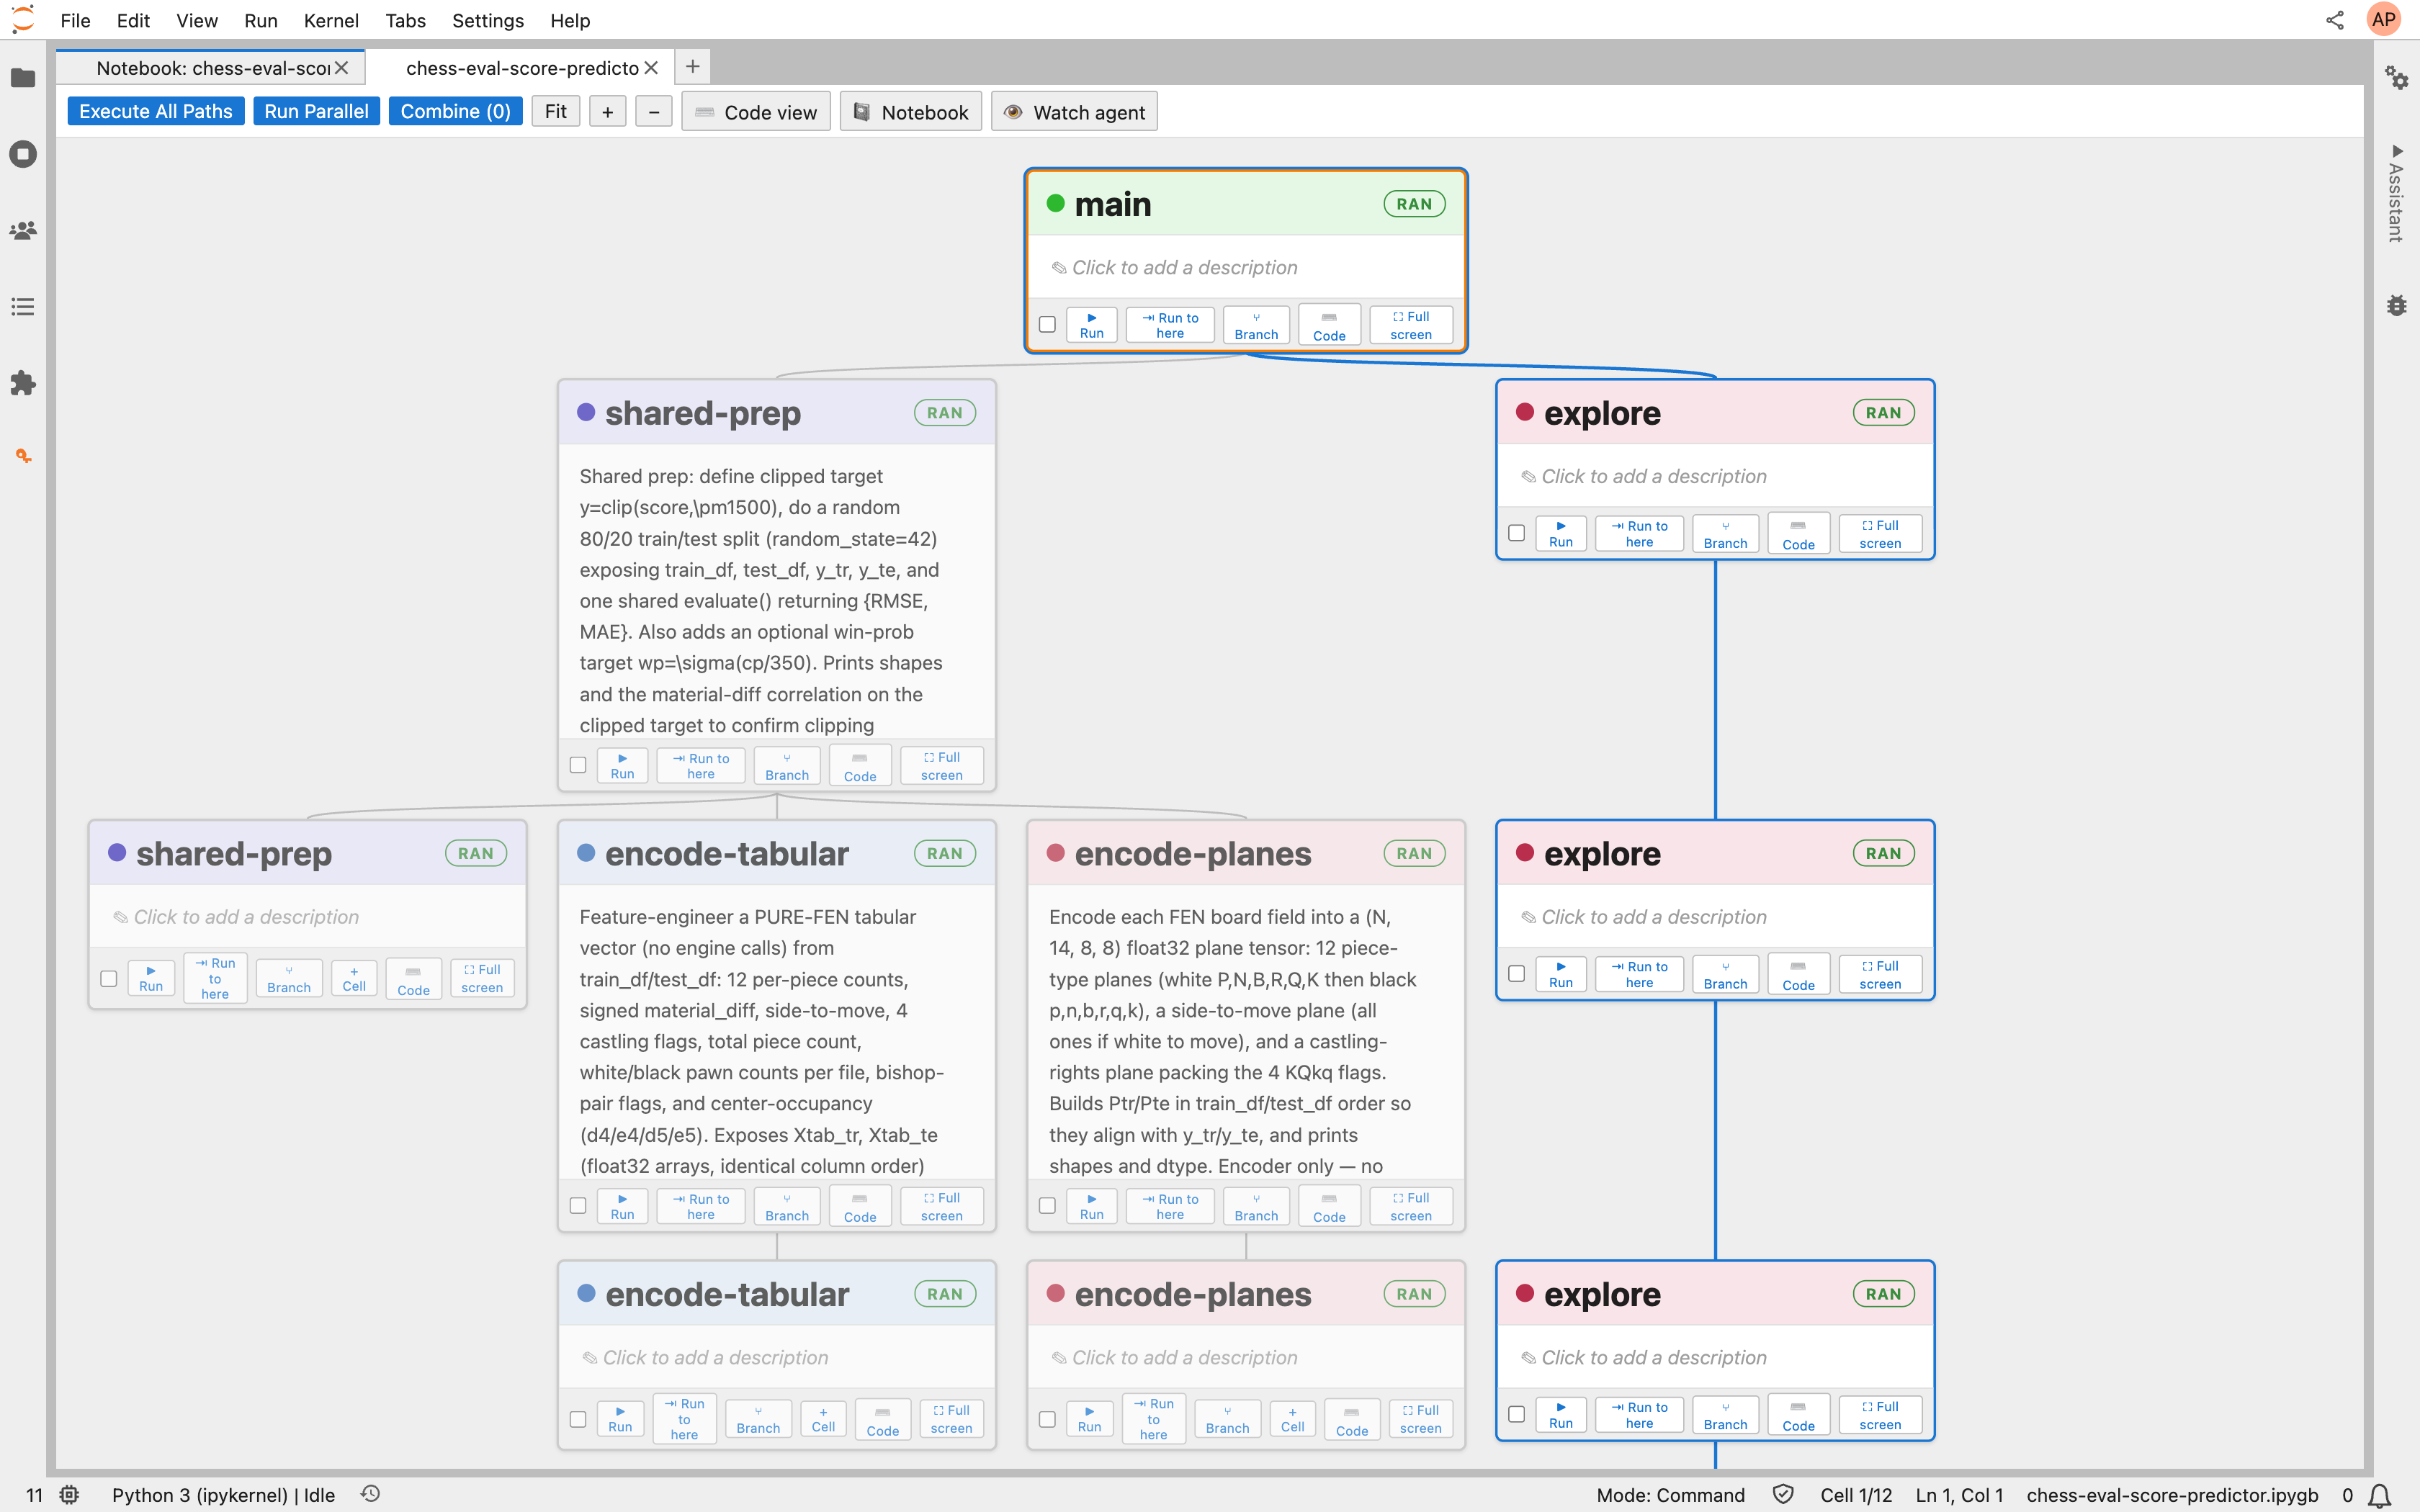
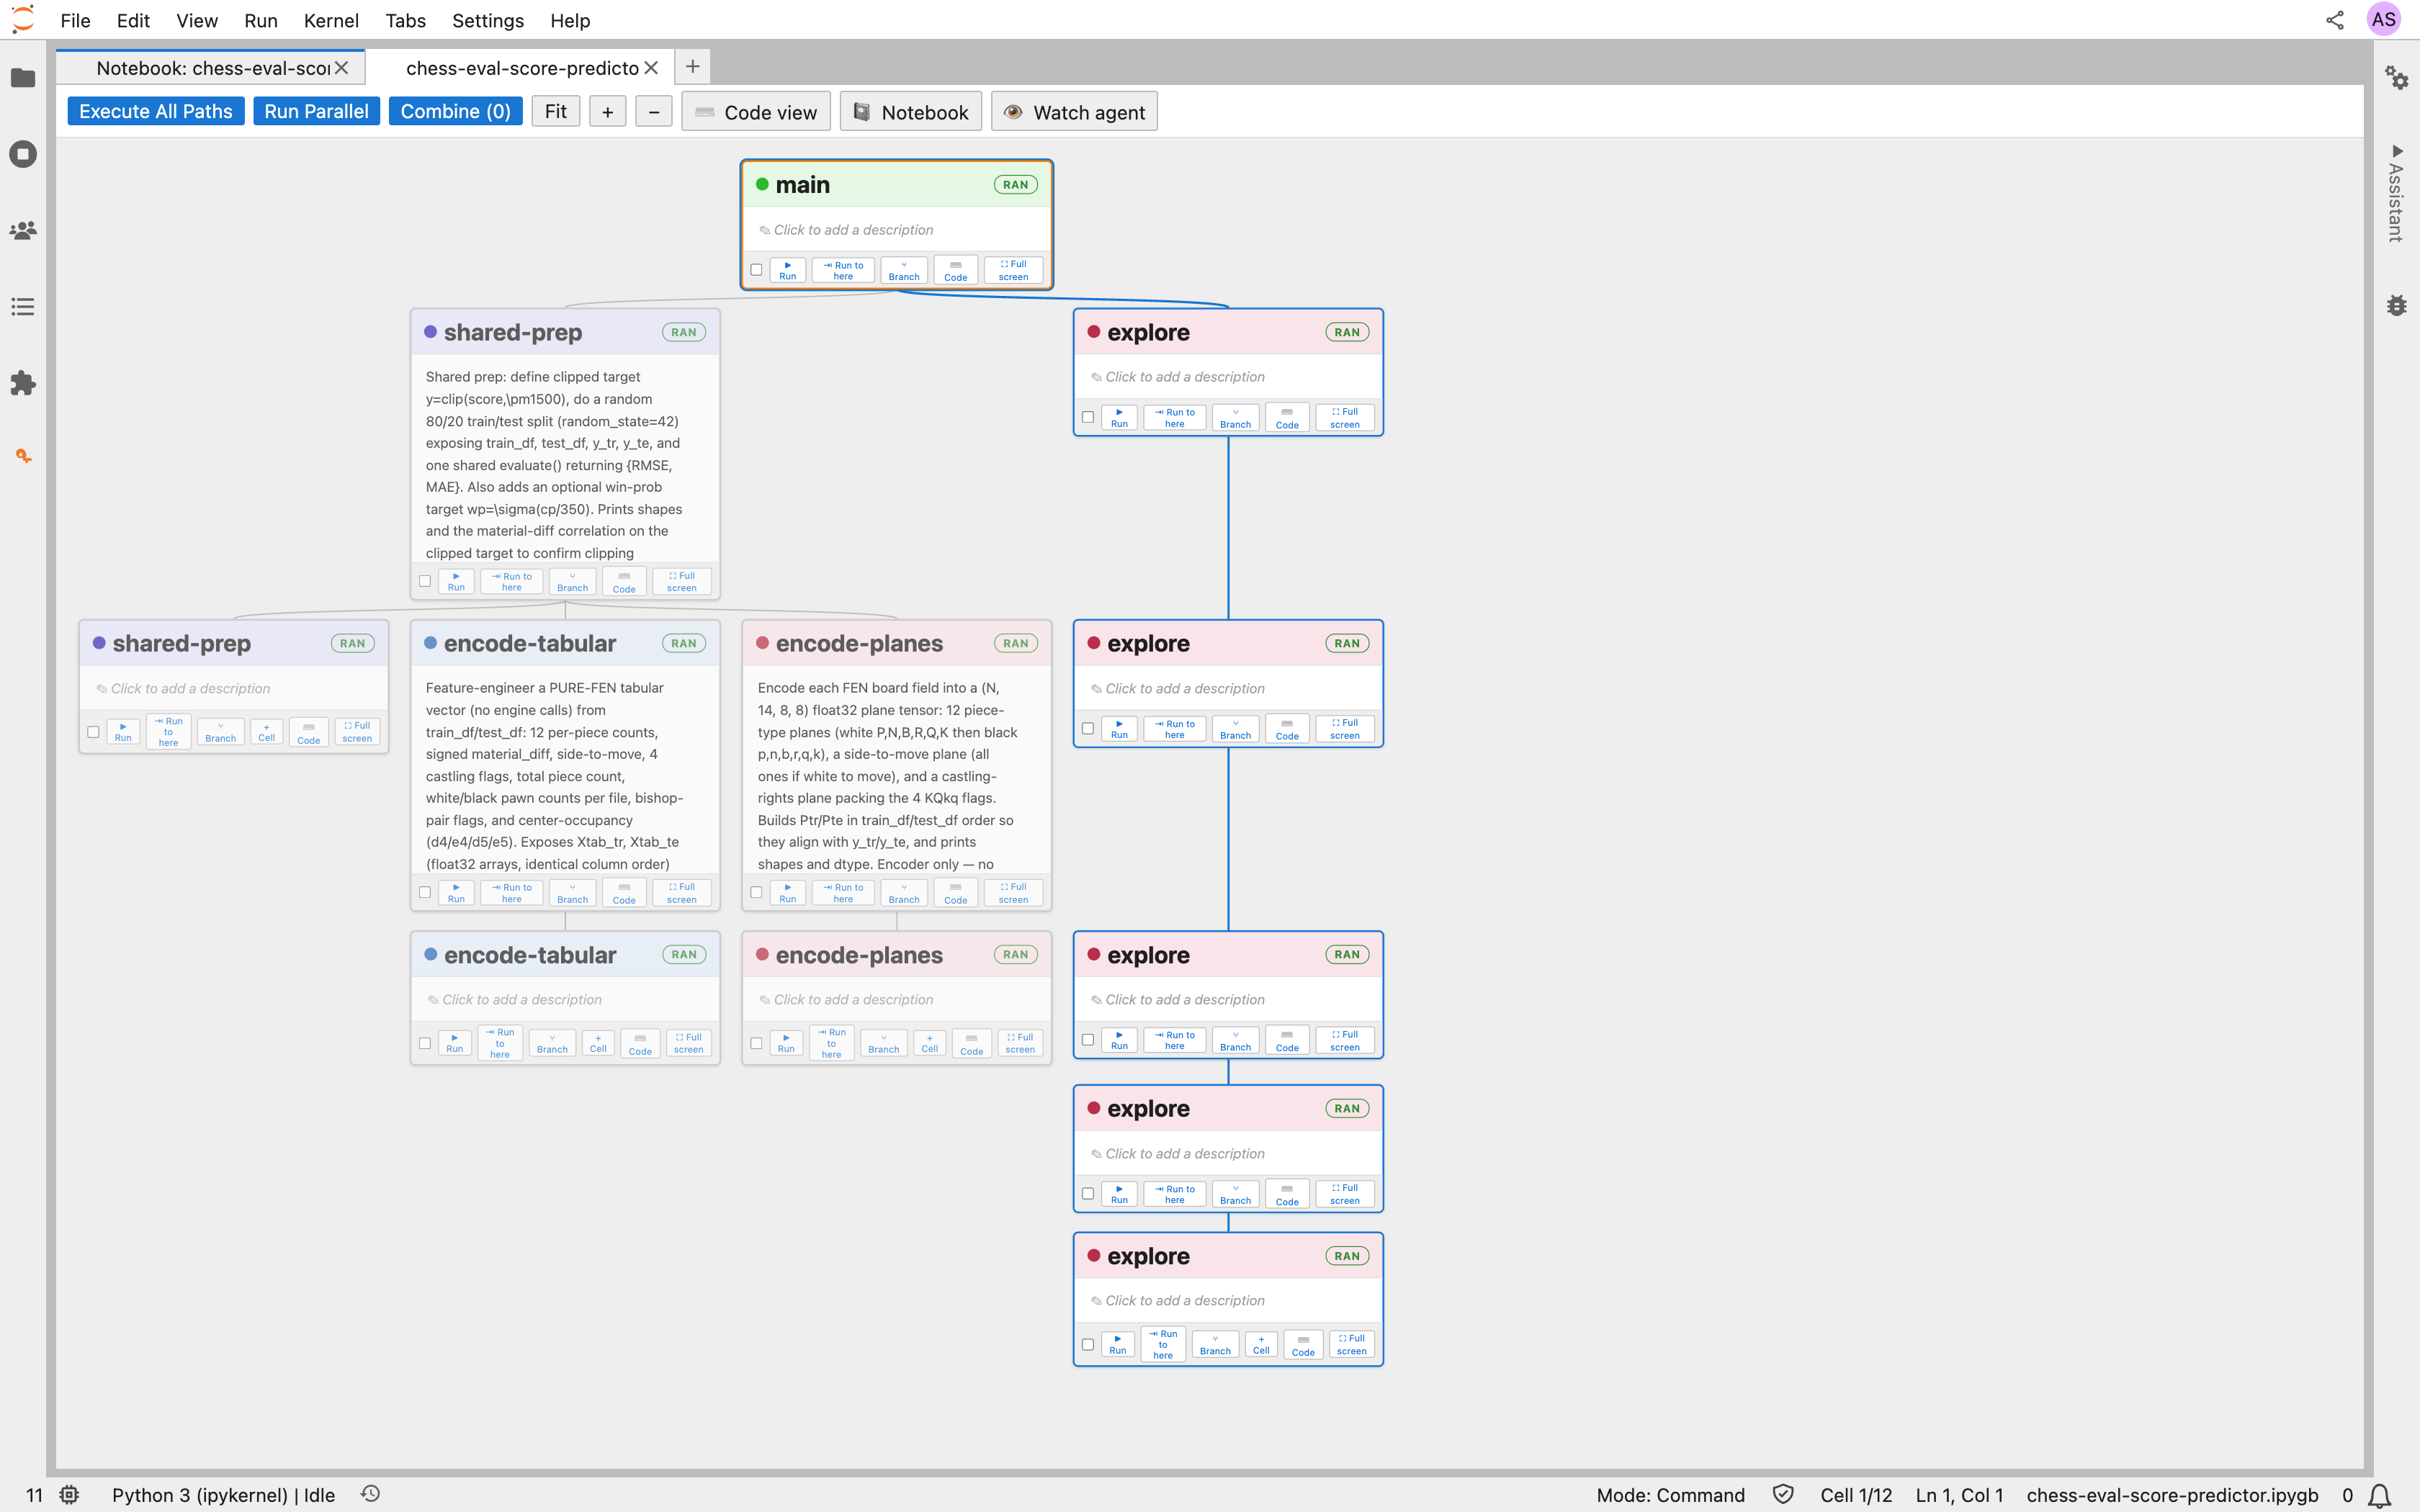
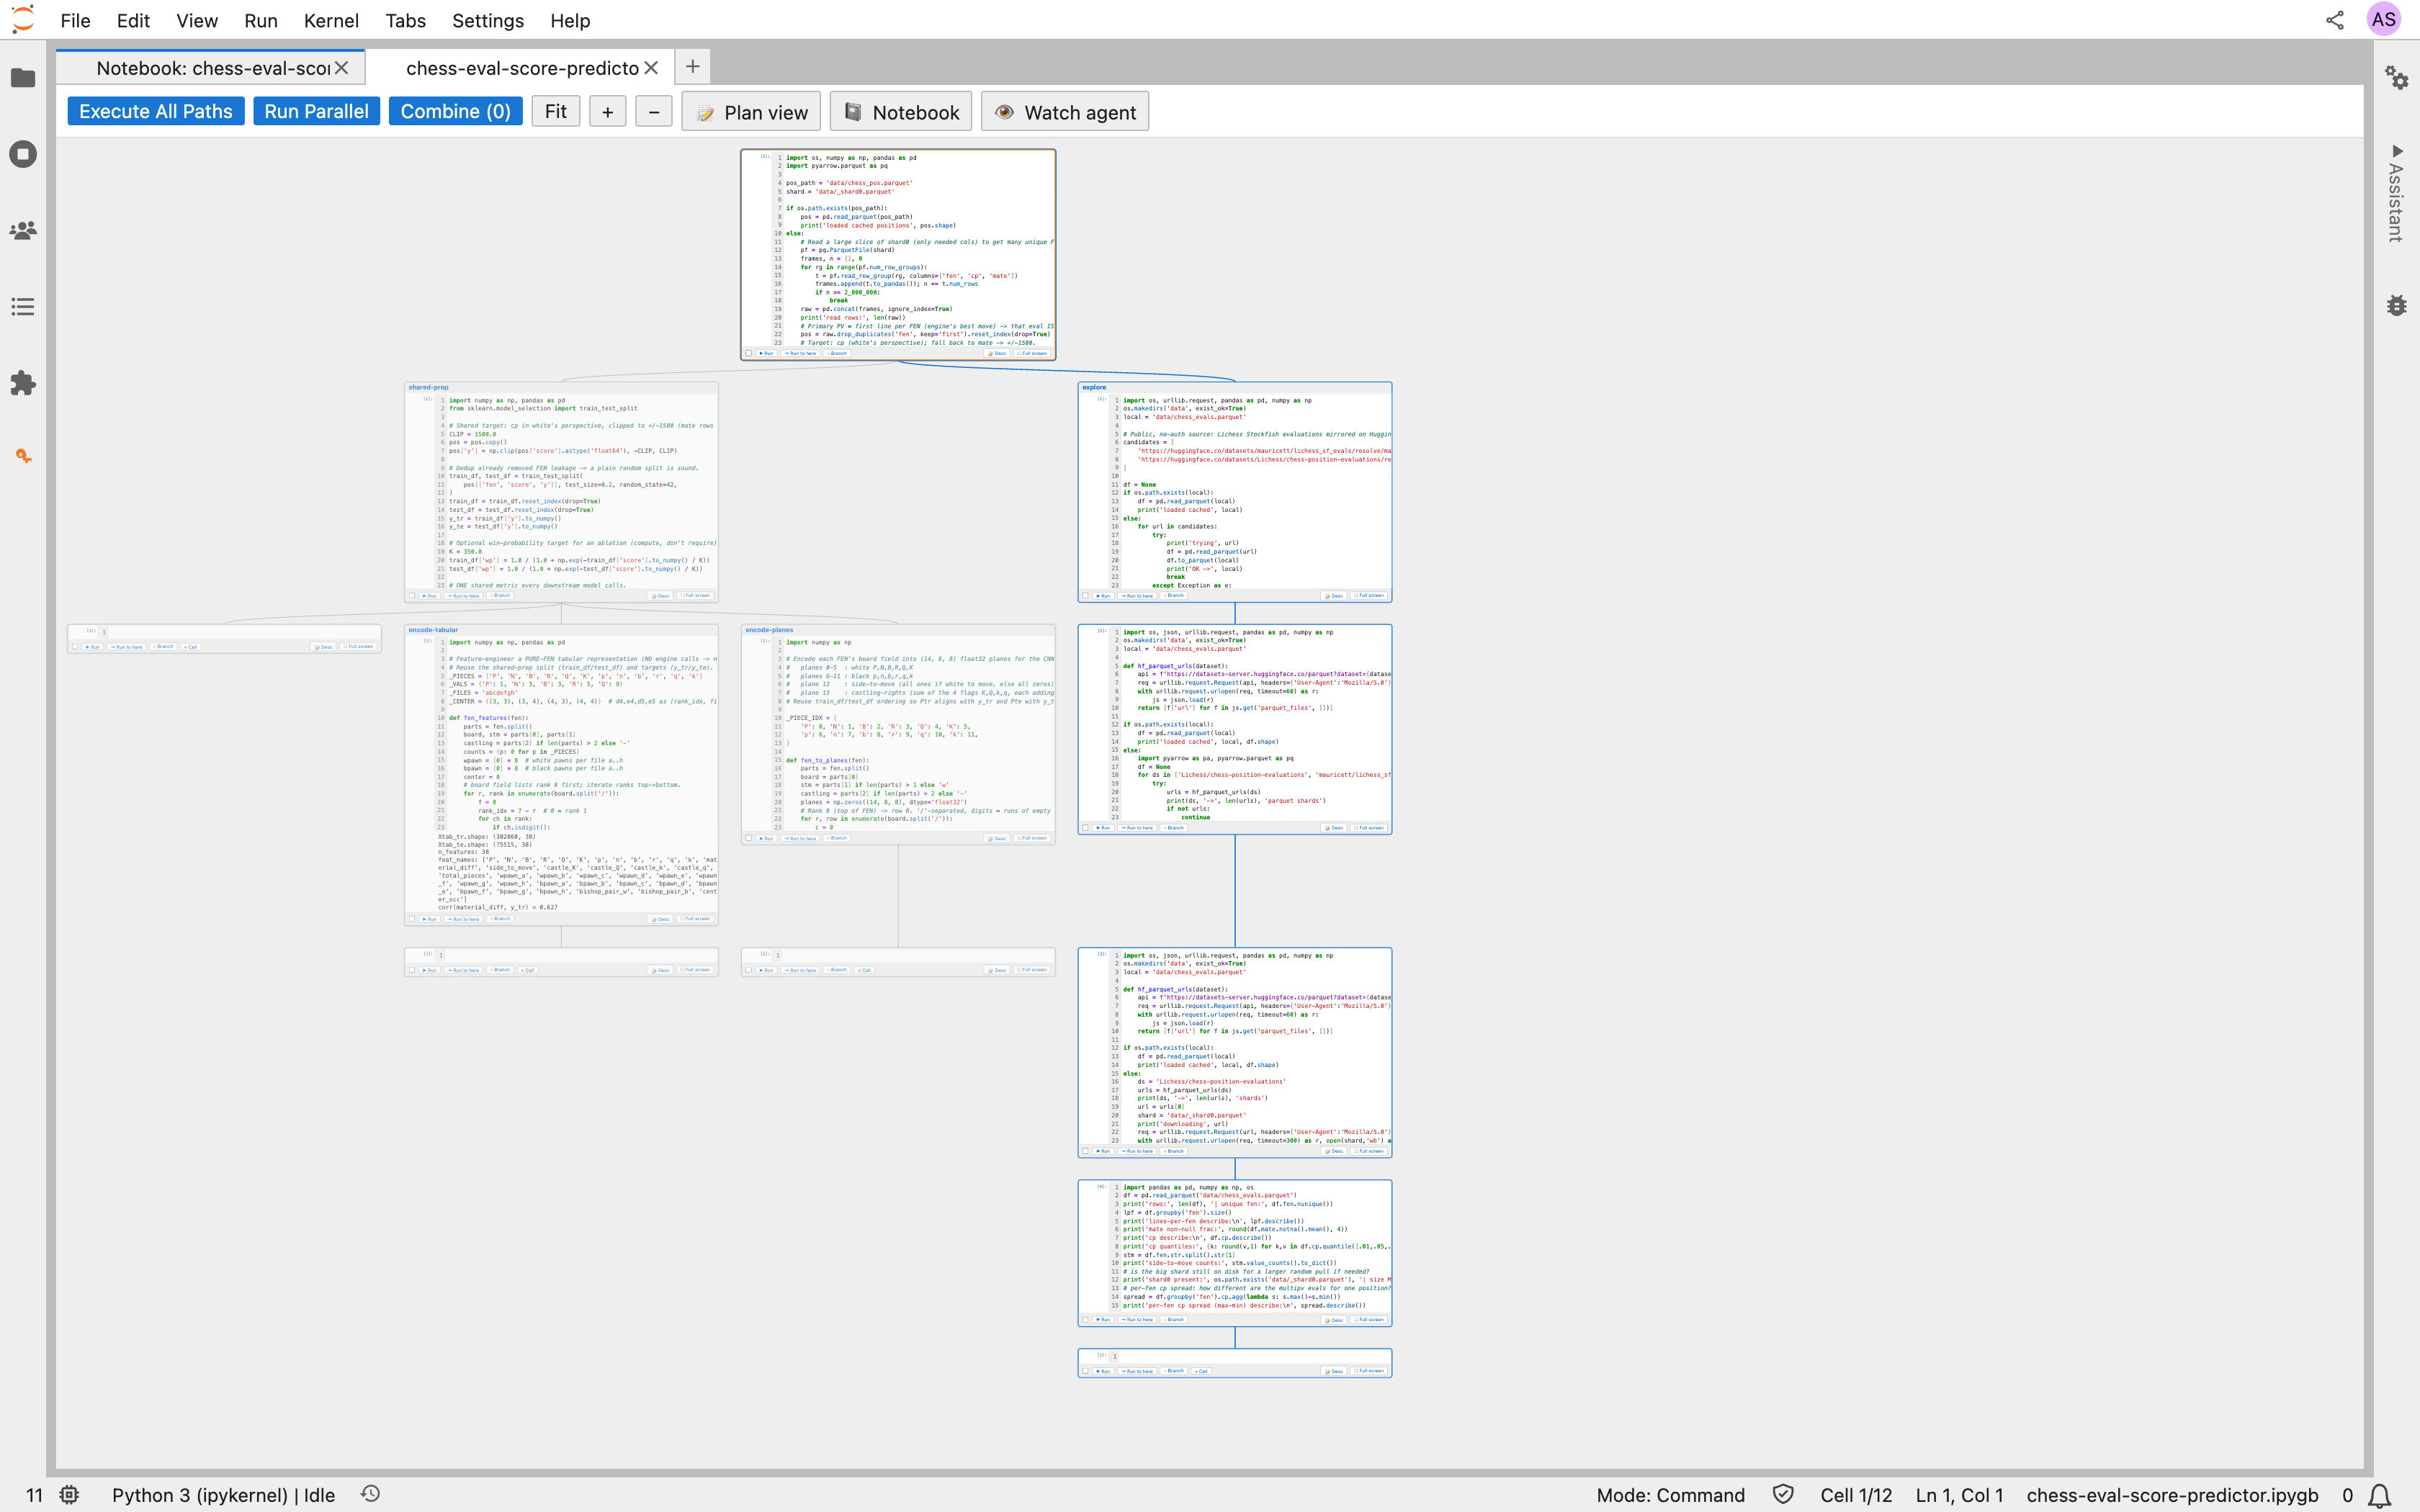
The screenshots below are a real ipyGraph project — predicting a chess engine's position evaluation from the board. A shared prep step splits into two feature representations (tabular vs. board-planes), which feed different model families.
Plan view — the whole experiment reads like a flowchart, and every step documents itself:
Code view — those same nodes are real, runnable Jupyter cells with live outputs:
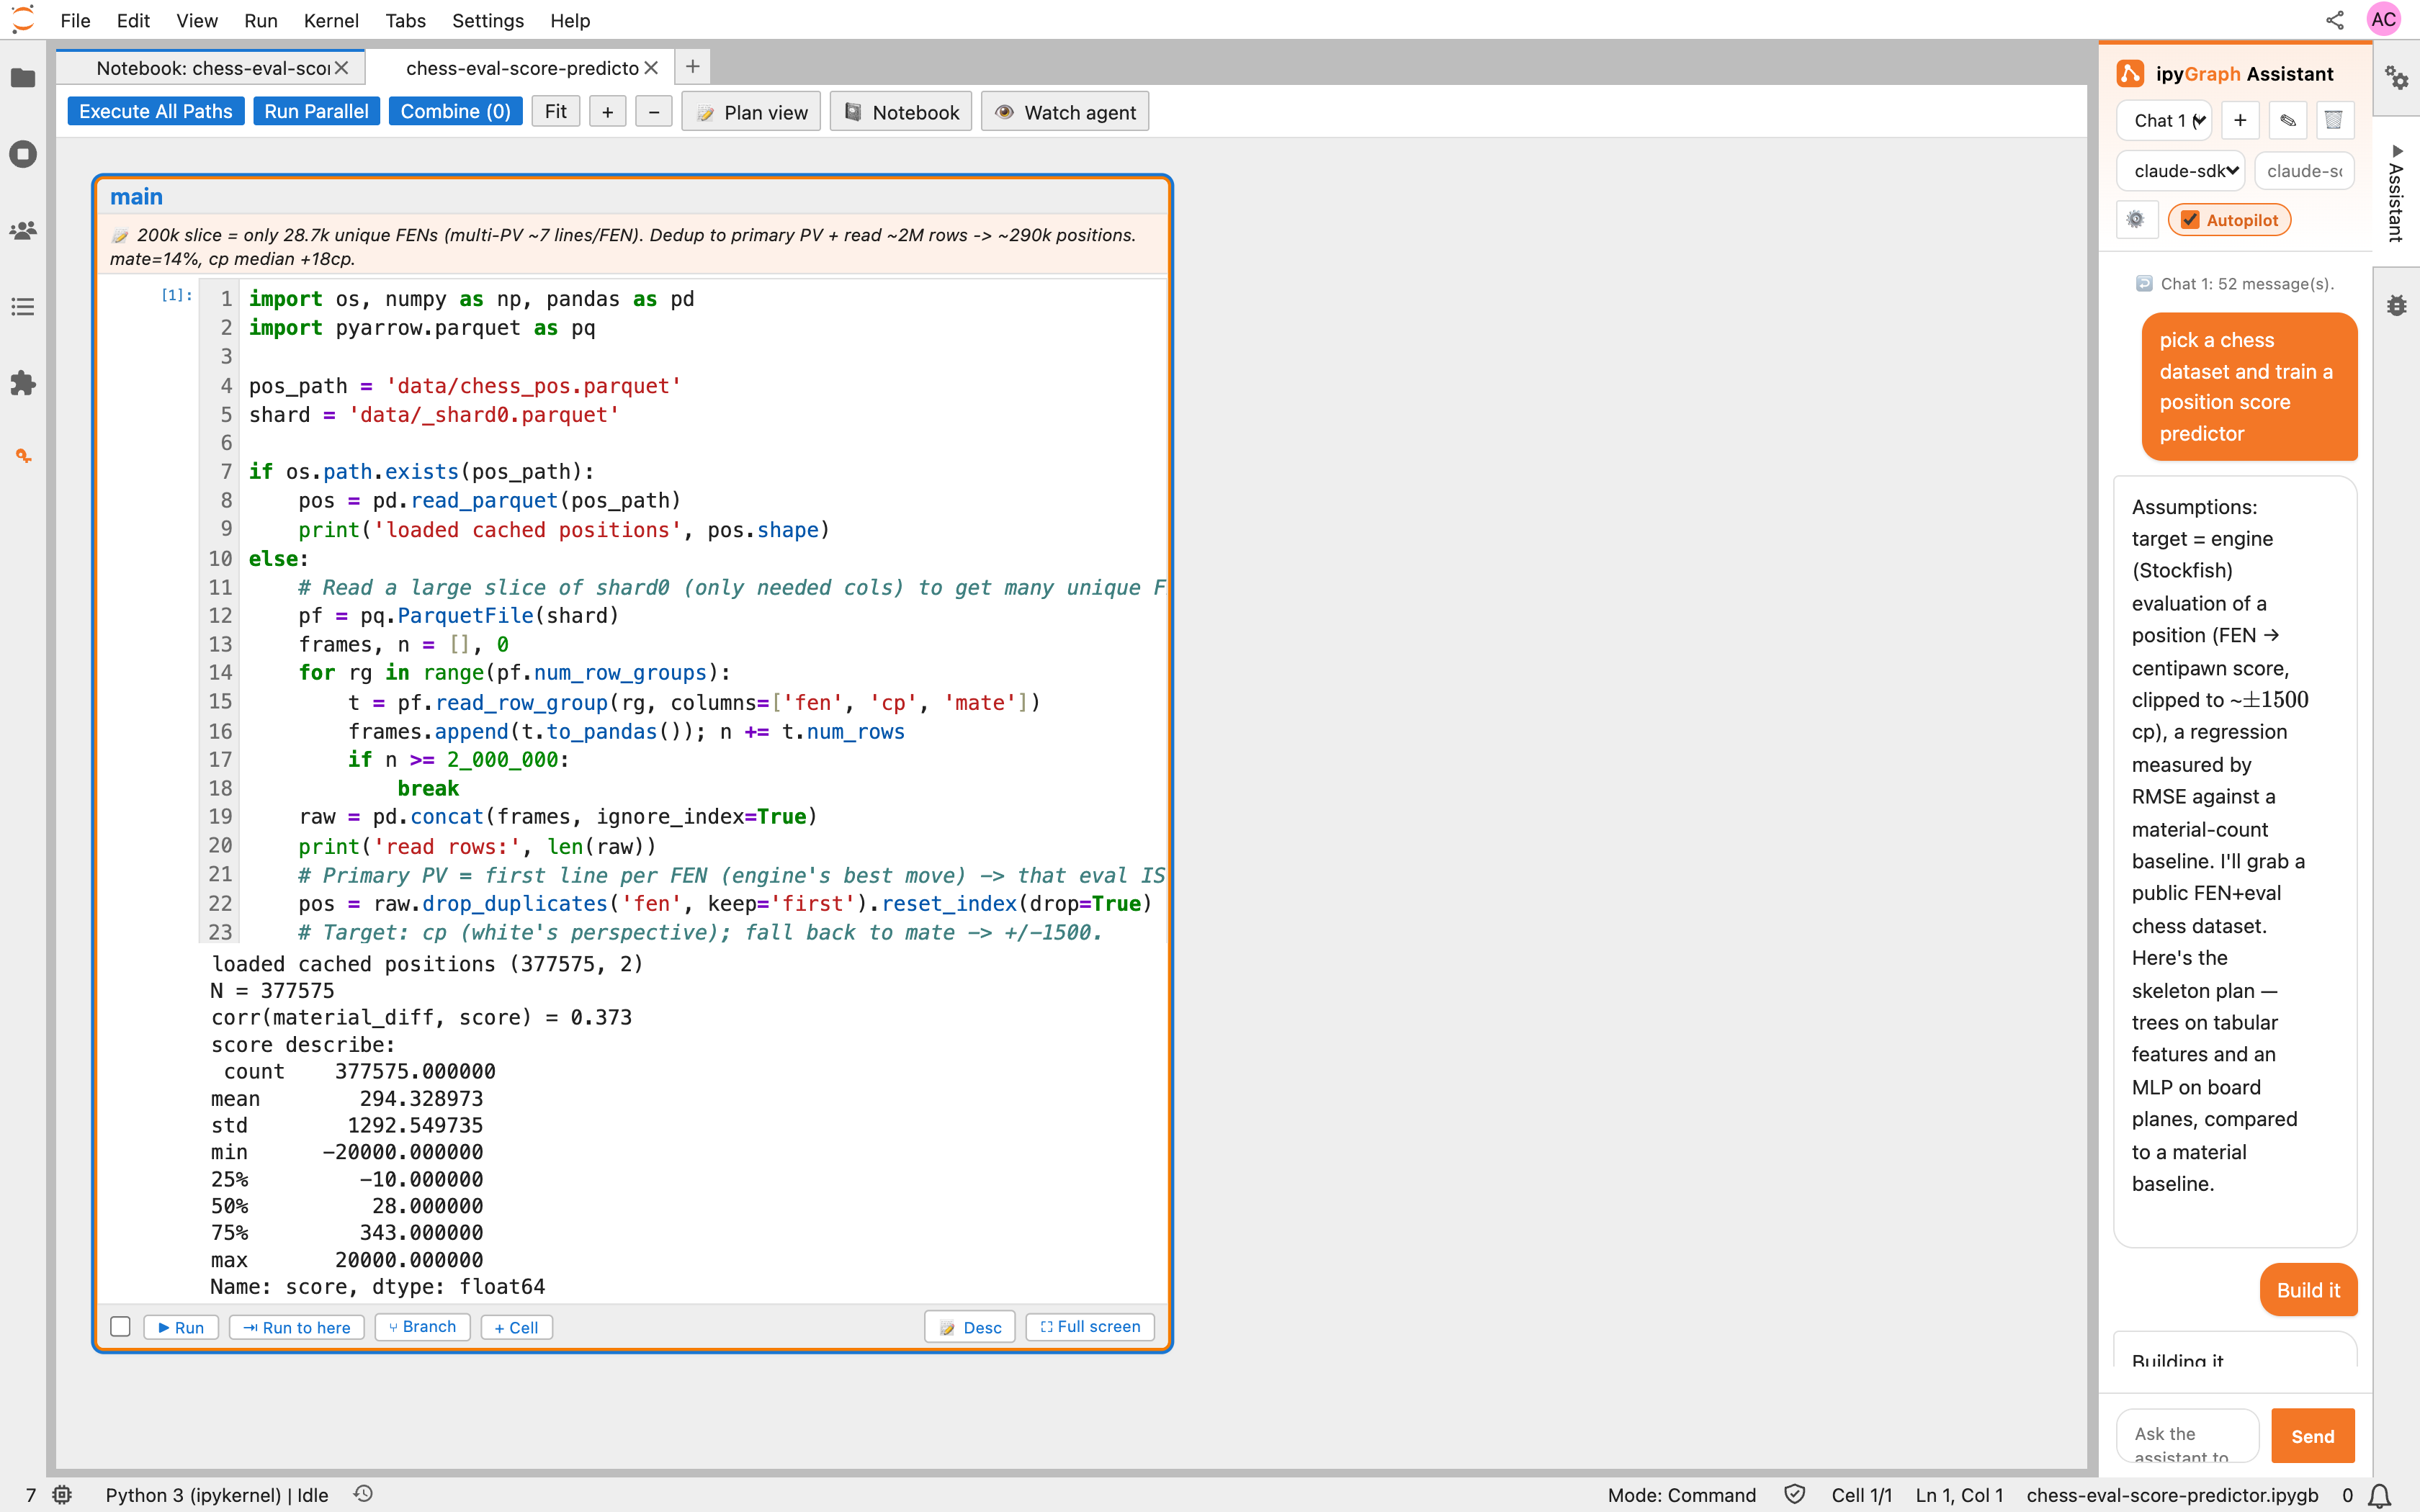
The AI copilot builds and iterates on the graph beside you (Autopilot is on by default):
Parallel execution
Branches are independent, so ipyGraph runs them like an experiment should run: shared prep once, models concurrently.
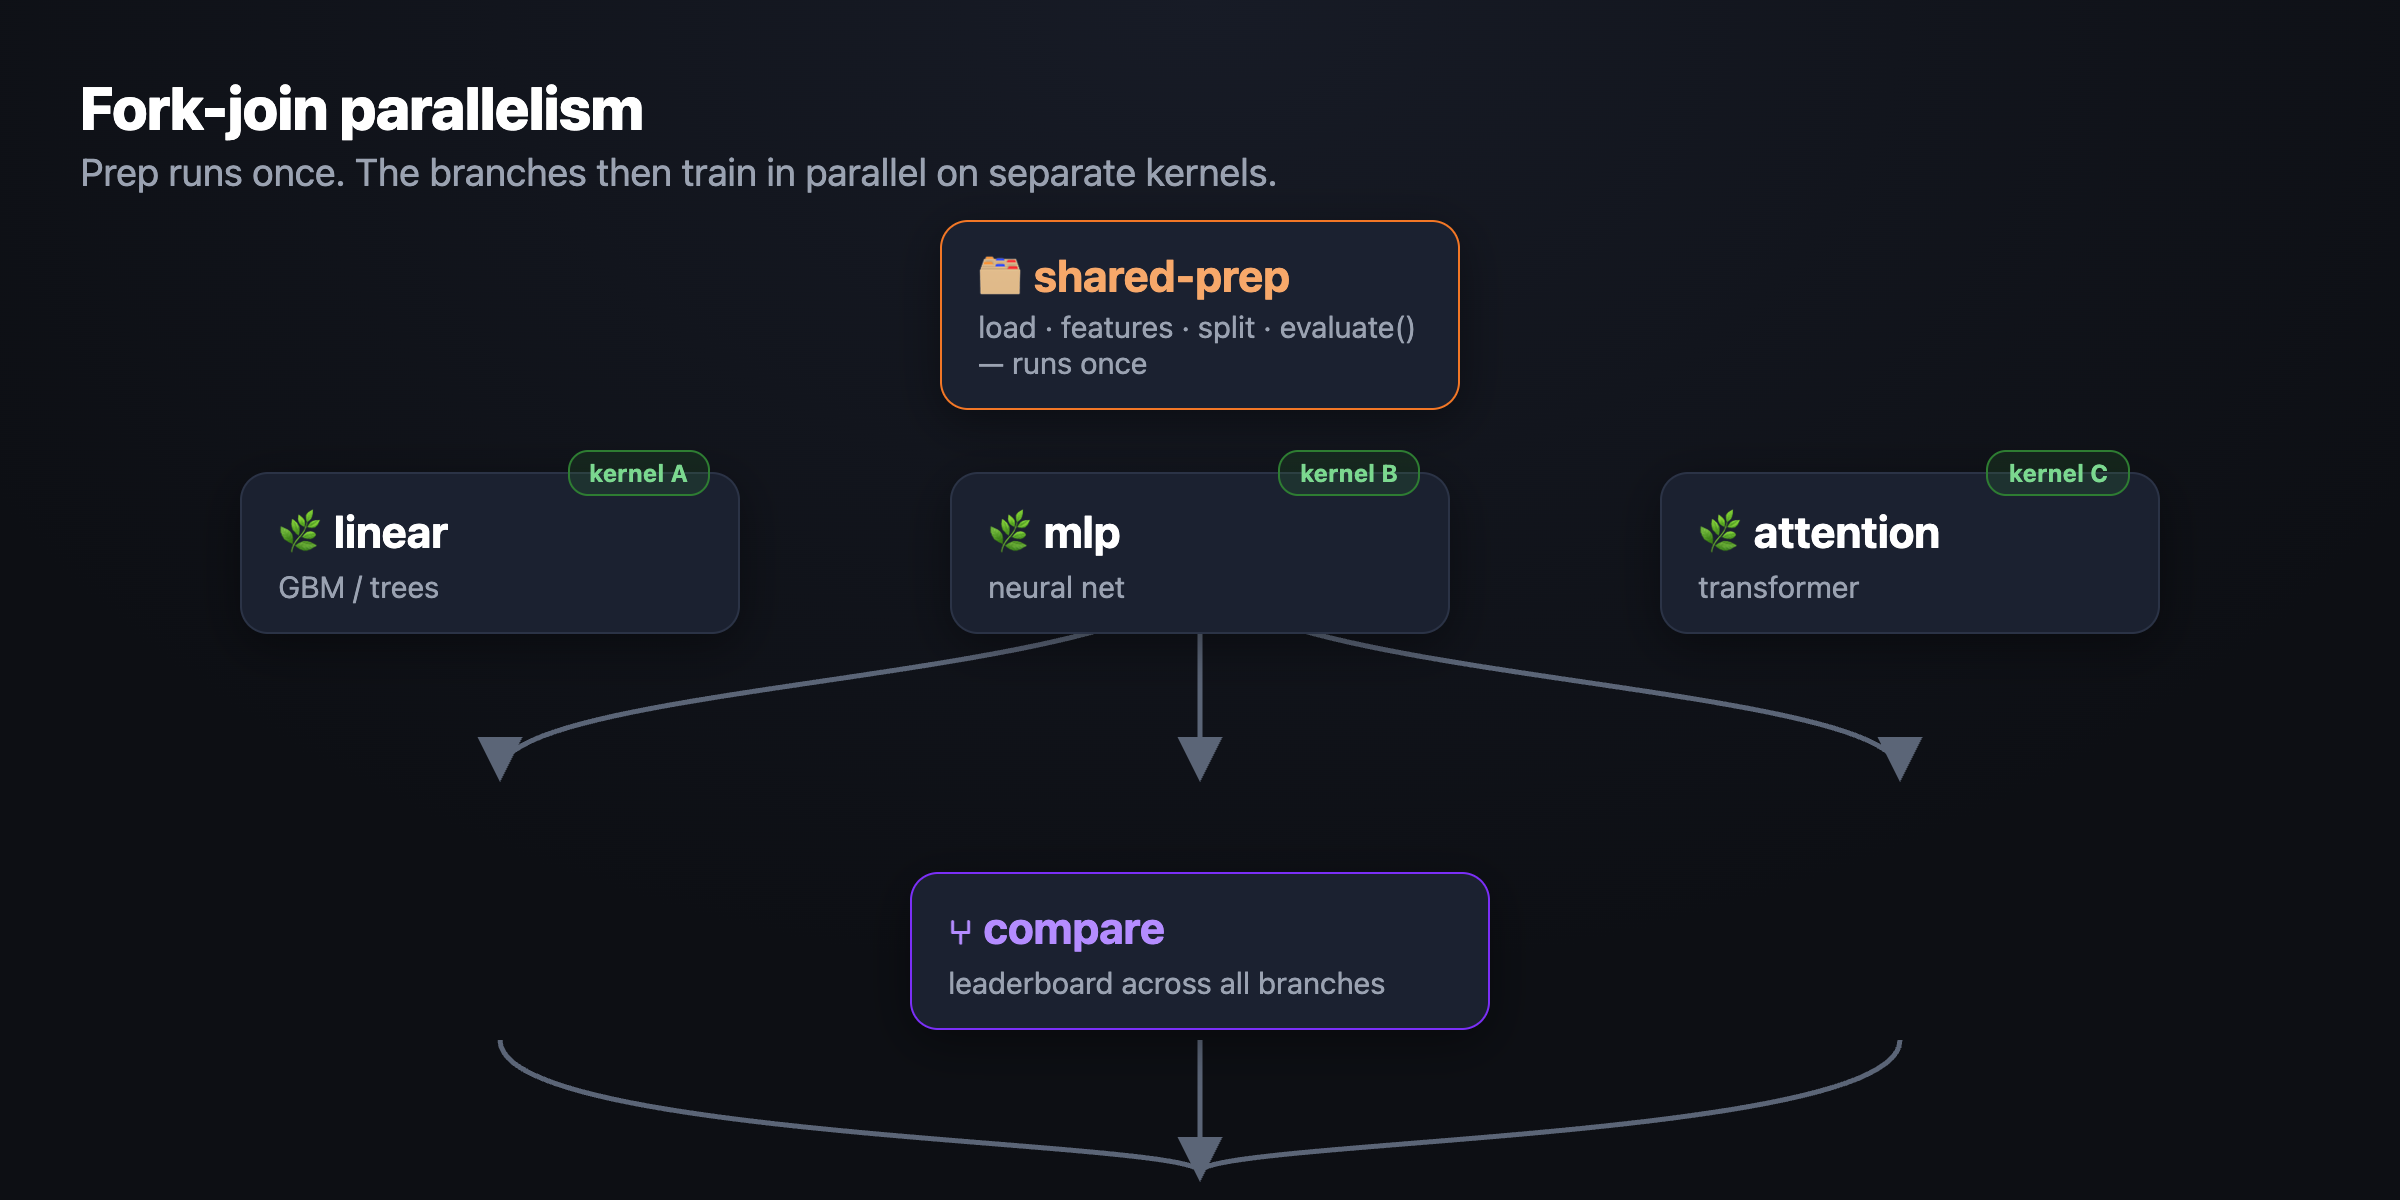
- Fork-join, not replay. Run Parallel on a 1-prep → 3-model graph runs the prep once, then trains the three models at the same time, each on its own fresh kernel. A 10-model bake-off pays for data loading once, not ten times.
- Fork-point kernel snapshots. The kernel's state is saved at each branch point, so a sibling branch resumes from a saved copy instead of re-running the whole path — and the copy rolls forward as you iterate down a branch. Tweaking the deepest cell costs one cell's runtime plus a state restore.
- True isolation. A branch's variables come only from its own path. One branch can never be polluted by code you ran on another — proven by identical results whether a branch runs alone or beside others.
- ▶ Run a single cell or ⇥ Run to here to rebuild a path from scratch on a clean isolated kernel.
More features
- 🕸️ The graph is the interface. Graph View is the default; flip any card between Plan view (titles + prose) and Code view (editors + outputs). Edit code, rename branches, and click-to-edit descriptions in place. Arrow-key navigation; a 👁 Watch agent button pans to whatever the agent is touching.
- 🤖 Plan-first AI copilot. Describe a goal → it drafts the plan on the graph, you approve, then it builds and iterates. Multi-agent: an architect-vs-critic debate picks the model shortlist; parallel coder sub-agents fill the branches. Finds data for you via a full-screen Kaggle dataset picker. Uses your Claude subscription (Claude Agent SDK, no API key) or an Anthropic/OpenAI/Gemini key.
- 🔀 Visual merge contracts. Combine branches by clicking the variables you want in each branch's code — hover to trace every occurrence, click to add it to the merge. No copy-paste, no name clashes.
- 🩺 Staleness badges. A cell warns you — "changed after last run" / "upstream changed" — when an edit made its last result stale, naming the variables that drifted.
- 📓 Still Jupyter. Real kernels, outputs, MathJax. Open the linear notebook side-by-side, and export any path to a plain
.ipynb.
Why it's useful
- You never lose an experiment — every model you try is a branch you can see, re-run, and compare.
- Results are actually reproducible — path isolation + "Run to here" means a number came from that branch's code and nothing else.
- Iteration is cheap — fork snapshots + fork-join mean expensive prep is paid for once and deep edits re-run one cell.
- The graph is self-documenting — Plan view turns a notebook into something a teammate (or future you) can read top to bottom.
- AI does the busywork, you keep control — it plans, codes, runs, and compares; you approve the plan and own the graph.
Great for ML engineers and researchers running model bake-offs, feature-engineering sweeps, and architecture searches — anyone whose "quick experiment" notebook always spirals.
Install & run
pip install jupytergraph
jupytergraph                 # launches JupyterLab at /graph
Then create a new Graphbook (.ipygb) from the launcher, or open an existing .ipygb — it opens in Graph View by default.
Requirements: JupyterLab ≥ 4, Python ≥ 3.10. For the AI copilot, either the claude CLI (subscription login) or an API key for your provider. Kaggle dataset search needs Kaggle credentials (entered once, stored server-side).
jupytergraphis JupyterLab mounted at/graphwith ipyGraph branding. Everything else — kernels, terminals, other extensions — works exactly as in JupyterLab.
Quick start
- Run
jupytergraph, then Launcher → Graphbook (.ipygb). - Open the Assistant and describe what to build — e.g. "train tree and neural models to predict chess move quality, and iterate."
- Approve the plan it draws on the graph → it builds, runs, and compares the branches.
- Fork your own branches, Run Parallel, and Save a path as
.ipynbwhen you're happy.
Development
You will need NodeJS to build the extension. jlpm is JupyterLab's pinned yarn.
python -m venv .venv && source .venv/bin/activate
pip install --editable "."
jupyter labextension develop . --overwrite
jlpm build          # rebuild the TypeScript after changes
Watch mode (rebuild on save) in one terminal, the app in another:
jlpm watch
jupytergraph
Tests: jlpm test (Jest) and Playwright/Galata integration tests under ui-tests. Packaging: see RELEASE.
License
ipyGraph / Graphbook is source-available, not OSI open source. See LICENSE for the full terms and NOTICE for third-party components.
- Free for individuals and any non-commercial use — development, evaluation, personal projects, academic research, and teaching.
- Free for an organization's internal use up to 20 users (seats).
- A paid commercial license (with a 5% royalty) is required to charge for something built on it, offer it as a hosted/SaaS service, or exceed 20 internal users. Contact anishchelliah.cr@gmail.com to arrange one.
This license covers only this project's own code. JupyterLab, Lumino, React, and other dependencies keep their own licenses (see NOTICE); nothing here changes them.
1 maintainer

Download files
Download the file for your platform. If you're not sure which to choose, learn more about installing packages.
Source Distribution
Built Distribution
Filter files by name, interpreter, ABI, and platform.
If you're not sure about the file name format, learn more about wheel file names.
Copy a direct link to the current filters
File details
Details for the file jupytergraph-1.14.2.tar.gz.
File metadata
- Download URL: jupytergraph-1.14.2.tar.gz
- Upload date:
- Size: 10.9 kB
- Tags: Source
- Uploaded using Trusted Publishing? No
- Uploaded via:
twine/6.2.0 CPython/3.14.3
File hashes
| Algorithm | Hash digest | |
|---|---|---|
| SHA256 |
2d4cc149c2e2896af3a701c09f2c7f1d74d154937f4d90ce4a310ec01b478751
|
|
| MD5 |
b85d4953a8f54b0e37fd476d784ae676
|
|
| BLAKE2b-256 |
0fbcc89b56a4acee493f0756eb824a24296b79926011afd0f9fbfba0ec4142ae
|
File details
Details for the file jupytergraph-1.14.2-py3-none-any.whl.
File metadata
- Download URL: jupytergraph-1.14.2-py3-none-any.whl
- Upload date:
- Size: 15.4 kB
- Tags: Python 3
- Uploaded using Trusted Publishing? No
- Uploaded via:
twine/6.2.0 CPython/3.14.3
File hashes
| Algorithm | Hash digest | |
|---|---|---|
| SHA256 |
7a39b2fff1f0ca8a9652fd78175d0fcf8ef0f8bc5107b64c4792a1f505c9a110
|
|
| MD5 |
1c43e18fb6b68d234b75102a3262bbab
|
|
| BLAKE2b-256 |
e067460628ceaed4db6b1ba70a4b915cd1f076824f2e8ce0ec5b14677ca1aea7
|







