
Rethinking Forecasting Uncertainty via Polar-Based Visualization

Project description
Polar Diagnostics for Forecast Uncertainty











k-diagram provides polar diagnostic plots to evaluate forecast models with an emphasis on uncertainty. It helps you look beyond single metrics and understand where and why models behave as they do.
✨ Why k-diagram?
Key questions it helps answer:
- Forecast uncertainty — Are prediction intervals well calibrated?
- Model drift — Does performance degrade over time or horizon?
- Anomalies — Where do predictions miss, and by how much?
- Patterns — How does accuracy vary across conditions or locations?
The package is designed with applied settings in mind, including environmental forecasting (subsidence, floods, climate impacts), but is general enough for many time-series and geospatial tasks.
📥 Installation
From PyPI (recommended)
pip install k-diagram
This installs k-diagram and the scientific Python stack it depends on (NumPy, Pandas, SciPy, Matplotlib, Seaborn, scikit-learn). Python 3.9+ is supported.
Development install (editable)
If you plan to contribute or run tests locally:
git clone https://github.com/earthai-tech/k-diagram.git
cd k-diagram
pip install -e .[dev]
The [dev] extra installs pytest, coverage, Sphinx, Ruff (Black), and
other developer tools defined in pyproject.toml.
Reproducible dev environment via conda
We ship an environment.yml mirroring our CI setup. It includes
runtime deps plus test and docs tooling.
git clone https://github.com/earthai-tech/k-diagram.git
cd k-diagram
conda env create -f environment.yml
conda activate k-diagram-dev
python -m pip install . --no-deps --force-reinstall
For more detailed instructions, including how to build the documentation locally, please see the full Installation Guide in our documentation.
Tip: Prefer a virtual environment (either
venvorconda) to keep project dependencies isolated.
⚡ Quick Start
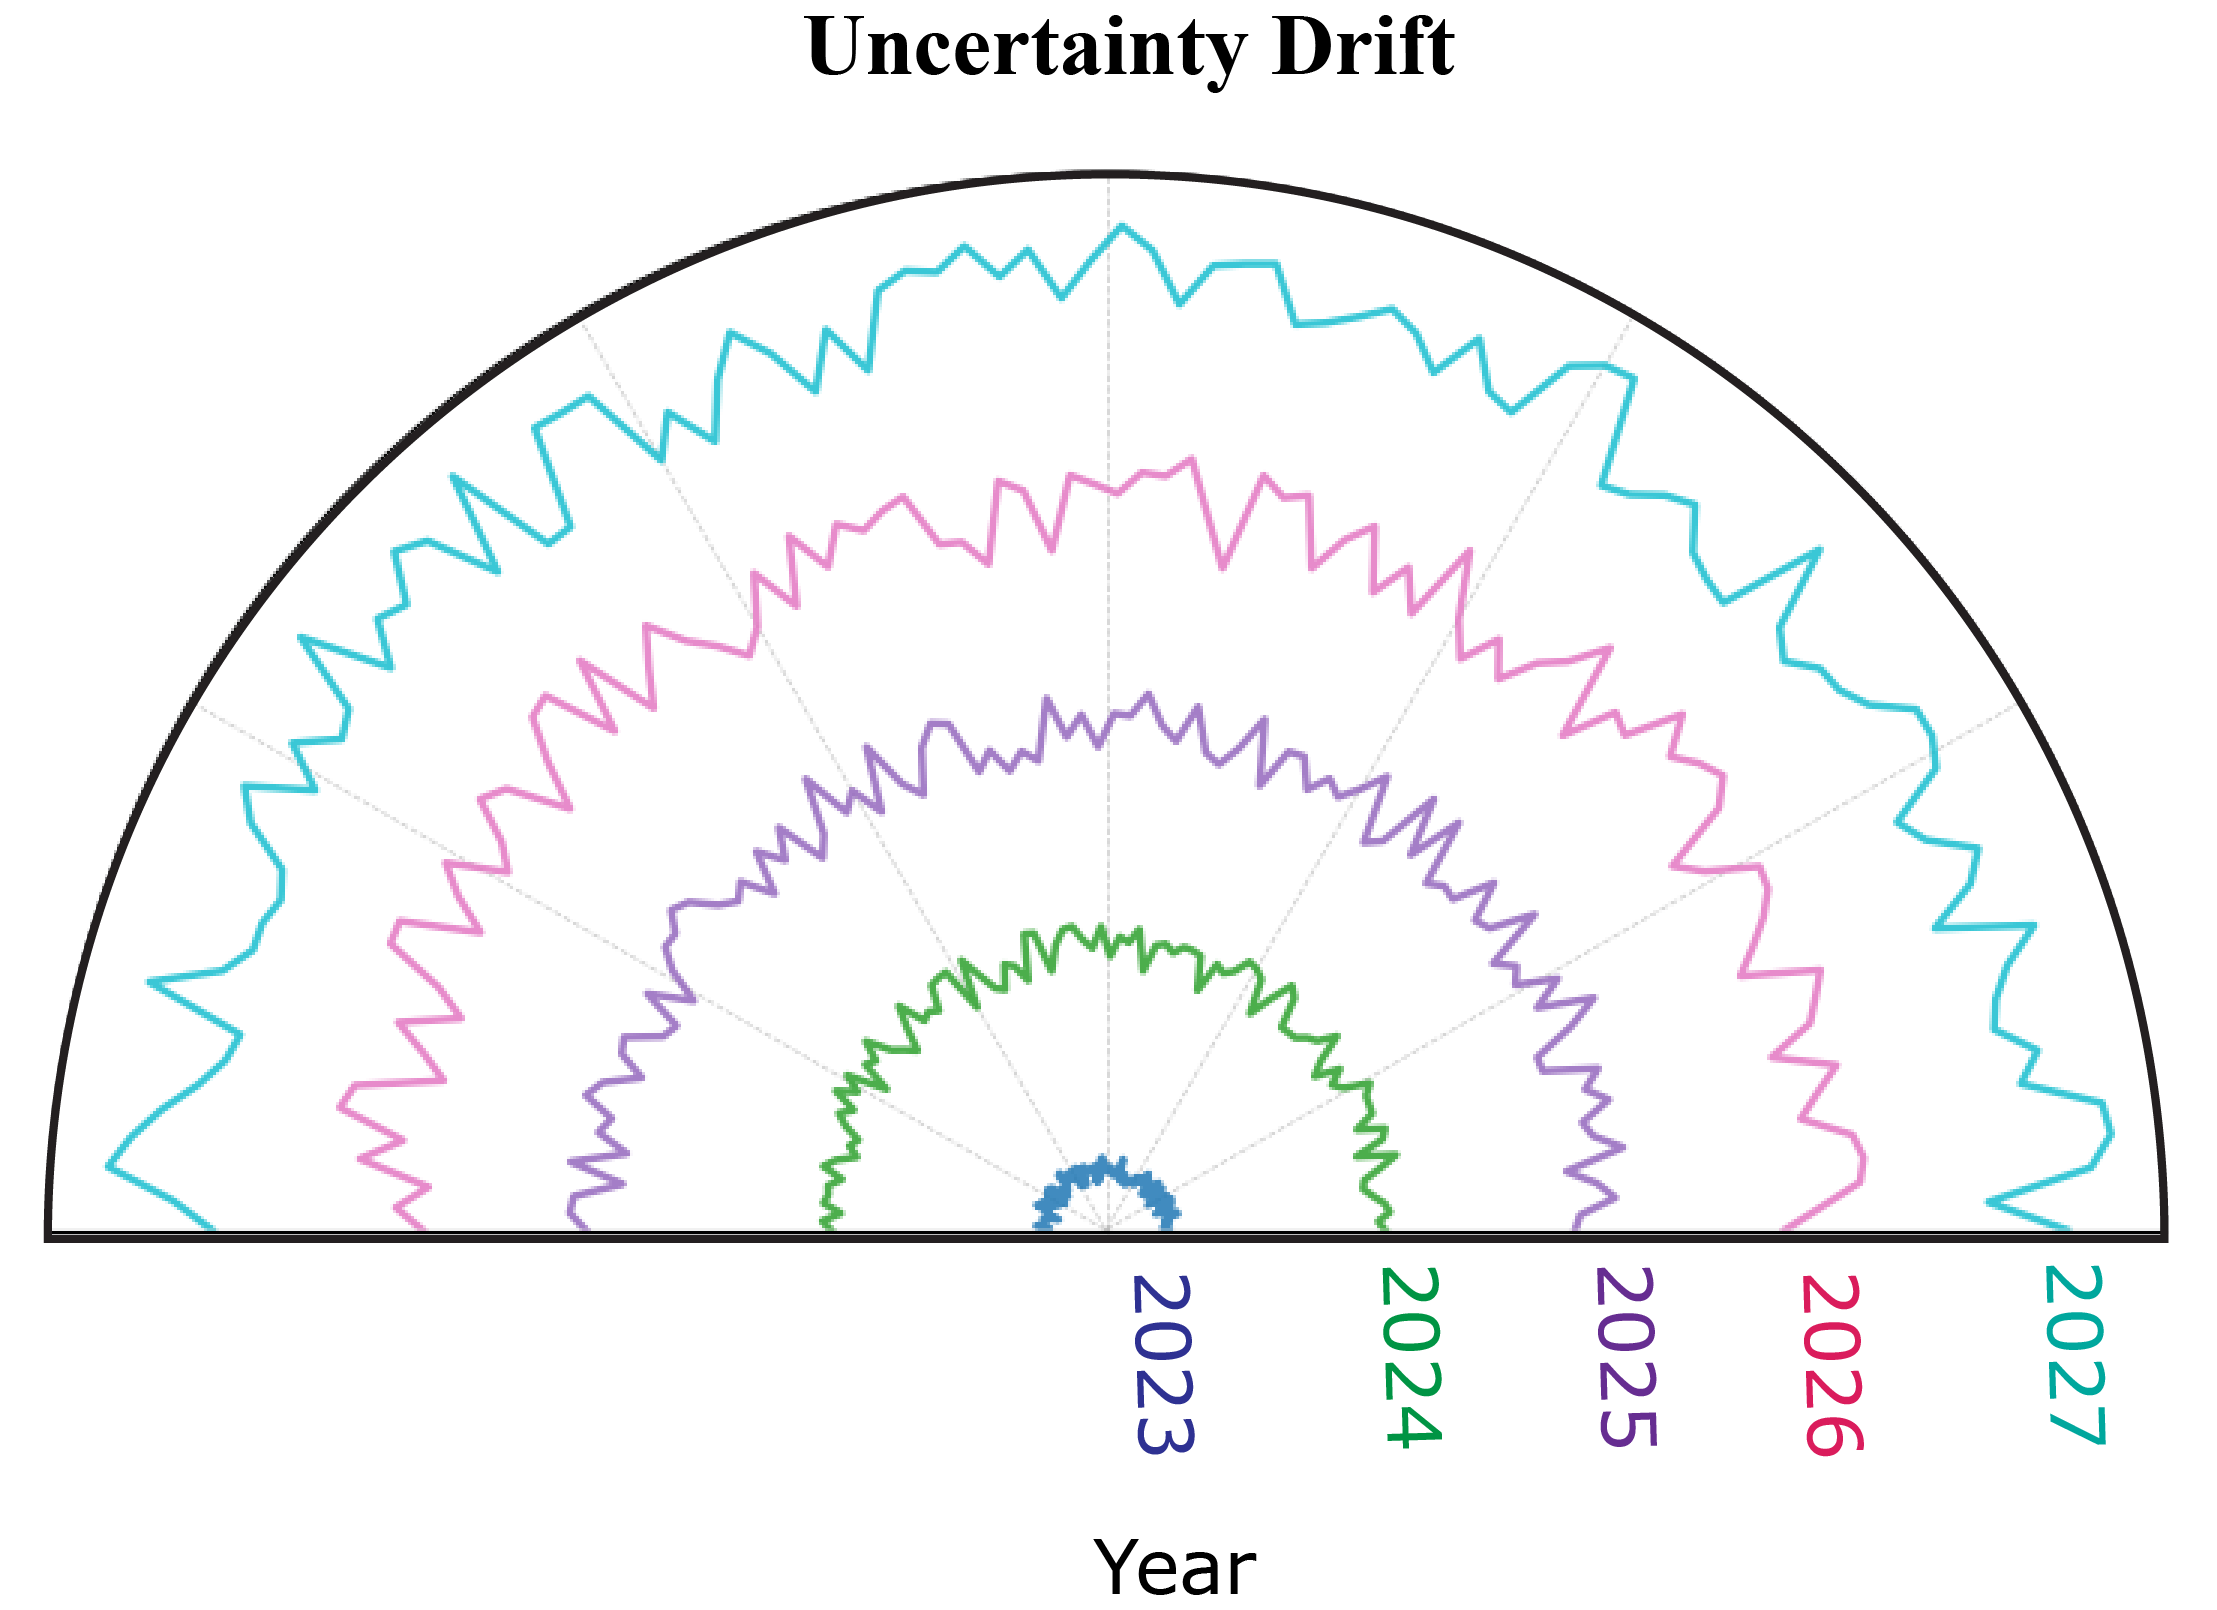
Visualize how the entire spatial pattern of forecast uncertainty evolves
over multiple time steps with plot_uncertainty_drift. This plot uses
concentric rings to represent each forecast period, revealing at a glance
how the "map" of uncertainty changes over time.
# Code Snippet
import kdiagram as kd
# (Requires df with multiple qlow/qup cols like sample_data_drift_uncertainty)
# Example using dummy data generation:
import pandas as pd
import numpy as np
years = range(2023, 2028) # 2028 excluded
N=100
df_drift = pd.DataFrame({'id': range(N)})
qlow_cols, qup_cols = [], []
for i, year in enumerate(years):
   ql, qu = f'q10_{year}', f'q90_{year}'
   qlow_cols.append(ql); qup_cols.append(qu)
   base = np.random.rand(N)*5; width=(np.random.rand(N)+0.5)*(1+i)
   df_drift[ql] = base; df_drift[qu]=base+width

kd.plot_uncertainty_drift(
    df_drift,
    qlow_cols=qlow_cols,
    qup_cols=qup_cols,
    acov="half_circle",
    dt_labels=[str(y) for y in years],
    title='Uncertainty Drift (Interval Width)'
)
📊 Explore the Visualizations
The Quick Start shows just one of the many specialized plots available. The full documentation gallery showcases the complete suite of diagnostic tools. Discover how to:
- Compare Models: Use radar charts to weigh the trade-offs between accuracy, speed, and other metrics.
- Diagnose Reliability: Go beyond accuracy with calibration spirals to see if your probability forecasts are trustworthy.
- Analyze Error Structures: Uncover hidden biases and patterns in your model's mistakes with polar residual plots.
- Understand Feature Effects: Visualize feature importance "fingerprints" and complex two-way feature interactions.
➡️ Explore the Full Gallery
📚 Documentation
For detailed usage, API reference, and more examples, please visit the official documentation:
💻 Using the CLI
k-diagram also provides a command-line interface for generating
plots directly from CSV files.
Check available commands:
k-diagram --help
Example: Generate a Coverage Diagnostic plot:
k-diagram plot-coverage-diagnostic data.csv \
    --actual-col actual_obs \
    --q-cols q10_pred q90_pred \
    --title "Coverage for My Model" \
    --savefig coverage_plot.png
See k-diagram --help for options specific to each plot type).
🙌 Contributing
Contributions are welcome. Please:
- Check the Issues Tracker for existing bugs or ideas.
- Fork the repository.
- Create a new branch for your feature or fix.
- Make your changes and add tests.
- Submit a Pull Request.
Please refer to the CONTRIBUTING page or the contributing section in the documentation for more detailed guidelines.
📜 License
k-diagram is distributed under the terms of the Apache License 2.0.
See the LICENSE
file for details.
📞 Contact & Support
-
Bug reports & feature requests: Please use the project’s GitHub Issues tracker to report bugs, ask usage questions, or suggest enhancements: GitHub Issues
-
Author contact: For collaboration inquiries or questions about the project’s background, you can contact the author:
Laurent Kouadio — https://lkouadio.com/ 📧 etanoyau@gmail.com


Download files
Download the file for your platform. If you're not sure which to choose, learn more about installing packages.
Source Distribution
Built Distribution
Filter files by name, interpreter, ABI, and platform.
If you're not sure about the file name format, learn more about wheel file names.
Copy a direct link to the current filters
File details
Details for the file k_diagram-1.4.3.tar.gz.
File metadata
- Download URL: k_diagram-1.4.3.tar.gz
- Upload date:
- Size: 4.5 MB
- Tags: Source
- Uploaded using Trusted Publishing? No
- Uploaded via: twine/6.1.0 CPython/3.13.12
File hashes
| Algorithm | Hash digest | |
|---|---|---|
| SHA256 |
99065c307e9302fe7115956e2a5ea5fe7ee8746361a4c66f55e80ad239f14a37
|
|
| MD5 |
e6b73c6d749478d7850c237aa5759d14
|
|
| BLAKE2b-256 |
25455225bf3173f147c893a940dd8c06d9ab5f3aa3c89acc6310e7df3d5efa16
|
File details
Details for the file k_diagram-1.4.3-py3-none-any.whl.
File metadata
- Download URL: k_diagram-1.4.3-py3-none-any.whl
- Upload date:
- Size: 535.4 kB
- Tags: Python 3
- Uploaded using Trusted Publishing? No
- Uploaded via: twine/6.1.0 CPython/3.13.12
File hashes
| Algorithm | Hash digest | |
|---|---|---|
| SHA256 |
dbf85dec0cd0ba4cbaa3ff0c00d204f92c93dc41d8dc55597bd0cb019a29739f
|
|
| MD5 |
cbdf67a67abbb4fafb31d7fb583b0dee
|
|
| BLAKE2b-256 |
9dcbbb35d9e0f5716028f4e7ff61a02aad580e6ab99fe6293ed1b0c218e098b0
|






