Package to mimic the functionality of KaryoploteR, but in Python.

Project description
karyopyploter


Table of Contents
Acknowledgements
This project was based on the work by @Adoni5 and his repository pyryotype. It was made to provide similar functionality to what is being offered by KaryoploteR package, but in a more pythonic style, using Matplotlib as the basis, and giving the user full liberty to plot anything they want.
Installation
pip install karyopyploter
Example usage
from karyopyploter import (
GENOME,
plot_ideogram,
make_ideogram_grid,
make_genome_grid,
annotate_ideogram,
add_ideogram_coordinates,
reset_coordinates,
zoom,
)
from matplotlib import pyplot as plt
from itertools import chain
from pathlib import Path
OUT_DIR = Path(__file__).parent.parent / "example_outputs" / "readme_example"
OUT_DIR.mkdir(parents=True, exist_ok=True)
genome = GENOME.CHM13
fig, axes = plt.subplots(
ncols=1,
nrows=22,
figsize=(11, 11),
facecolor="white",
)
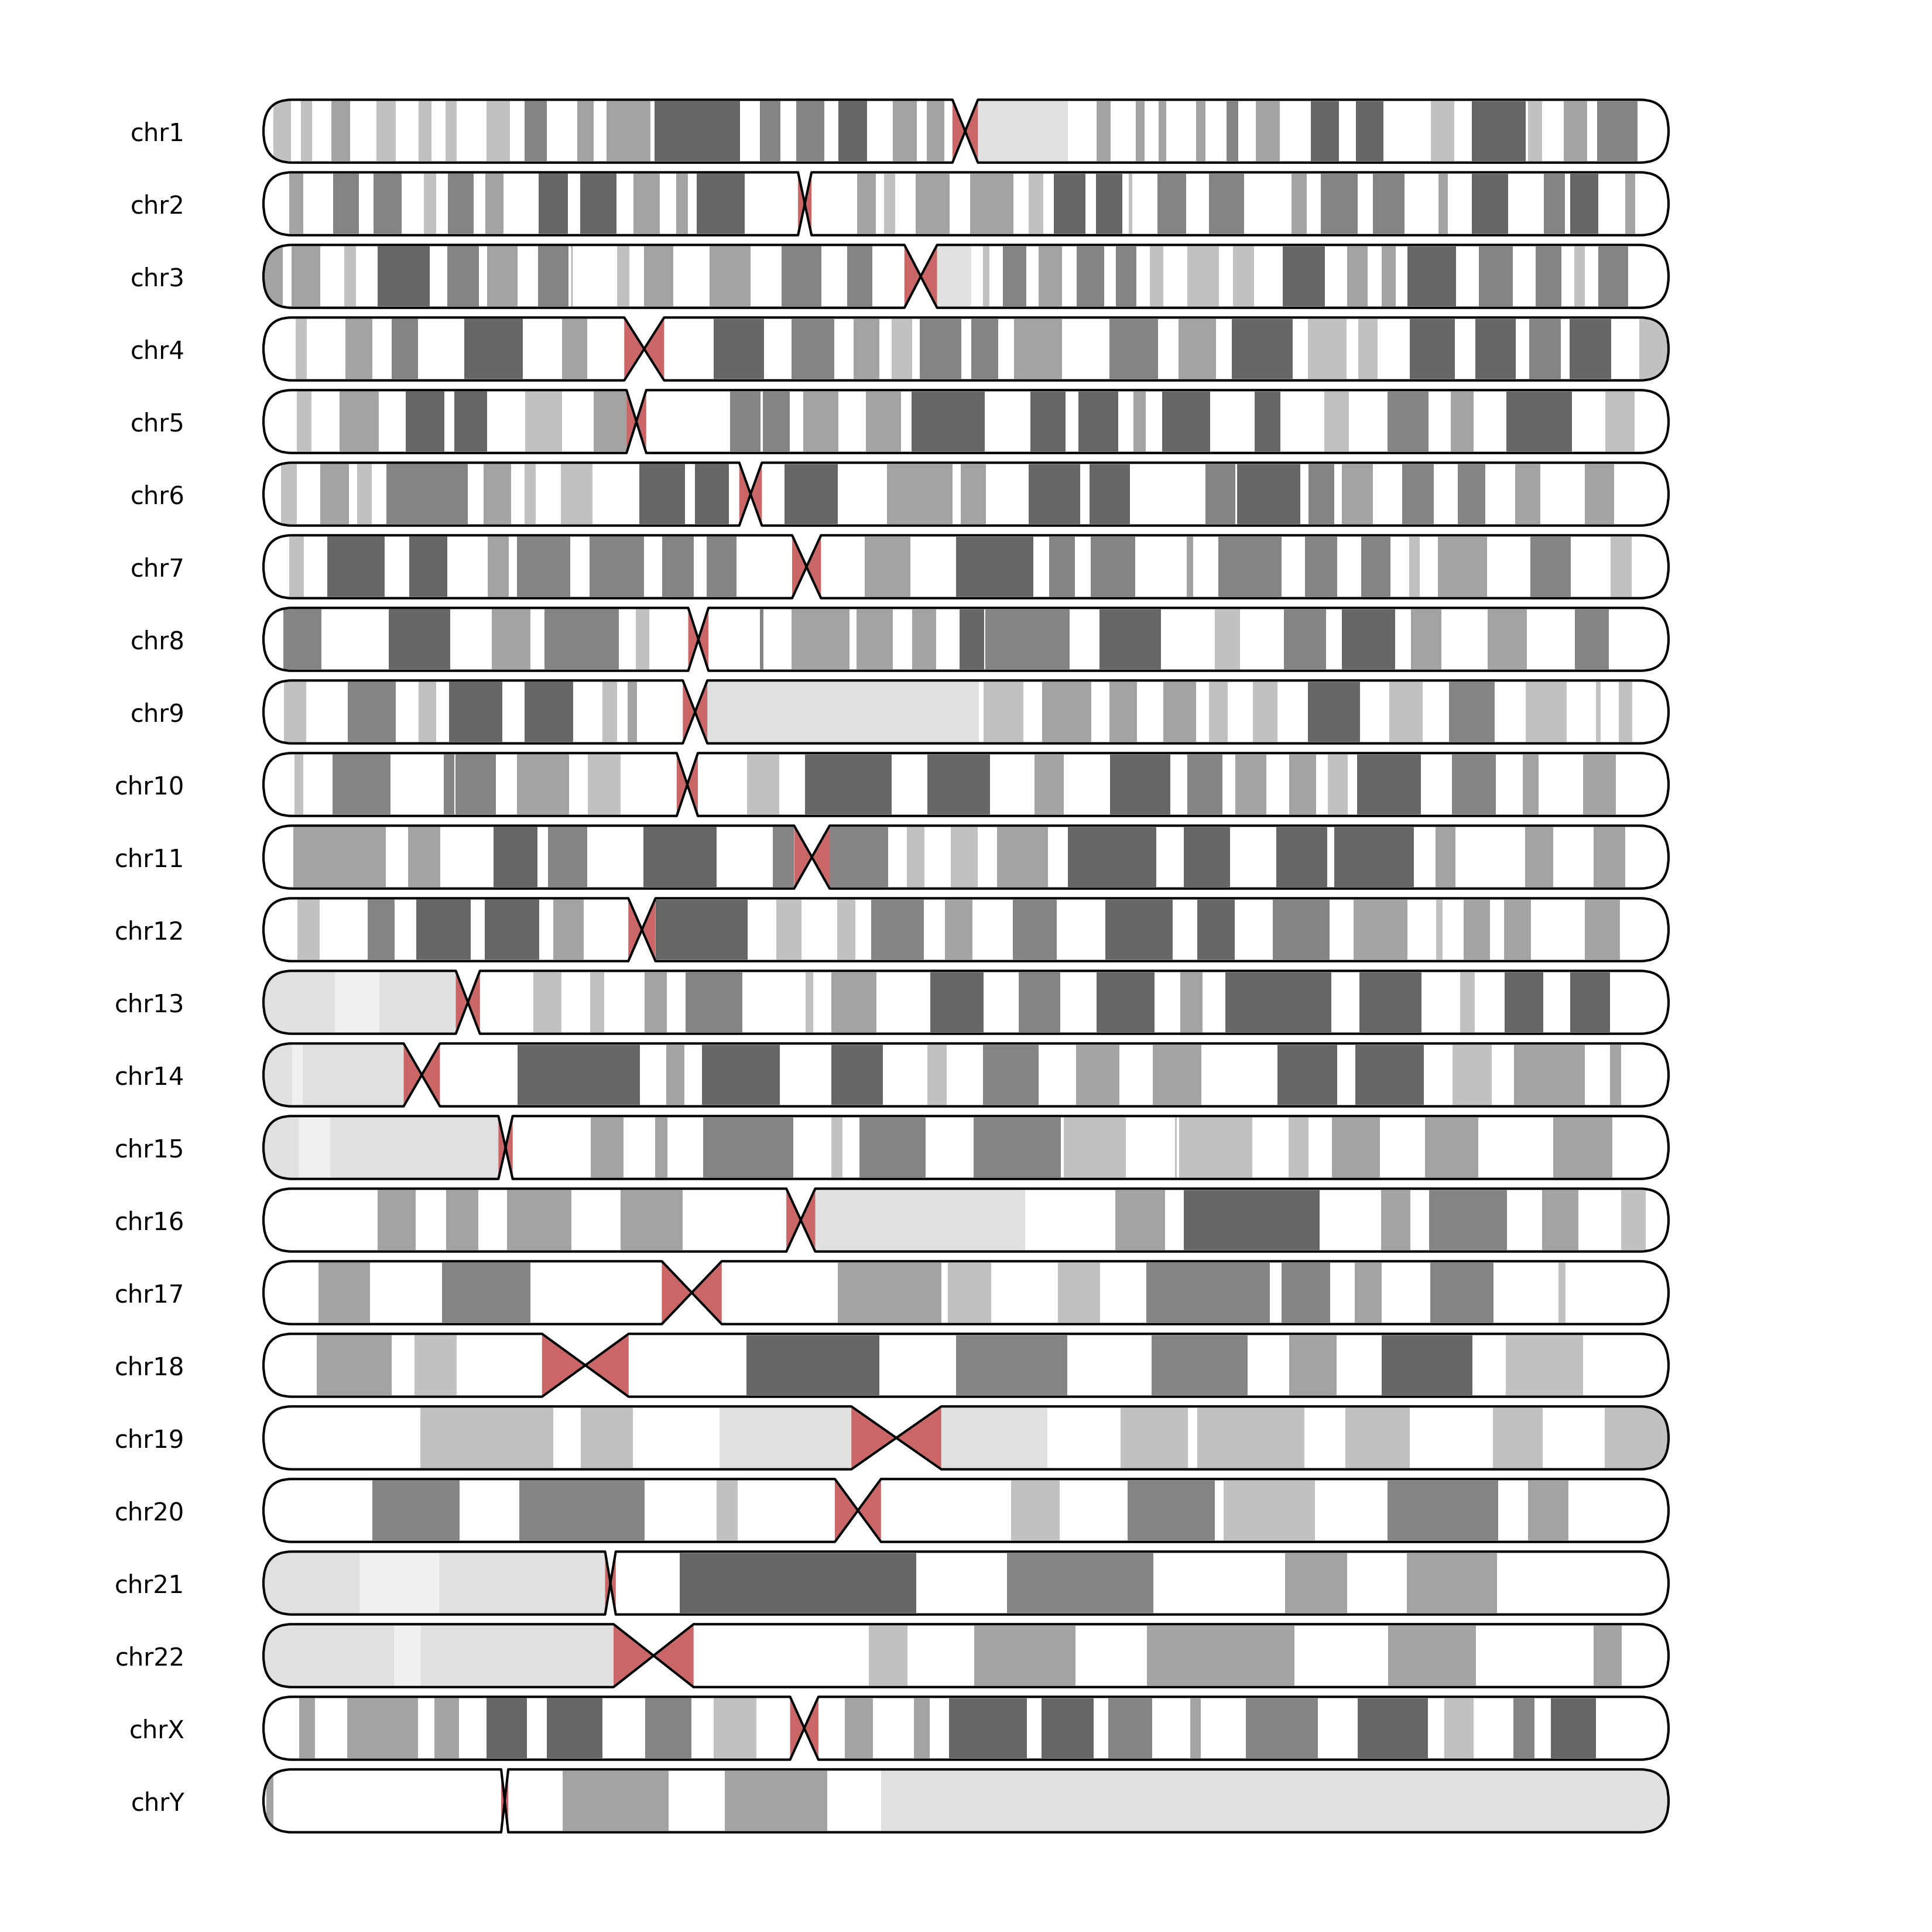
for ax, contig_name in zip(axes, [f"chr{i}" for i in chain(range(1, 23), "XY")]):
chromosome = contig_name
plot_ideogram(ax, target=chromosome, genome=genome, label=contig_name)
# similar to:
fig = plt.figure(figsize=(11, 11), facecolor="white")
fig, _, ideogram_axes = make_ideogram_grid(
target=[f"chr{contig_name}" for contig_name in chain(range(1, 23), "XY")],
num_subplots=0,
genome=genome,
fig=fig,
)
fig.savefig(TEST_DIR / "ideogram_grid1.png", dpi=300)
Will output:
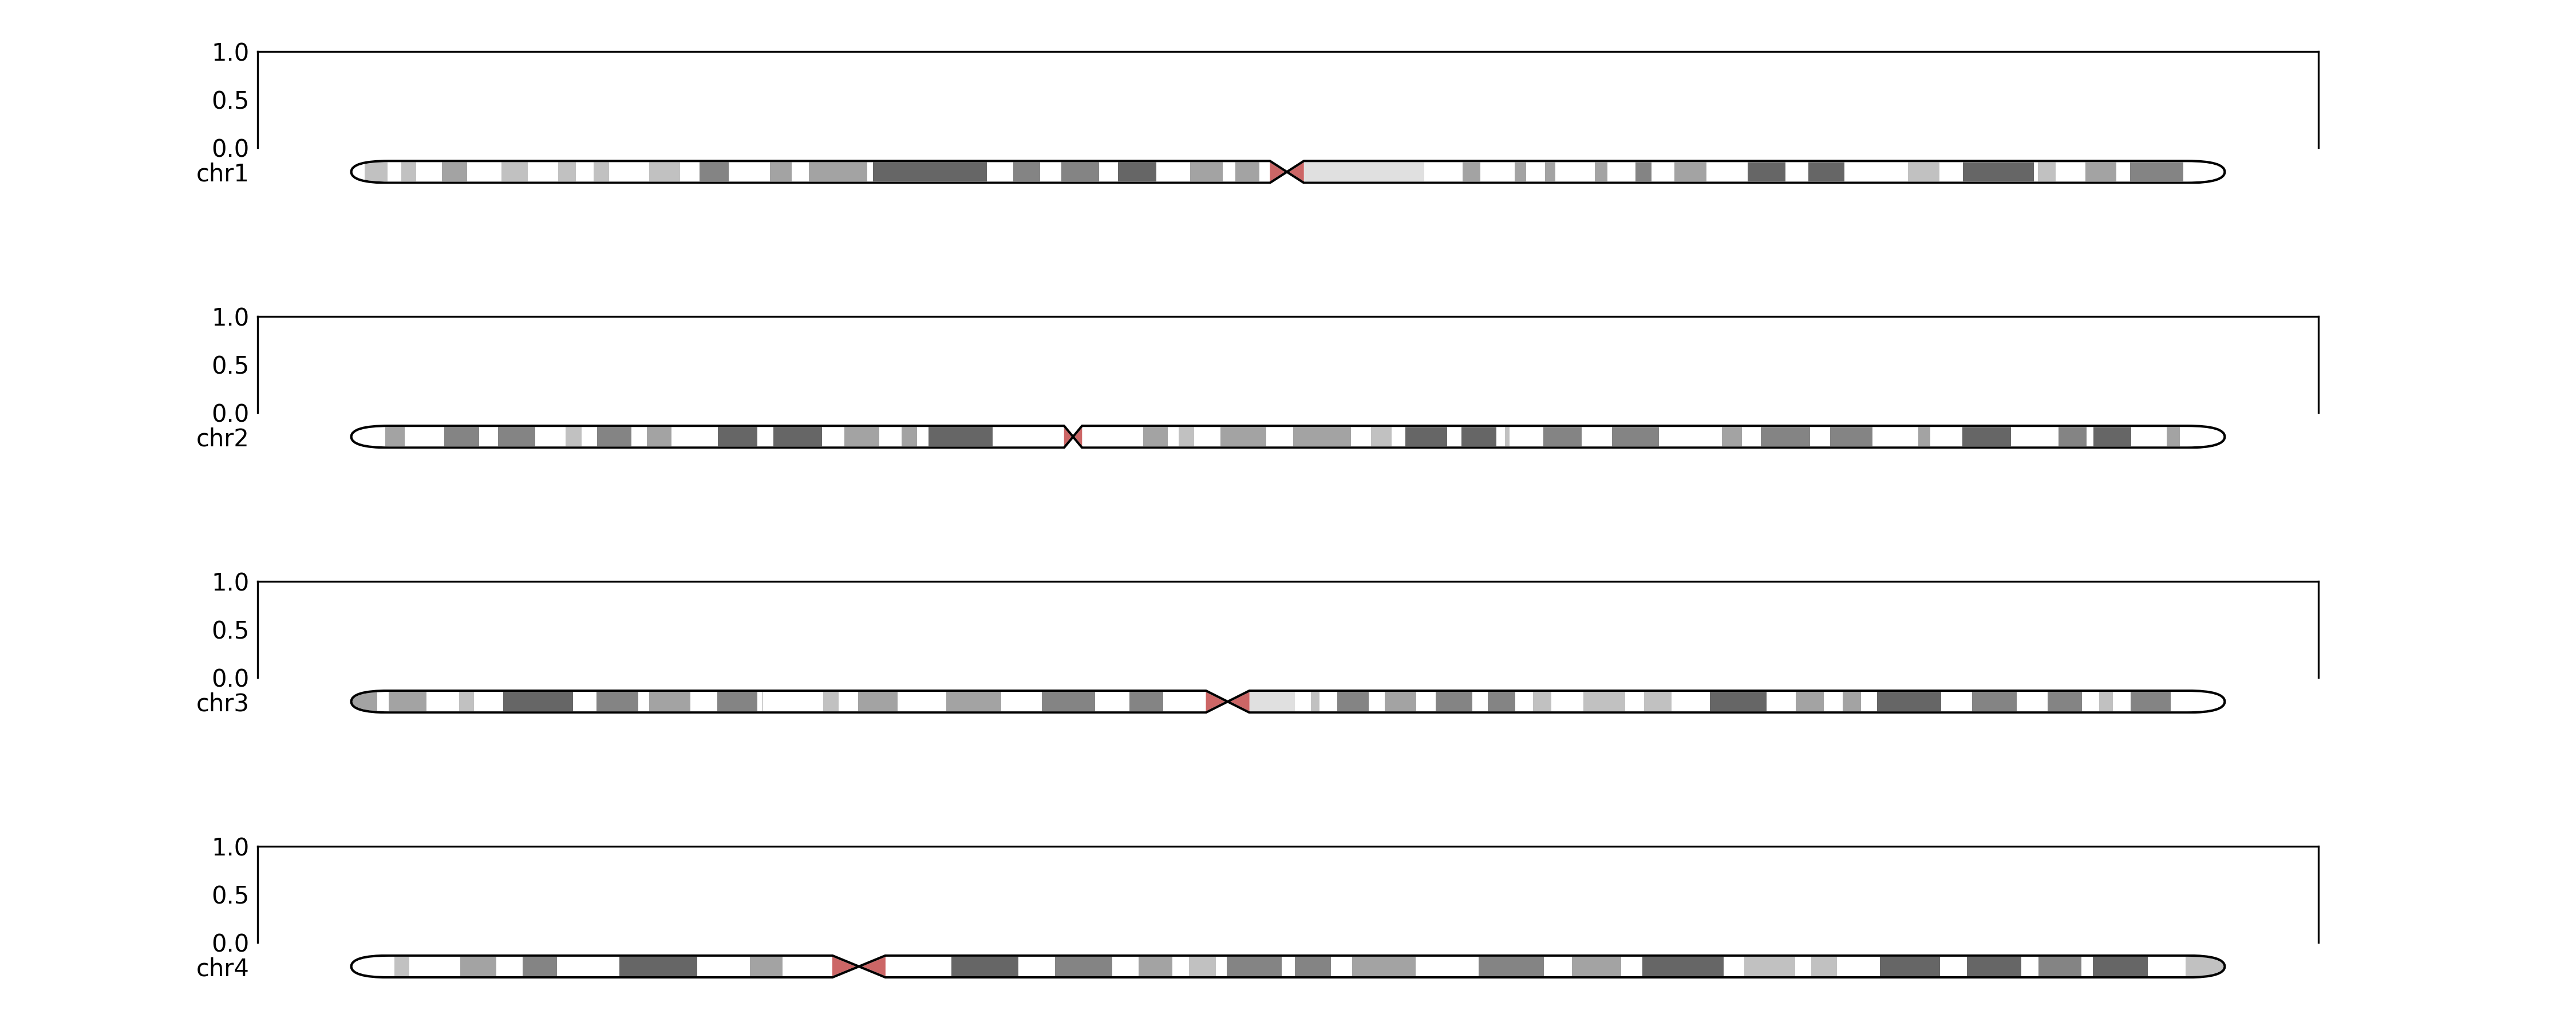
# and with a subplots grid
fig, ax, ideogram_axes = make_ideogram_grid(
        subplot_width=15,
        grid_params=dict(hspace=1),
        ideogram_factor=0.3,
        target=[f"chr{contig_name}" for contig_name in chain(range(1, 5))],
        num_subplots=1,
        genome=genome,
    )
fig.savefig(TEST_DIR / "ideogram_grid2.png", dpi=300)
Will output:
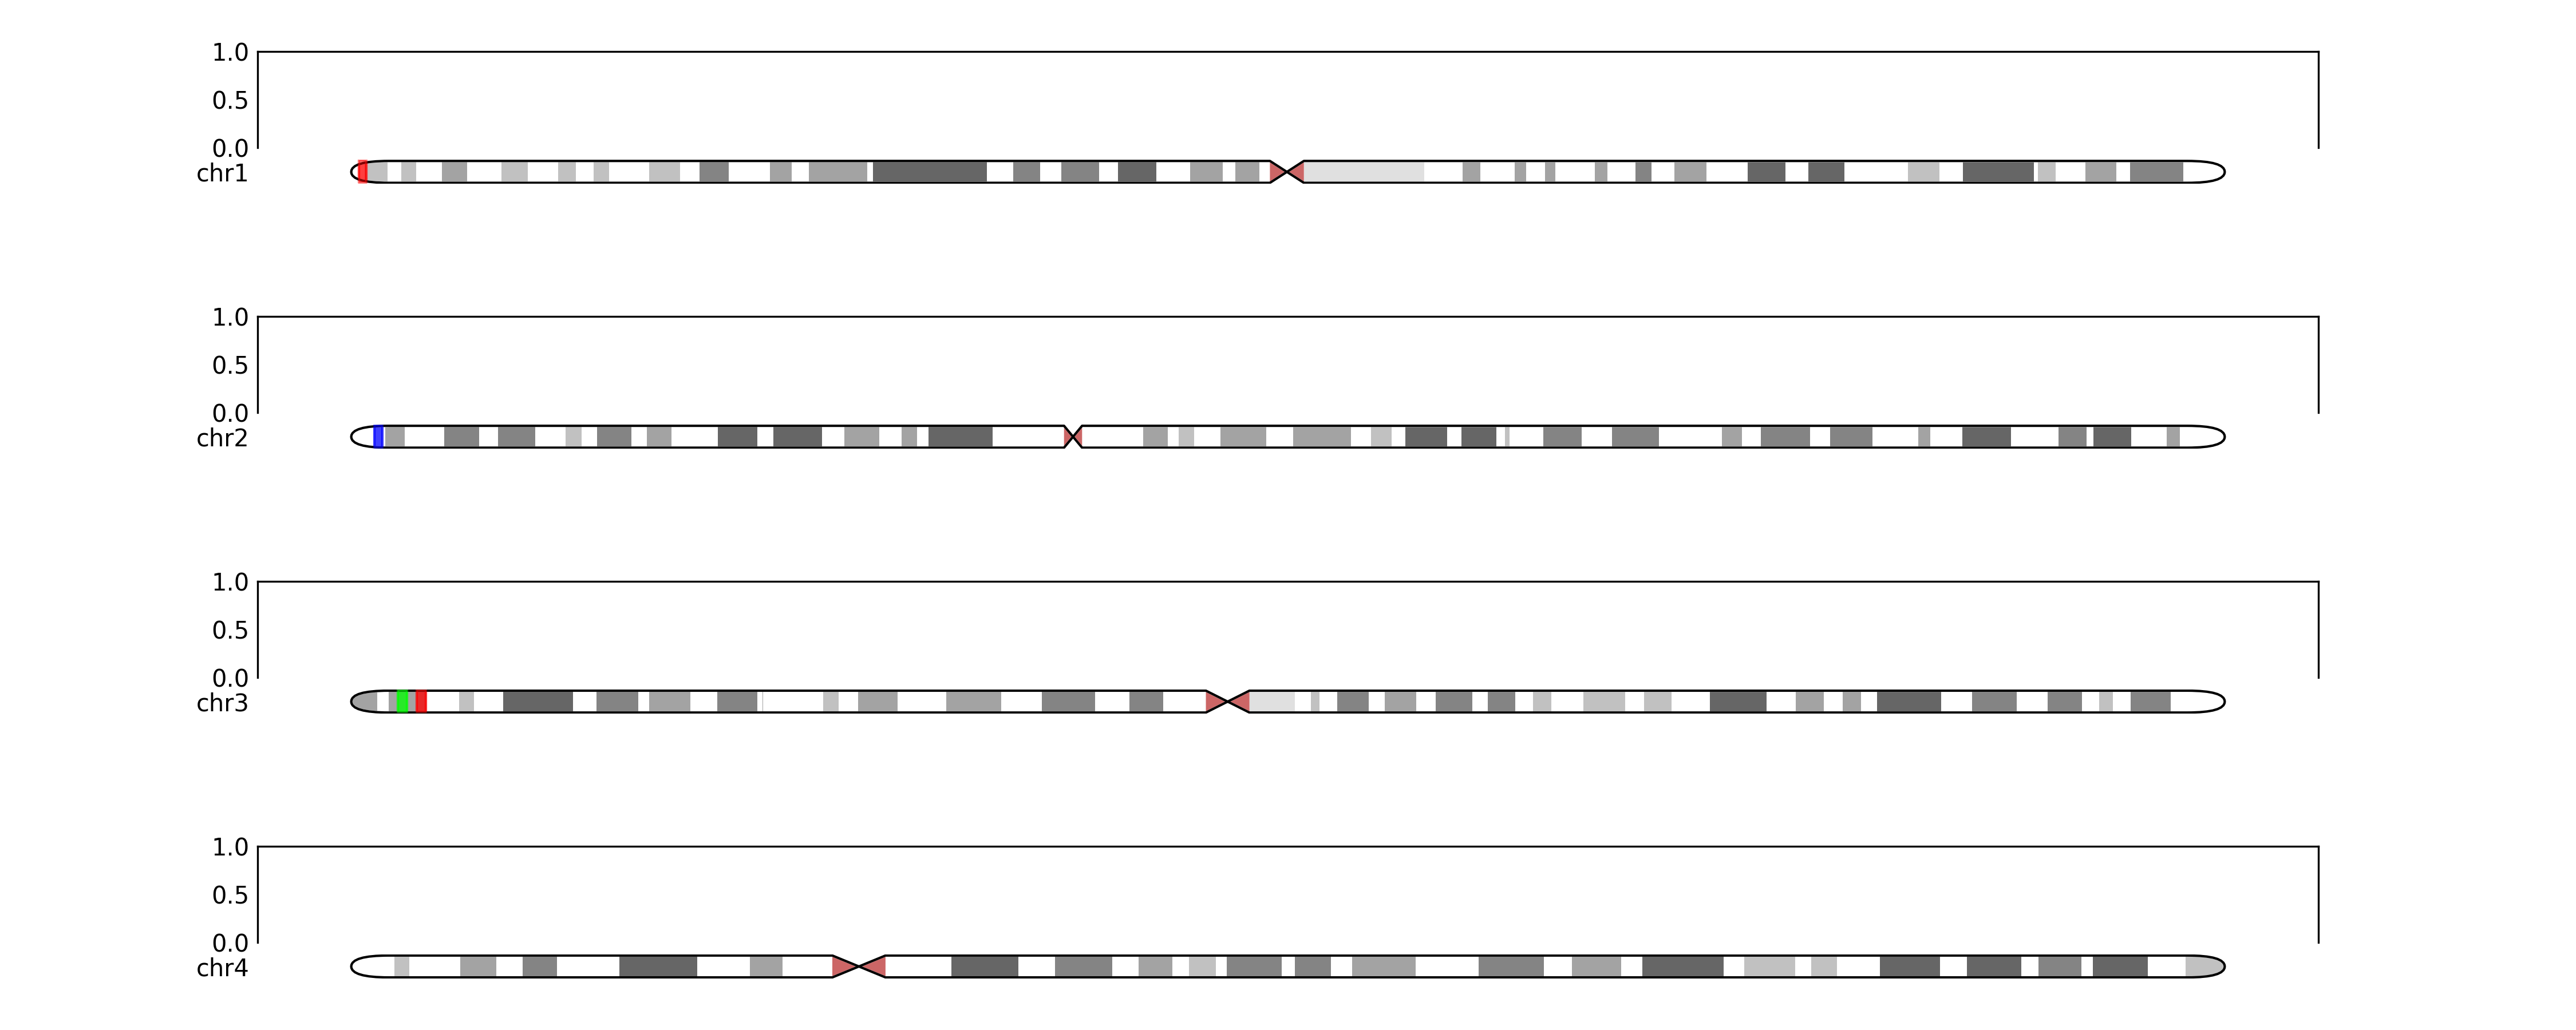
# and with some regions annotated
regions = {'chr1':[(1000000,2000000, "red")], 'chr2':[(3000000, 4000000, 'blue')], 'chr3':[(5000000,6000000, (0,1,0)), (7000000,8000000, (1,0,0))]}
for chr in regions:
        annotate_ideogram(ideogram_axes[chr], regions=regions[chr], genome=genome)
fig.savefig(TEST_DIR / "ideogram_grid3.png", dpi=300)
Will output:
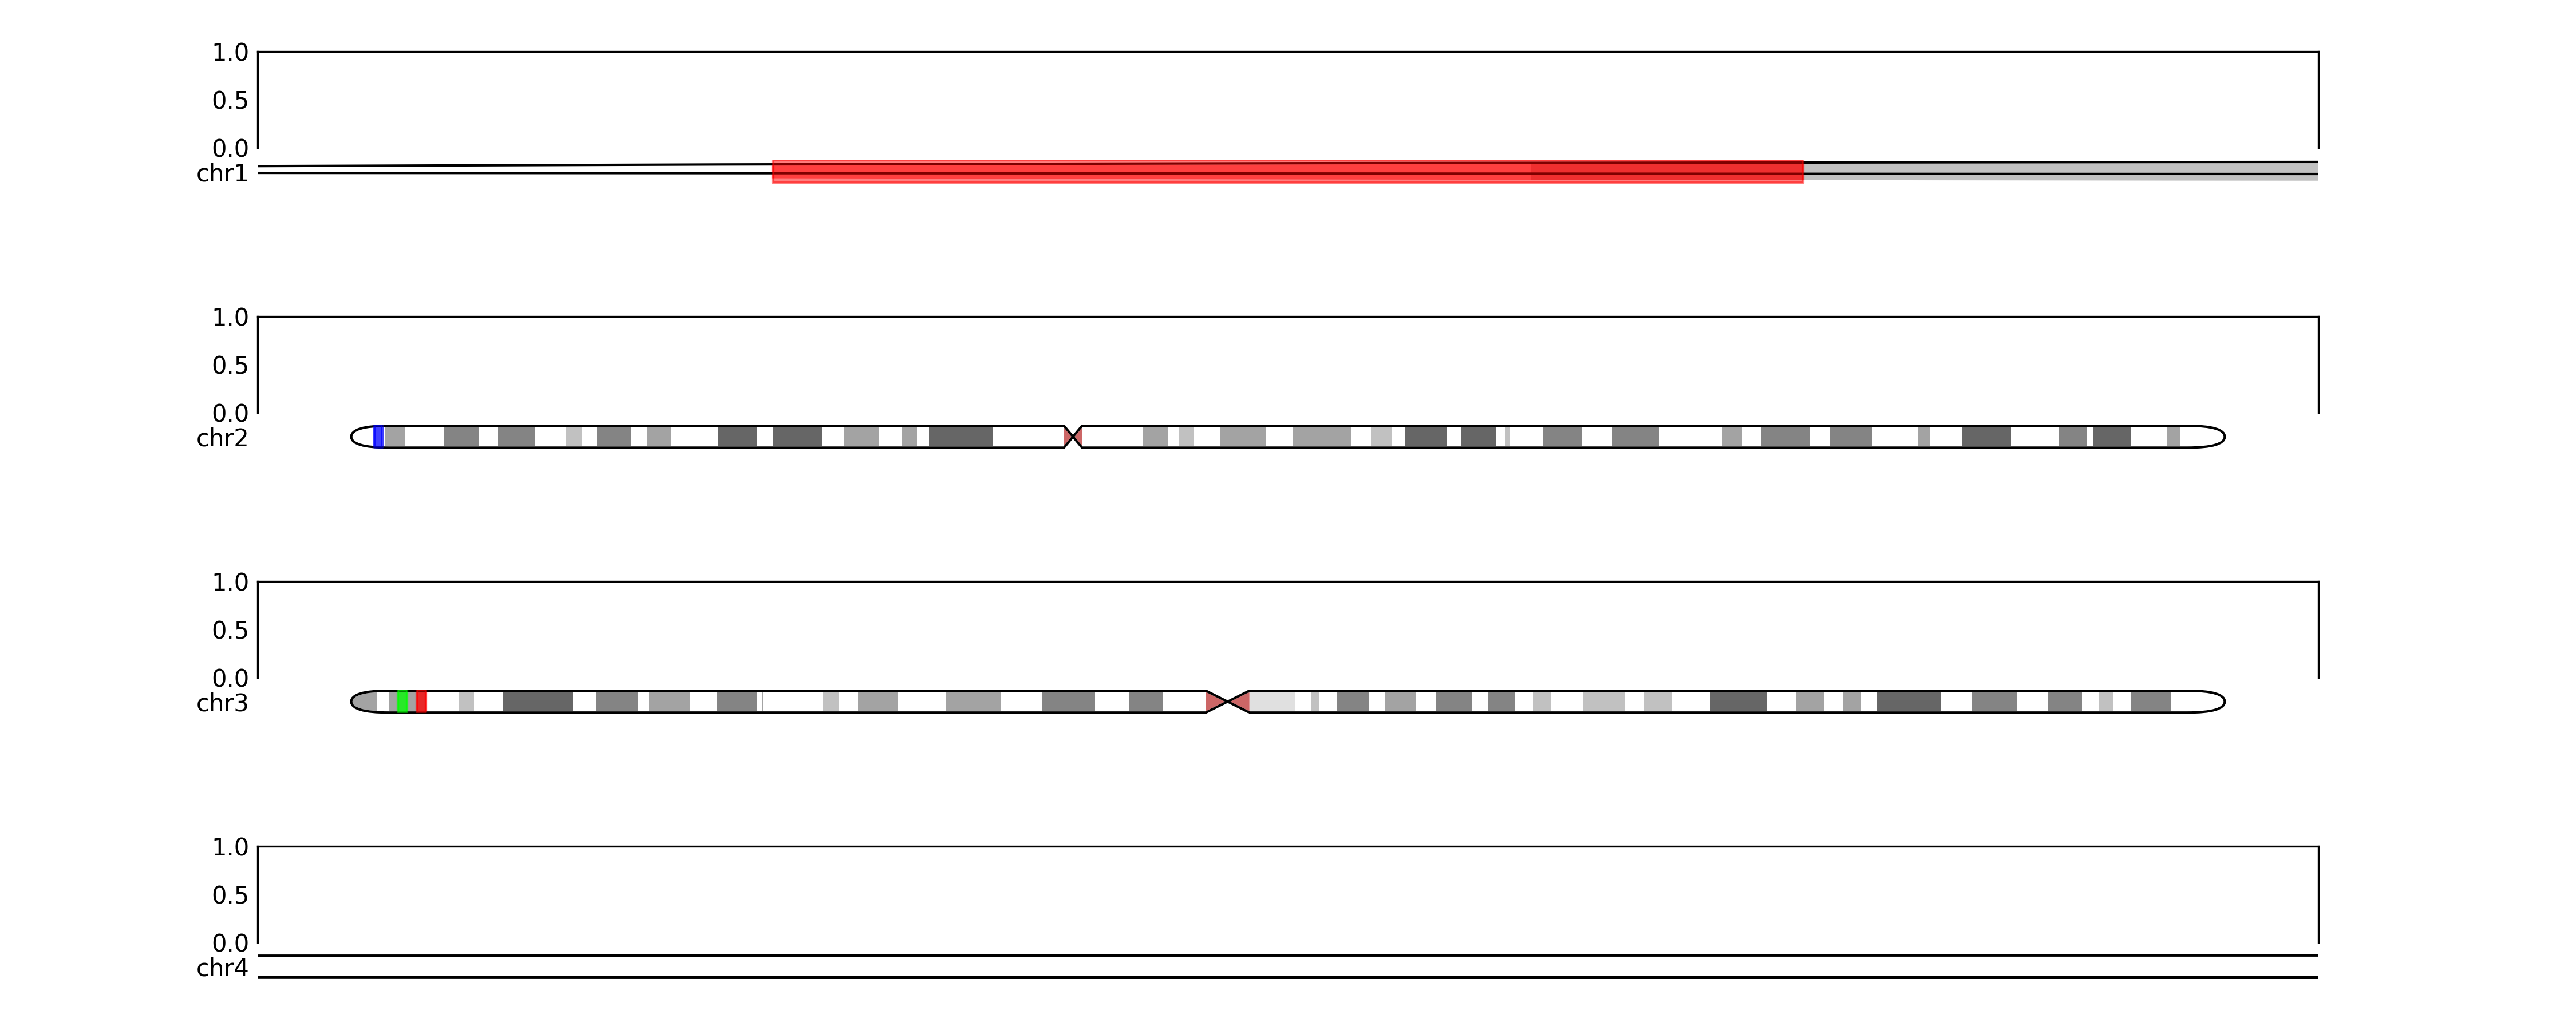
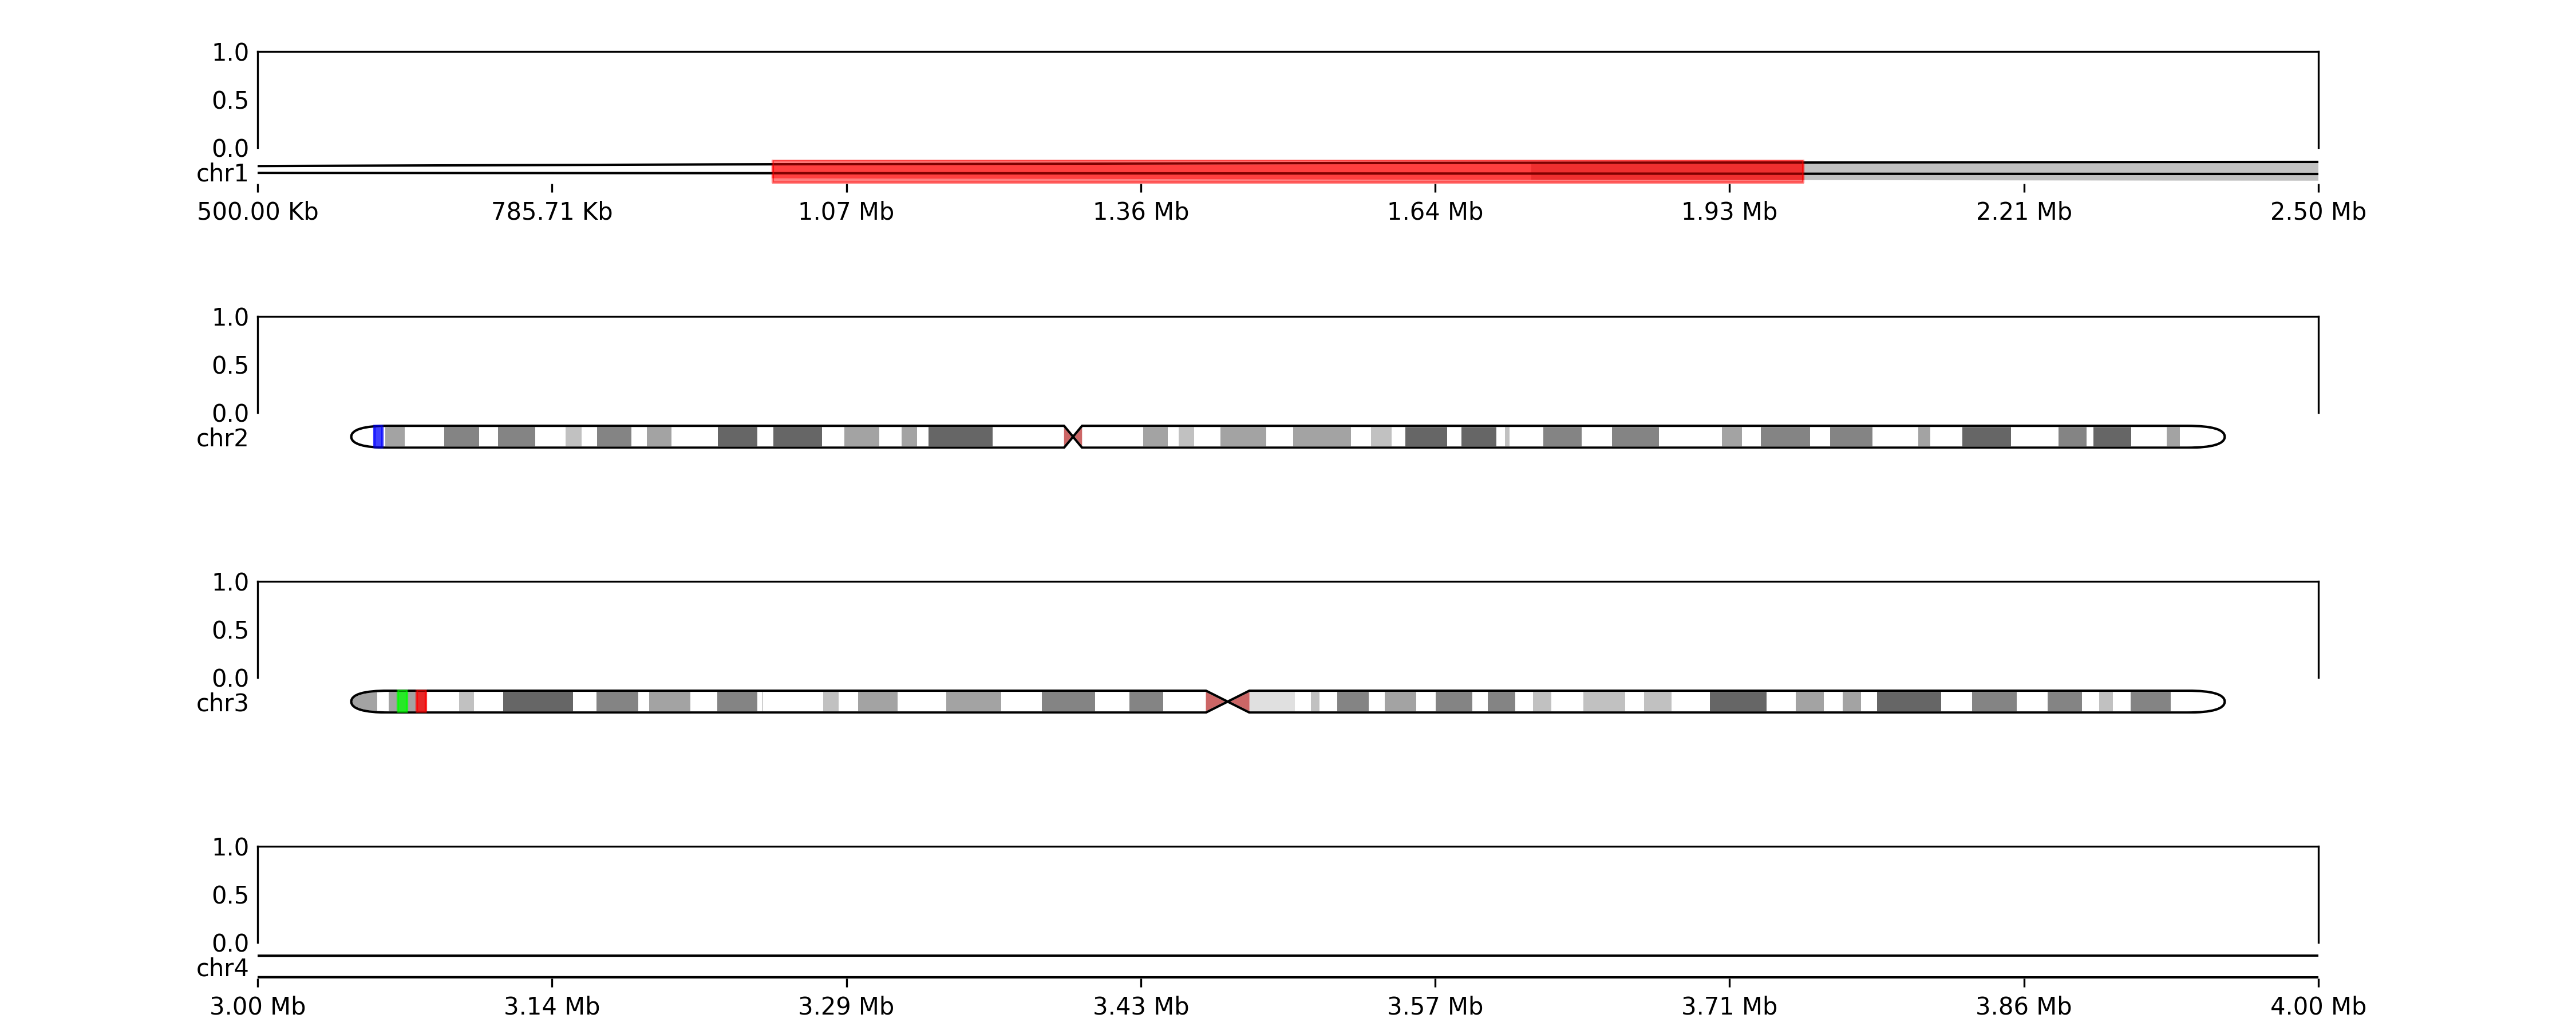
# maybe we want to zoom in on specific regions
zoom_regions = {'chr1': (500000, 2500000), 'chr4': (3000000, 4000000)}
    for chr in zoom_regions:
        zoom(ideogram_axes[chr], start=zoom_regions[chr][0], stop=zoom_regions[chr][1])
fig.savefig(OUT_DIR / "ideogram_grid4.png", dpi=300)
Will output:
# or we want to show coordinates
for chr in zoom_regions:
    add_ideogram_coordinates(ideogram_axes[chr])
    reset_coordinates(ax[chr], ideogram_axes[chr])
fig.savefig(TEST_DIR / "ideogram_grid5.png", dpi=300)
Will output:
TODOs
- Investigate the creation of circos plots, by polar transformation.
- Provide more detailed documentation, as some features are not described
License
karyopyploter is distributed under the terms of the BSD-3-Clause license. Feel free to use in both academic and commercial applications, and please consider to cite the software in your work.
Cytoband data
- HG38
- HG19
- CHM13


Download files
Download the file for your platform. If you're not sure which to choose, learn more about installing packages.
Source Distribution
Built Distribution
Filter files by name, interpreter, ABI, and platform.
If you're not sure about the file name format, learn more about wheel file names.
Copy a direct link to the current filters
File details
Details for the file karyopyploter-0.2.0.tar.gz.
File metadata
- Download URL: karyopyploter-0.2.0.tar.gz
- Upload date:
- Size: 1.8 MB
- Tags: Source
- Uploaded using Trusted Publishing? No
- Uploaded via: twine/6.1.0 CPython/3.10.17
File hashes
| Algorithm | Hash digest | |
|---|---|---|
| SHA256 |
39ea71a85eec17ad777779a1219ed3be42546998145f4772a1f4016d5574beb9
|
|
| MD5 |
fdb5eabde1eb18db789b0e0ba1febda2
|
|
| BLAKE2b-256 |
ad3c063bb969c698bb2425d18b70978a92ce1ff2dbe6162bf44e9e11bf541e46
|
File details
Details for the file karyopyploter-0.2.0-py3-none-any.whl.
File metadata
- Download URL: karyopyploter-0.2.0-py3-none-any.whl
- Upload date:
- Size: 36.3 kB
- Tags: Python 3
- Uploaded using Trusted Publishing? No
- Uploaded via: twine/6.1.0 CPython/3.10.17
File hashes
| Algorithm | Hash digest | |
|---|---|---|
| SHA256 |
9d7e97f5ac45bb68ea44856533092e9531d30c303614a60ec2c836614f18400f
|
|
| MD5 |
31f341a66390627fcd334cac288a89fb
|
|
| BLAKE2b-256 |
96194e999f4d185cb75413c929b138fda8a19aaed6b1ad36eeee1aab6a068c19
|


