Çeşitli graf kütüphaneleri için sıralı-zigzag yerleşimleri sağlayan bir Python paketi.
Verified details
These details have been verified by PyPIProject links
GitHub Statistics
Maintainers

Project description
KececiLayout


| Documentation | Paper |
|---|---|
 |
|
🌐 English
Kececi Layout (Keçeci Yerleşimi)
KececiLayout is a deterministic graph layout algorithm designed for visualizing linear or sequential structures with a characteristic "zig-zag" or "serpentine" pattern.
Python implementation of the Keçeci layout algorithm for graph visualization.
Description
This algorithm arranges nodes sequentially along a primary axis and offsets them alternately along a secondary axis. It's particularly useful for path graphs, chains, or showing progression.
Key Features:
- Linear Focus: Ideal for visualizing paths, chains, or ordered processes.
- Deterministic: Produces identical results for the same input.
- Overlap Reduction: Prevents node collisions by spreading them across axes.
- Parametric: Fully customizable with parameters like
primary_spacing,secondary_spacing,primary_direction, andsecondary_start.
=> v0.2.7: Curved, transparent, 3D, and expanding=True styles supported.
Installation
conda install bilgi::kececilayout -y
pip install kececilayout
Usage
Example with NetworkX
import networkx as nx
import matplotlib.pyplot as plt
import kececilayout as kl

G = nx.path_graph(10)
pos = kl.kececi_layout_v4(
    G,
    primary_spacing=1.0,
    secondary_spacing=0.5,
    primary_direction='top-down',
    secondary_start='right'
)

plt.figure(figsize=(6, 8))
nx.draw(G, pos=pos, with_labels=True, node_color='skyblue', node_size=500)
plt.title("Kececi Layout with NetworkX")
plt.axis('equal')
plt.show()
Example with iGraph
import igraph as ig
import matplotlib.pyplot as plt
from kececilayout import kececi_layout_v4_igraph

G = ig.Graph.Ring(10, circular=False)
pos_list = kececi_layout_v4_igraph(G, primary_direction='left-to-right', secondary_start='up')
layout = ig.Layout(pos_list)

fig, ax = plt.subplots(figsize=(8, 6))
ig.plot(G, target=ax, layout=layout, vertex_label=[f"N{i}" for i in range(10)])
ax.set_aspect('equal')
plt.show()
Example with RustworkX
import rustworkx as rx
import kececilayout as kl
import matplotlib.pyplot as plt

G = rx.generators.path_graph(10)
pos = kl.kececi_layout_v4(G, primary_direction='bottom-up')
# Use matplotlib for drawing (see full example in repo)
Example with Networkit
import networkit as nk
import kececilayout as kl
import matplotlib.pyplot as plt

G = nk.graph.Graph(10)
for i in range(9):
    G.addEdge(i, i+1)
pos = kl.kececi_layout_v4(G)
# Draw with matplotlib
Example with Graphillion
import graphillion as gg
import kececilayout as kl
import matplotlib.pyplot as plt

universe = [(i, i+1) for i in range(1, 10)]
gg.GraphSet.set_universe(universe)
gs = gg.GraphSet()
pos = kl.kececi_layout_v4(gs)
# Draw with matplotlib
Supported Backends
- NetworkX
- igraph
- Rustworkx
- Networkit
- Graphillion
Note: All backends are supported via unified kececi_layout_v4 function.
Advanced Drawing Styles
Use draw_kececi for enhanced visualizations:
kl.draw_kececi(G, style='curved')        # Smooth curved edges
kl.draw_kececi(G, style='transparent')   # Opacity based on edge length
kl.draw_kececi(G, style='3d')            # 3D helix layout
License
MIT License. See LICENSE for details.
Citation
If this library was useful in your research, please cite:
@misc{kececi_2025_15313946,
  author       = {Keçeci, Mehmet},
  title        = {kececilayout},
  month        = may,
  year         = 2025,
  publisher    = {Zenodo},
  version      = {0.2.7},
  doi          = {10.5281/zenodo.15313946},
  url          = {https://doi.org/10.5281/zenodo.15313946}
}
🇹🇷 Türkçe
Keçeci Yerleşimi (Kececi Layout)
KececiLayout, doğrusal veya ardışık yapıları görselleştirmek için tasarlanmış, karakteristik bir "zıgzag" veya "yılanvari" desen oluşturan deterministik bir graf yerleşim algoritmasıdır.
Graf görselleştirme için Keçeci yerleşim algoritmasının Python uygulaması.
Açıklama
Bu algoritma, düğümleri birincil eksen boyunca sıralı olarak yerleştirir ve ikincil eksen boyunca dönüşümlü olarak kaydırır. Yol grafları, zincirler veya ilerlemeyi göstermek için özellikle kullanışlıdır.
Temel Özellikler:
- Doğrusal Odak: Yollar, zincirler veya sıralı süreçler için idealdir.
- Deterministik: Aynı giriş için her zaman aynı çıktıyı üretir.
- Çakışmayı Azaltma: Düğümleri eksenler boyunca yayarak çakışmaları önler.
- Parametrik:
primary_spacing,secondary_spacing,primary_direction,secondary_startgibi parametrelerle özelleştirilebilir.
=> v0.2.7: Eğri, şeffaf, 3B ve expanding=True stilleri desteklenir.
Kurulum
conda install bilgi::kececilayout -y
pip install kececilayout
Kullanım
NetworkX ile Örnek
import networkx as nx
import matplotlib.pyplot as plt
import kececilayout as kl

G = nx.path_graph(10)
pos = kl.kececi_layout_v4(
    G,
    primary_spacing=1.0,
    secondary_spacing=0.5,
    primary_direction='top-down',
    secondary_start='right'
)

plt.figure(figsize=(6, 8))
nx.draw(G, pos=pos, with_labels=True, node_color='skyblue', node_size=500)
plt.title("Kececi Layout with NetworkX")
plt.axis('equal')
plt.show()
iGraph ile Örnek
import igraph as ig
import matplotlib.pyplot as plt
from kececilayout import kececi_layout_v4_igraph

G = ig.Graph.Ring(10, circular=False)
pos_list = kececi_layout_v4_igraph(G, primary_direction='left-to-right', secondary_start='up')
layout = ig.Layout(pos_list)

fig, ax = plt.subplots(figsize=(8, 6))
ig.plot(G, target=ax, layout=layout, vertex_label=[f"N{i}" for i in range(10)])
ax.set_aspect('equal')
plt.show()
RustworkX ile Örnek
import rustworkx as rx
import kececilayout as kl
import matplotlib.pyplot as plt

G = rx.generators.path_graph(10)
pos = kl.kececi_layout_v4(G, primary_direction='bottom-up')
# Matplotlib ile çizim yapılabilir
Networkit ile Örnek
import networkit as nk
import kececilayout as kl
import matplotlib.pyplot as plt

G = nk.graph.Graph(10)
for i in range(9):
    G.addEdge(i, i+1)
pos = kl.kececi_layout_v4(G)
# Matplotlib ile çizim
Graphillion ile Örnek
import graphillion as gg
import kececilayout as kl
import matplotlib.pyplot as plt

universe = [(i, i+1) for i in range(1, 10)]
gg.GraphSet.set_universe(universe)
gs = gg.GraphSet()
pos = kl.kececi_layout_v4(gs)
# Matplotlib ile çizim
Desteklenen Kütüphaneler
- NetworkX
- igraph
- Rustworkx
- Networkit
- Graphillion
Not: Tüm kütüphaneler kececi_layout_v4 fonksiyonu ile desteklenir.
Gelişmiş Çizim Stilleri
draw_kececi ile gelişmiş görselleştirmeler:
kl.draw_kececi(G, style='curved')        # Eğri kenarlar
kl.draw_kececi(G, style='transparent')   # Kenar uzunluğuna göre şeffaflık
kl.draw_kececi(G, style='3d')            # 3B heliks yerleşimi
Lisans
MIT Lisansı. Detaylar için LICENSE dosyasına bakın.
Atıf
Araştırmanızda bu kütüphaneyi kullandıysanız, lütfen aşağıdaki gibi atıf yapın:
@misc{kececi_2025_15313946,
  author       = {Keçeci, Mehmet},
  title        = {kececilayout},
  month        = may,
  year         = 2025,
  publisher    = {Zenodo},
  version      = {0.2.7},
  doi          = {10.5281/zenodo.15313946},
  url          = {https://doi.org/10.5281/zenodo.15313946}
}
📚 Documentation
For full documentation, visit:
https://kececilayout.readthedocs.io
KececiLayout


| Documentation | Paper |
|---|---|
|
|
| PyPI |
|
| Conda |
|
| DOI |
|
| License: MIT |
|
Kececi Layout (Keçeci Yerleşimi): A deterministic graph layout algorithm designed for visualizing linear or sequential structures with a characteristic "zig-zag" or "serpentine" pattern.
Python implementation of the Keçeci layout algorithm for graph visualization.
Description / Açıklama
This algorithm arranges nodes sequentially along a primary axis and offsets them alternately along a secondary axis. It's particularly useful for path graphs, chains, or showing progression.
Bu algoritma, düğümleri birincil eksen boyunca sıralı olarak yerleştirir ve ikincil eksen boyunca dönüşümlü olarak kaydırır. Yol grafları, zincirler veya ilerlemeyi göstermek için özellikle kullanışlıdır.
=> 0.2.6: Curved, transparent, 3d, expanding=True
English Description
Keçeci Layout:
A deterministic node placement algorithm used in graph visualization. In this layout, nodes are arranged sequentially along a defined primary axis. Each subsequent node is then alternately offset along a secondary, perpendicular axis, typically moving to one side of the primary axis and then the other. Often, the magnitude of this secondary offset increases as nodes progress along the primary axis, creating a characteristic "zig-zag" or "serpentine" pattern.
Key Characteristics:
- Linear Focus: Particularly useful for visualizing linear or sequential structures, such as paths, chains, or ordered processes.
- Deterministic: Produces the exact same layout for the same graph and parameters every time.
- Overlap Reduction: Helps prevent node collisions by spreading nodes out away from the primary axis.
- Parametric: Can be customized using parameters such as the primary direction (e.g.,
top-down), the starting side for the secondary offset (e.g.,start_right), and the spacing along both axes (primary_spacing,secondary_spacing).
Türkçe Tanımlama
Keçeci Yerleşimi (Keçeci Layout):
Graf görselleştirmede kullanılan deterministik bir düğüm yerleştirme algoritmasıdır. Bu yöntemde düğümler, belirlenen birincil (ana) eksen boyunca sıralı olarak yerleştirilir. Her bir sonraki düğüm, ana eksenin bir sağına bir soluna (veya bir üstüne bir altına) olmak üzere, ikincil eksen doğrultusunda dönüşümlü olarak kaydırılır. Genellikle, ana eksende ilerledikçe ikincil eksendeki kaydırma miktarı artar ve bu da karakteristik bir "zıgzag" veya "yılanvari" desen oluşturur.
Temel Özellikleri:
- Doğrusal Odak: Özellikle yollar (paths), zincirler veya sıralı süreçler gibi doğrusal veya ardışık yapıları görselleştirmek için kullanışlıdır.
- Deterministik: Aynı graf ve parametrelerle her zaman aynı sonucu üretir.
- Çakışmayı Azaltma: Düğümleri ana eksenden uzağa yayarak çakışmaları önlemeye yardımcı olur.
- Parametrik: Ana eksenin yönü (örn.
top-down), ikincil kaydırmanın başlangıç yönü (örn.start_right) ve eksenler arası boşluklar (primary_spacing,secondary_spacing) gibi parametrelerle özelleştirilebilir.
Installation / Kurulum
conda install bilgi::kececilayout -y

pip install kececilayout
https://anaconda.org/bilgi/kececilayout
https://pypi.org/project/KececiLayout/
https://github.com/WhiteSymmetry/kececilayout
https://zenodo.org/records/15313947
https://zenodo.org/records/15314329
Usage / Kullanım
The layout function generally accepts a graph object and returns positions.
Example with NetworkX
import networkx as nx
import matplotlib.pyplot as plt
import kececilayout as kl # Assuming the main function is imported like this
import random

# Create a graph
G = nx.path_graph(10)

# Calculate layout positions using the generic function
# (Assuming kl.kececi_layout_v4 is the main/generic function)
pos = kl.kececi_layout_v4(G,
                           primary_spacing=1.0,
                           secondary_spacing=0.5,
                           primary_direction='top-down',
                           secondary_start='right')

# Draw the graph
plt.figure(figsize=(6, 8))
nx.draw(G, pos=pos, with_labels=True, node_color='skyblue', node_size=500, font_size=10)
plt.title("Keçeci Layout with NetworkX")
plt.axis('equal') # Ensure aspect ratio is equal
plt.show()
import matplotlib.pyplot as plt
import math
import networkx as nx
import kececilayout as kl
import random
try:
import kececilayout as kl
except ImportError:
print("Error: 'kececi_layout.py' not found or could not be imported.")
print("Please ensure the file containing kececi_layout_v4 is accessible.")
exit()
# --- General Layout Parameters ---
LAYOUT_PARAMS = {
'primary_spacing': 1.0,
'secondary_spacing': 0.6, # Make the zigzag noticeable
'primary_direction': 'top-down',
'secondary_start': 'right'
}
N_NODES = 10 # Number of nodes in the example graph
# === NetworkX Example ===
try:
import networkx as nx
print("\n--- NetworkX Example ---")
# Generate graph (Path graph)
G_nx = nx.path_graph(N_NODES)
print(f"NetworkX graph generated: {G_nx.number_of_nodes()} nodes, {G_nx.number_of_edges()} edges")
# Calculate layout
print("Calculating Keçeci Layout...")
# Call the layout function from the imported module
pos_nx = kl.kececi_layout_v4(G_nx, **LAYOUT_PARAMS)
# print("NetworkX positions:", pos_nx) # Debug print if needed
# Plot
plt.figure(figsize=(6, 8)) # Suitable figure size for vertical layout
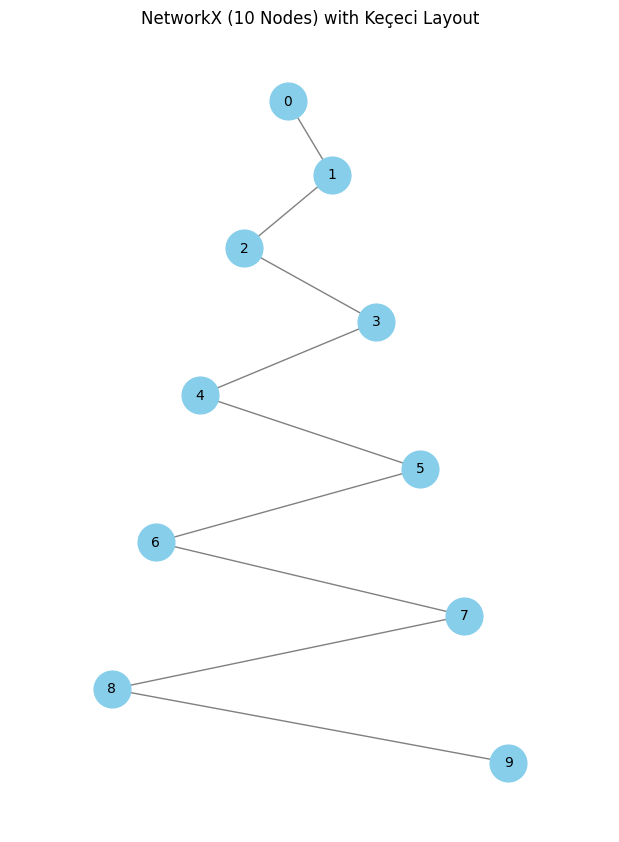
nx.draw(G_nx, # NetworkX graph object
pos=pos_nx, # Positions calculated by Kececi Layout
with_labels=True, # Show node labels (indices)
node_color='skyblue',# Node color
node_size=700, # Node size
font_size=10, # Label font size
edge_color='gray') # Edge color
plt.title(f"NetworkX ({N_NODES} Nodes) with Keçeci Layout") # Plot title
plt.xlabel("X Coordinate") # X-axis label
plt.ylabel("Y Coordinate") # Y-axis label
plt.axis('equal') # Ensure equal aspect ratio for correct spacing perception
# plt.grid(False) # Ensure grid is off
plt.show() # Display the plot
except ImportError:
print("NetworkX is not installed. Skipping this example.")
except Exception as e:
print(f"An error occurred in the NetworkX example: {e}")
import traceback
traceback.print_exc()
print("\n--- NetworkX Example Finished ---")
Example with iGraph
import igraph as ig
import matplotlib.pyplot as plt
# Assuming a specific function for igraph exists or the generic one handles it
from kececilayout import kececi_layout_v4_igraph # Adjust import if needed
import random

# Create a graph
G = ig.Graph.Ring(10, circular=False) # Path graph equivalent
for i in range(G.vcount()):
     G.vs[i]["name"] = f"N{i}"

# Calculate layout positions (returns a list of coords)
pos_list = kececi_layout_v4_igraph(G,
                                    primary_spacing=1.5,
                                    secondary_spacing=1.0,
                                    primary_direction='left-to-right',
                                    secondary_start='up')
layout = ig.Layout(coords=pos_list)

# Draw the graph
fig, ax = plt.subplots(figsize=(8, 6))
ig.plot(
    G,
    target=ax,
    layout=layout,
    vertex_label=G.vs["name"],
    vertex_color="lightblue",
    vertex_size=30
)
ax.set_title("Keçeci Layout with iGraph")
ax.set_aspect('equal', adjustable='box')
plt.show()
import matplotlib.pyplot as plt
import math
import igraph as ig
import kececilayout as kl
try:
import kececilayout as kl
except ImportError:
print("Error: 'kececi_layout.py' not found or could not be imported.")
print("Please ensure the file containing kececi_layout_v4 is accessible.")
exit()
# --- General Layout Parameters ---
LAYOUT_PARAMS = {
'primary_spacing': 1.0,
'secondary_spacing': 0.6, # Make the zigzag noticeable
'primary_direction': 'top-down',
'secondary_start': 'right'
}
N_NODES = 10 # Number of nodes in the example graph
# === igraph Example ===
try:
import igraph as ig
print("\n--- igraph Example ---")
# Generate graph (Path graph using Ring(circular=False))
G_ig = ig.Graph.Ring(N_NODES, directed=False, circular=False)
print(f"igraph graph generated: {G_ig.vcount()} vertices, {G_ig.ecount()} edges")
# Calculate layout
print("Calculating Keçeci Layout...")
# Call the layout function from the imported module
pos_ig = kl.kececi_layout_v4(G_ig, **LAYOUT_PARAMS)
# print("igraph positions (dict):", pos_ig) # Debug print if needed
# Convert positions dict to list ordered by vertex index for ig.plot
layout_list_ig = []
plot_possible = True
if pos_ig: # Check if dictionary is not empty
try:
# Generate list: [pos_ig[0], pos_ig[1], ..., pos_ig[N-1]]
layout_list_ig = [pos_ig[i] for i in range(G_ig.vcount())]
# print("igraph layout (list):", layout_list_ig) # Debug print if needed
except KeyError as e:
print(f"ERROR: Key {e} not found while creating position list for igraph.")
print("The layout function might not have returned positions for all vertices.")
plot_possible = False # Cannot plot if list is incomplete
else:
print("ERROR: Keçeci Layout returned empty positions for igraph.")
plot_possible = False
# Plot using igraph's plotting capabilities
print("Plotting graph using igraph.plot...")
fig, ax = plt.subplots(figsize=(6, 8)) # Generate matplotlib figure and axes
if plot_possible:
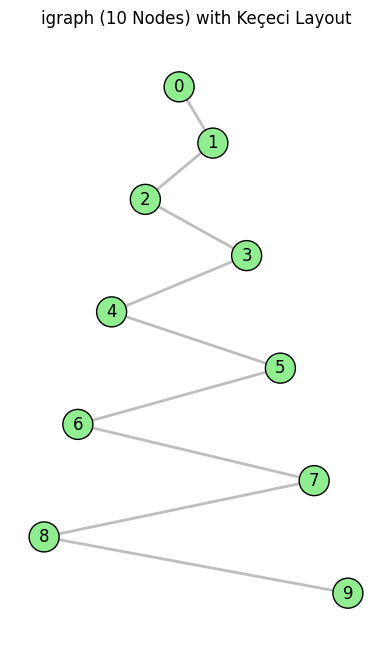
ig.plot(G_ig,
target=ax, # Draw on the matplotlib axes
layout=layout_list_ig, # Use the ORDERED LIST of coordinates
vertex_label=[str(i) for i in range(G_ig.vcount())], # Labels 0, 1,...
vertex_color='lightgreen',
vertex_size=30, # Note: igraph vertex_size scale differs
edge_color='gray')
else:
ax.text(0.5, 0.5, "Plotting failed:\nMissing or incomplete layout positions.",
ha='center', va='center', color='red', fontsize=12) # Error message on plot
ax.set_title(f"igraph ({N_NODES} Nodes) with Keçeci Layout") # Plot title
ax.set_aspect('equal', adjustable='box') # Ensure equal aspect ratio
# ax.grid(False) # Ensure grid is off
plt.show() # Display the plot
except ImportError:
print("python-igraph is not installed. Skipping this example.")
except Exception as e:
print(f"An error occurred in the igraph example: {e}")
import traceback
traceback.print_exc()
print("\n--- igraph Example Finished ---")
Example with RustworkX
import matplotlib.pyplot as plt
from matplotlib.collections import LineCollection # Efficient edge drawing
import math
import rustworkx as rx
import kececilayout as kl
import random
try:
import kececilayout as kl
except ImportError:
print("Error: 'kececi_layout.py' not found or could not be imported.")
print("Please ensure the file containing kececi_layout_v4 is accessible.")
exit()
# --- General Layout Parameters ---
LAYOUT_PARAMS = {
'primary_spacing': 1.0,
'secondary_spacing': 0.6, # Make the zigzag noticeable
'primary_direction': 'top-down',
'secondary_start': 'right'
}
N_NODES = 10 # Number of nodes in the example graph
# === Rustworkx Example ===
try:
import rustworkx as rx
print("\n--- Rustworkx Example ---")
# Generate graph (Path graph)
G_rx = rx.generators.path_graph(N_NODES)
print(f"Rustworkx graph generated: {G_rx.num_nodes()} nodes, {G_rx.num_edges()} edges")
# Calculate layout
print("Calculating Keçeci Layout...")
# Call the layout function from the imported module
pos_rx = kl.kececi_layout_v4(G_rx, **LAYOUT_PARAMS)
# print("Rustworkx positions:", pos_rx) # Debug print if needed
# Plot using Matplotlib directly (Rustworkx doesn't have a built-in draw)
print("Plotting graph using Matplotlib...")
plt.figure(figsize=(6, 8))
ax = plt.gca() # Get current axes
node_indices_rx = G_rx.node_indices() # Get node indices [0, 1, ...]
# Check if all nodes have positions
if not all(idx in pos_rx for idx in node_indices_rx):
print("ERROR: Rustworkx positions dictionary does not cover all nodes!")
# Decide how to handle: exit, plot partial, etc.
else:
# Draw nodes
x_coords_rx = [pos_rx[i][0] for i in node_indices_rx]
y_coords_rx = [pos_rx[i][1] for i in node_indices_rx]
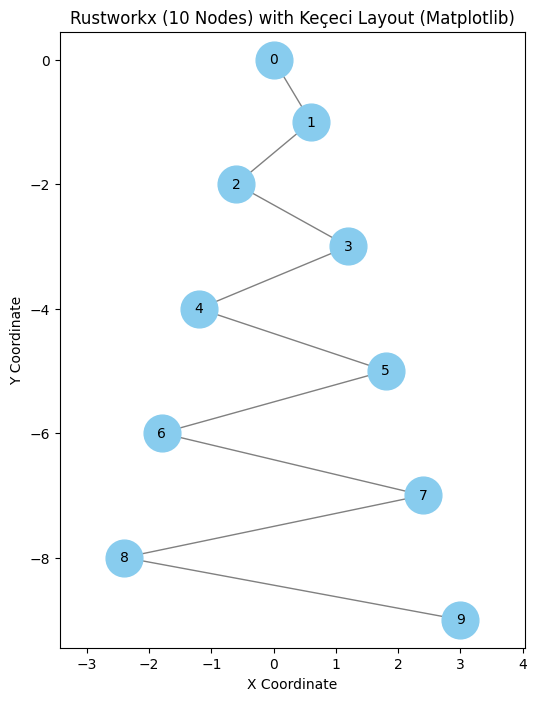
ax.scatter(x_coords_rx, y_coords_rx, s=700, c='#88CCEE', zorder=2, label='Nodes') # Skyblue color
# Draw labels
for i in node_indices_rx:
ax.text(pos_rx[i][0], pos_rx[i][1], str(i), ha='center', va='center', fontsize=10, zorder=3)
# Draw edges using LineCollection for efficiency
edge_lines = []
for u, v in G_rx.edge_list(): # Get list of edges (node index pairs)
if u in pos_rx and v in pos_rx:
# Segment format: [(x1, y1), (x2, y2)]
edge_lines.append([pos_rx[u], pos_rx[v]])
else:
print(f"Warning: Position not found for edge ({u},{v}) in Rustworkx graph.")
if edge_lines:
lc = LineCollection(edge_lines, colors='gray', linewidths=1.0, zorder=1, label='Edges')
ax.add_collection(lc) # Add edges to the plot axes
plt.title(f"Rustworkx ({N_NODES} Nodes) with Keçeci Layout (Matplotlib)") # Plot title
plt.xlabel("X Coordinate") # X-axis label
plt.ylabel("Y Coordinate") # Y-axis label
plt.axis('equal') # Ensure equal aspect ratio
# plt.grid(False) # Ensure grid is off
plt.show() # Display the plot
except ImportError:
print("Rustworkx is not installed. Skipping this example.")
except Exception as e:
print(f"An error occurred in the Rustworkx example: {e}")
import traceback
traceback.print_exc()
print("\n--- Rustworkx Example Finished ---")
Example with Networkit
import matplotlib.pyplot as plt
from matplotlib.collections import LineCollection # Efficient edge drawing
import math
import networkit as nk
import kececilayout as kl
import random
try:
import kececilayout as kl
except ImportError:
print("Error: 'kececi_layout.py' not found or could not be imported.")
print("Please ensure the file containing kececi_layout_v4 is accessible.")
exit()
# --- General Layout Parameters ---
LAYOUT_PARAMS = {
'primary_spacing': 1.0,
'secondary_spacing': 0.6, # Make the zigzag noticeable
'primary_direction': 'top-down',
'secondary_start': 'right'
}
N_NODES = 10 # Number of nodes in the example graph
# === Networkit Example ===
try:
import networkit as nk
print("\n--- Networkit Example ---")
# Generate graph (Path graph, manually)
G_nk = nk.graph.Graph(N_NODES, weighted=False, directed=False) # Generate empty graph container
print("Empty Networkit graph generated.")
# Add nodes first (Networkit often requires this)
for i in range(N_NODES):
if not G_nk.hasNode(i): # Check if node already exists (good practice)
G_nk.addNode()
print(f"{G_nk.numberOfNodes()} nodes added.")
# Add edges
for i in range(N_NODES - 1):
G_nk.addEdge(i, i+1) # Add edges 0-1, 1-2, ...
print(f"Networkit graph constructed: {G_nk.numberOfNodes()} nodes, {G_nk.numberOfEdges()} edges")
# Calculate layout
print("Calculating Keçeci Layout...")
# Call the layout function from the imported module
pos_nk = kl.kececi_layout_v4(G_nk, **LAYOUT_PARAMS)
# print("Networkit positions:", pos_nk) # Debug print if needed
# Plot using Matplotlib directly (Networkit doesn't have a simple built-in draw)
print("Plotting graph using Matplotlib...")
plt.figure(figsize=(6, 8))
ax = plt.gca() # Get current axes
node_indices_nk = sorted(list(G_nk.iterNodes())) # Get node indices [0, 1, ...]
# Check if all nodes have positions
if not all(idx in pos_nk for idx in node_indices_nk):
print("ERROR: Networkit positions dictionary does not cover all nodes!")
else:
# Draw nodes
x_coords_nk = [pos_nk[i][0] for i in node_indices_nk]
y_coords_nk = [pos_nk[i][1] for i in node_indices_nk]
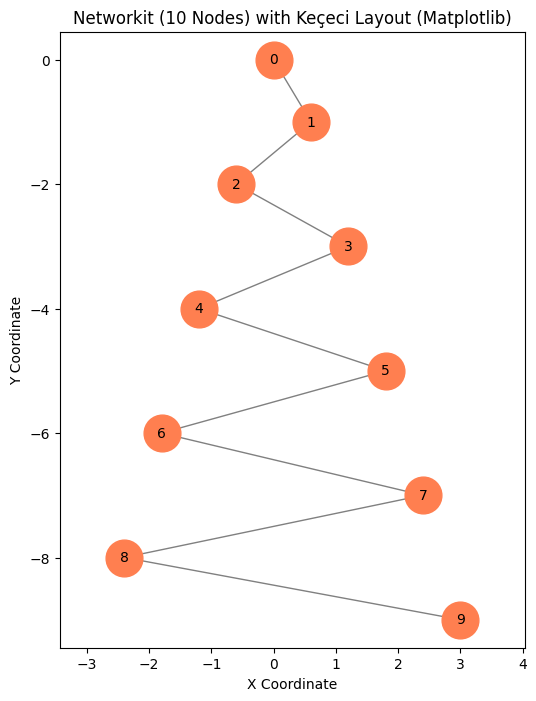
ax.scatter(x_coords_nk, y_coords_nk, s=700, c='coral', zorder=2, label='Nodes')
# Draw labels
for i in node_indices_nk:
ax.text(pos_nk[i][0], pos_nk[i][1], str(i), ha='center', va='center', fontsize=10, zorder=3)
# Draw edges using LineCollection
edge_lines_nk = []
for u, v in G_nk.iterEdges(): # Iterate through edges
if u in pos_nk and v in pos_nk:
edge_lines_nk.append([pos_nk[u], pos_nk[v]])
else:
print(f"Warning: Position not found for edge ({u},{v}) in Networkit graph.")
if edge_lines_nk:
lc_nk = LineCollection(edge_lines_nk, colors='gray', linewidths=1.0, zorder=1, label='Edges')
ax.add_collection(lc_nk)
plt.title(f"Networkit ({N_NODES} Nodes) with Keçeci Layout (Matplotlib)") # Plot title
plt.xlabel("X Coordinate") # X-axis label
plt.ylabel("Y Coordinate") # Y-axis label
plt.axis('equal') # Ensure equal aspect ratio
# plt.grid(False) # Ensure grid is off
plt.show() # Display the plot
except ImportError:
print("Networkit is not installed. Skipping this example.")
except Exception as e:
print(f"An error occurred in the Networkit example: {e}")
import traceback
traceback.print_exc()
print("\n--- Networkit Example Finished ---")
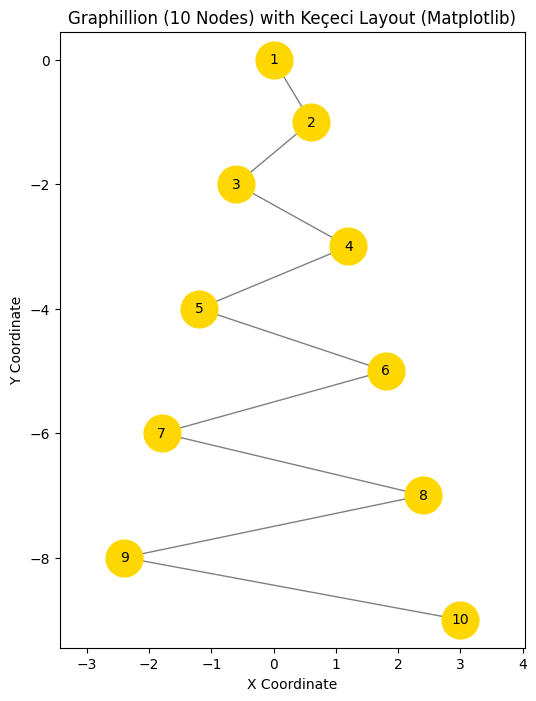
Example with Graphillion
import matplotlib.pyplot as plt
from matplotlib.collections import LineCollection # Efficient edge drawing
import math
import itertools # Graphillion might implicitly need itertools if find_max_node_id uses it internally
import graphillion as gg
import kececilayout as kl
import random


try:
    import kececilayout as kl
except ImportError:
    print("Error: 'kececi_layout.py' not found or could not be imported.")
    print("Please ensure the file containing kececi_layout_v4 is accessible.")
    exit()

# --- General Layout Parameters ---
LAYOUT_PARAMS = {
    'primary_spacing': 1.0,
    'secondary_spacing': 0.6, # Make the zigzag noticeable
    'primary_direction': 'top-down',
    'secondary_start': 'right'
}
N_NODES = 10 # Number of nodes in the example graph (will be 1 to N_NODES)

# === Graphillion Example ===
try:
    import graphillion as gg
    print("\n--- Graphillion Example ---")

    # Define the universe of possible edges (Path graph, 1-based indexing common)
    universe = []
    # Edges (1,2), (2,3), ..., (N_NODES-1, N_NODES)
    for i in range(1, N_NODES):
        universe.append((i, i + 1))
    gg.GraphSet.set_universe(universe)
    max_node_gg = N_NODES # We know the max node ID for this simple case
    print(f"Graphillion universe defined: {len(universe)} edges, max node ID {max_node_gg}")

    # Generate a GraphSet object (can be empty, layout function uses the universe)
    # The layout function provided seems to derive nodes from the universe edges.
    gs = gg.GraphSet()

    # Calculate layout
    print("Calculating Keçeci Layout...")
    # Call the layout function; it should handle the Graphillion GraphSet object
    # and likely use 1-based indexing based on the universe.
    pos_gg = kl.kececi_layout_v4(gs, **LAYOUT_PARAMS)
    # print("Graphillion positions:", pos_gg) # Debug print if needed

    # Plot using Matplotlib directly (Graphillion has no plotting)
    print("Plotting graph using Matplotlib...")
    plt.figure(figsize=(6, 8))
    ax = plt.gca() # Get current axes

    # Node indices are expected to be 1, 2, ... N_NODES from the universe
    node_indices_gg = sorted(pos_gg.keys())

    # Check if all expected nodes (1 to N_NODES) have positions
    expected_nodes = set(range(1, N_NODES + 1))
    if not expected_nodes.issubset(set(node_indices_gg)):
         print(f"ERROR: Graphillion positions missing expected nodes. Found: {node_indices_gg}, Expected: {list(expected_nodes)}")
    else:
        # Draw nodes
        x_coords_gg = [pos_gg[i][0] for i in node_indices_gg]
        y_coords_gg = [pos_gg[i][1] for i in node_indices_gg]
        ax.scatter(x_coords_gg, y_coords_gg, s=700, c='gold', zorder=2, label='Nodes')

        # Draw labels (using the 1-based indices)
        for i in node_indices_gg:
            ax.text(pos_gg[i][0], pos_gg[i][1], str(i), ha='center', va='center', fontsize=10, zorder=3)

        # Draw edges using LineCollection (from the defined universe)
        edge_lines_gg = []
        for u, v in universe: # Use the universe edges
            if u in pos_gg and v in pos_gg:
                 edge_lines_gg.append([pos_gg[u], pos_gg[v]])
            else:
                 print(f"Warning: Position not found for universe edge ({u},{v}) in Graphillion.")

        if edge_lines_gg:
            lc_gg = LineCollection(edge_lines_gg, colors='gray', linewidths=1.0, zorder=1, label='Edges')
            ax.add_collection(lc_gg)

    plt.title(f"Graphillion ({N_NODES} Nodes) with Keçeci Layout (Matplotlib)") # Plot title
    plt.xlabel("X Coordinate") # X-axis label
    plt.ylabel("Y Coordinate") # Y-axis label
    plt.axis('equal')       # Ensure equal aspect ratio
    # plt.grid(False)         # Ensure grid is off
    plt.show()              # Display the plot

except ImportError:
    print("Graphillion is not installed. Skipping this example.")
except Exception as e:
    print(f"An error occurred in the Graphillion example: {e}")
    import traceback
    traceback.print_exc()

print("\n--- Graphillion Example Finished ---")
Supported Backends / Desteklenen Kütüphaneler
The layout functions are designed to work with graph objects from the following libraries:
- NetworkX: (
networkx.Graph,networkx.DiGraph, etc.) - igraph: (
igraph.Graph) - Rustworkx: (Requires appropriate conversion or adapter function)
- Networkit: (Requires appropriate conversion or adapter function)
- Graphillion: (Requires appropriate conversion or adapter function)
Note: Direct support might vary. Check specific function documentation for compatibility details.
License / Lisans
This project is licensed under the MIT License. See the LICENSE file for details.
**Ek Notlar:**

*   **Rozetler (Badges):** Başlangıçta PyPI ve Lisans rozetleri ekledim (yorum satırı içinde). Eğer projeniz PyPI'da yayınlandıysa veya bir CI/CD süreci varsa, ilgili rozetleri eklemek iyi bir pratiktir.
*   **LICENSE Dosyası:** `LICENSE` bölümünde bir `LICENSE` dosyasına referans verdim. Projenizin kök dizininde MIT lisans metnini içeren bir `LICENSE` dosyası oluşturduğunuzdan emin olun.
*   **İçe Aktarma Yolları:** Örneklerde `import kececilayout as kl` veya `from kececilayout import kececi_layout_v4_igraph` gibi varsayımsal içe aktarma yolları kullandım. Kendi paket yapınıza göre bunları ayarlamanız gerekebilir.
*   **Fonksiyon Adları:** Örneklerde `kececi_layout_v4` ve `kececi_layout_v4_igraph` gibi fonksiyon adlarını kullandım. Gerçek fonksiyon adlarınız farklıysa bunları güncelleyin.
*   **Görselleştirme:** Örneklere `matplotlib.pyplot` kullanarak temel görselleştirme adımlarını ekledim, bu da kullanıcıların sonucu nasıl görebileceğini gösterir. Eksen oranlarını eşitlemek (`axis('equal')` veya `set_aspect('equal')`) layout'un doğru görünmesi için önemlidir.
Citation
If this library was useful to you in your research, please cite us. Following the GitHub citation standards, here is the recommended citation.
BibTeX
@misc{kececi_2025_15313946,
  author       = {Keçeci, Mehmet},
  title        = {kececilayout},
  month        = may,
  year         = 2025,
  publisher    = {PyPI, Anaconda, Github, Zenodo},
  version      = {0.2.0},
  doi          = {10.5281/zenodo.15313946},
  url          = {https://doi.org/10.5281/zenodo.15313946},
}

@misc{kececi_2025_15314329,
  author       = {Keçeci, Mehmet},
  title        = {Keçeci Layout},
  month        = may,
  year         = 2025,
  publisher    = {Zenodo},
  version      = {1.0.0},
  doi          = {10.5281/zenodo.15314329},
  url          = {https://doi.org/10.5281/zenodo.15314329},
}
APA
Keçeci, M. (2025). The Keçeci Layout: A Deterministic Visualisation Framework for the Structural Analysis of Ordered Systems in Chemistry and Environmental Science. Open Science Articles (OSAs), Zenodo. https://doi.org/10.5281/zenodo.16696713

Keçeci, M. (2025). The Keçeci Layout: A Deterministic, Order-Preserving Visualization Algorithm for Structured Systems. Open Science Articles (OSAs), Zenodo. https://doi.org/10.5281/zenodo.16526798

Keçeci, M. (2025). Keçeci Deterministic Zigzag Layout. WorkflowHub. https://doi.org/10.48546/workflowhub.document.31.1

Keçeci, M. (2025). Keçeci Zigzag Layout Algorithm. Authorea. https://doi.org/10.22541/au.175087581.16524538/v1

Keçeci, M. (2025). The Keçeci Layout: A Structural Approach for Interdisciplinary Scientific Analysis. Open Science Articles (OSAs), Zenodo. https://doi.org/10.5281/zenodo.15792684

Keçeci, M. (2025). When Nodes Have an Order: The Keçeci Layout for Structured System Visualization. HAL open science. https://hal.science/hal-05143155; https://doi.org/10.13140/RG.2.2.19098.76484

Keçeci, M. (2025). The Keçeci Layout: A Cross-Disciplinary Graphical Framework for Structural Analysis of Ordered Systems. Authorea. https://doi.org/10.22541/au.175156702.26421899/v1

Keçeci, M. (2025). Beyond Traditional Diagrams: The Keçeci Layout for Structural Thinking. Knowledge Commons. https://doi.org/10.17613/v4w94-ak572

Keçeci, M. (2025). The Keçeci Layout: A Structural Approach for Interdisciplinary Scientific Analysis. figshare. Journal contribution. https://doi.org/10.6084/m9.figshare.29468135

Keçeci, M. (2025, July 3). The Keçeci Layout: A Structural Approach for Interdisciplinary Scientific Analysis. OSF. https://doi.org/10.17605/OSF.IO/9HTG3

Keçeci, M. (2025). Beyond Topology: Deterministic and Order-Preserving Graph Visualization with the Keçeci Layout. WorkflowHub. https://doi.org/10.48546/workflowhub.document.34.4

Keçeci, M. (2025). A Graph-Theoretic Perspective on the Keçeci Layout: Structuring Cross-Disciplinary Inquiry. Preprints. https://doi.org/10.20944/preprints202507.0589.v1

Keçeci, M. (2025). Keçeci Layout. Open Science Articles (OSAs), Zenodo. https://doi.org/10.5281/zenodo.15314328

Keçeci, M. (2025). kececilayout [Data set]. WorkflowHub. https://doi.org/10.48546/workflowhub.datafile.17.1

Keçeci, M. (2025, May 1). Kececilayout. Open Science Articles (OSAs), Zenodo. https://doi.org/10.5281/zenodo.15313946
Chicago
Keçeci, Mehmet. The Keçeci Layout: A Deterministic Visualisation Framework for the Structural Analysis of Ordered Systems in Chemistry and Environmental Science. Open Science Articles (OSAs), Zenodo, 2025. https://doi.org/10.5281/zenodo.16696713

Keçeci, Mehmet. The Keçeci Layout: A Deterministic, Order-Preserving Visualization Algorithm for Structured Systems. Open Science Articles (OSAs), Zenodo, 2025. https://doi.org/10.5281/zenodo.16526798

Keçeci, Mehmet. kececilayout [Data set]. WorkflowHub, 2025. https://doi.org/10.48546/workflowhub.datafile.17.1

Keçeci, Mehmet. "Kececilayout". Open Science Articles (OSAs), Zenodo, 2025. https://doi.org/10.5281/zenodo.15313946.

Keçeci, Mehmet. "Keçeci Layout". Open Science Articles (OSAs), Zenodo, 2025. https://doi.org/10.5281/zenodo.15314328.
Project details
Verified details
These details have been verified by PyPIProject links
GitHub Statistics
Maintainers
Release history Release notifications | RSS feed


Download files
Download the file for your platform. If you're not sure which to choose, learn more about installing packages.
Source Distribution
Built Distribution
Filter files by name, interpreter, ABI, and platform.
If you're not sure about the file name format, learn more about wheel file names.
Copy a direct link to the current filters
File details
Details for the file kececilayout-0.3.1.tar.gz.
File metadata
- Download URL: kececilayout-0.3.1.tar.gz
- Upload date:
- Size: 45.5 kB
- Tags: Source
- Uploaded using Trusted Publishing? Yes
- Uploaded via: twine/6.1.0 CPython/3.12.8
File hashes
| Algorithm | Hash digest | |
|---|---|---|
| SHA256 |
bbe610b24882c84f1a7cd7f266a34a5daa8090d5146e0e1122cdca71735bf8d5
|
|
| MD5 |
0920ed9236f9760955a58332f5e5559b
|
|
| BLAKE2b-256 |
fd04623504a80e12683bcf4eb5c9274cc1847f660051f052813a13e1db1e763f
|
Provenance
The following attestation bundles were made for kececilayout-0.3.1.tar.gz:
Publisher:
python-publish.yml on WhiteSymmetry/kececilayout
-
Statement:
-
Statement type:
https://in-toto.io/Statement/v1 -
Predicate type:
https://docs.pypi.org/attestations/publish/v1 -
Subject name:
kececilayout-0.3.1.tar.gz -
Subject digest:
bbe610b24882c84f1a7cd7f266a34a5daa8090d5146e0e1122cdca71735bf8d5 - Sigstore transparency entry: 381706364
- Sigstore integration time:
-
Permalink:
WhiteSymmetry/kececilayout@273e2e01ec87925e7db4bf3c2a6a29f8fcff90e2 -
Branch / Tag:
refs/heads/main - Owner: https://github.com/WhiteSymmetry
-
Access:
public
-
Token Issuer:
https://token.actions.githubusercontent.com -
Runner Environment:
github-hosted -
Publication workflow:
python-publish.yml@273e2e01ec87925e7db4bf3c2a6a29f8fcff90e2 -
Trigger Event:
push
-
Statement type:
File details
Details for the file kececilayout-0.3.1-py3-none-any.whl.
File metadata
- Download URL: kececilayout-0.3.1-py3-none-any.whl
- Upload date:
- Size: 23.2 kB
- Tags: Python 3
- Uploaded using Trusted Publishing? Yes
- Uploaded via: twine/6.1.0 CPython/3.12.8
File hashes
| Algorithm | Hash digest | |
|---|---|---|
| SHA256 |
dc54b94d60b7c24c3b60e97ccb825505f8e3ee148623fbfaef2d58a8155a3dd8
|
|
| MD5 |
f52c4db830c493af176dc1f7497063cb
|
|
| BLAKE2b-256 |
c999bc36dc5382797ee0b31ad33b62af11e1d0331a91be06f8df9c98997f86f5
|
Provenance
The following attestation bundles were made for kececilayout-0.3.1-py3-none-any.whl:
Publisher:
python-publish.yml on WhiteSymmetry/kececilayout
-
Statement:
-
Statement type:
https://in-toto.io/Statement/v1 -
Predicate type:
https://docs.pypi.org/attestations/publish/v1 -
Subject name:
kececilayout-0.3.1-py3-none-any.whl -
Subject digest:
dc54b94d60b7c24c3b60e97ccb825505f8e3ee148623fbfaef2d58a8155a3dd8 - Sigstore transparency entry: 381706387
- Sigstore integration time:
-
Permalink:
WhiteSymmetry/kececilayout@273e2e01ec87925e7db4bf3c2a6a29f8fcff90e2 -
Branch / Tag:
refs/heads/main - Owner: https://github.com/WhiteSymmetry
-
Access:
public
-
Token Issuer:
https://token.actions.githubusercontent.com -
Runner Environment:
github-hosted -
Publication workflow:
python-publish.yml@273e2e01ec87925e7db4bf3c2a6a29f8fcff90e2 -
Trigger Event:
push
-
Statement type:


