A tool for calculating kelp coverage from UAV images utilizing Segment Anything Models (SAM)

Project description
KLP: Kelp Location Profiler Tool

Version: 1.0
kelp-coverage is a command-line package designed to analyze UAV imagery of the ocean to calculate the percentage of kelp coverage. It utilizes the Segment Anything Model (SAM) in combination with Sliced Aided Hyper-Inference (SAHI) to create high-resolution segmentations of kelp from water.

Table of Contents
Installation
Install from PyPI: Install the package directly from PyPI using pip. The MobileSAM model will be downloaded by default on the first run of the program.
pip install kelp-coverage
How It Works
The core idea behind how the program works is by leveraging the segment anything model to mask out the background (water) within the image. Since most of the images will contain either kelp or water, by inversing the problem and instead creating a segmentation for where the water is within the image we can get a good estimate of the kelp coverage.
1. Median water pixel
The pipeline begins by sampling 50,000 pixels from each image within a site. It then calculates the median pixel value in CIELAB color space. This creates a unique "water pixel" value for each individual site which is crucial since water color can be incredibly varied.

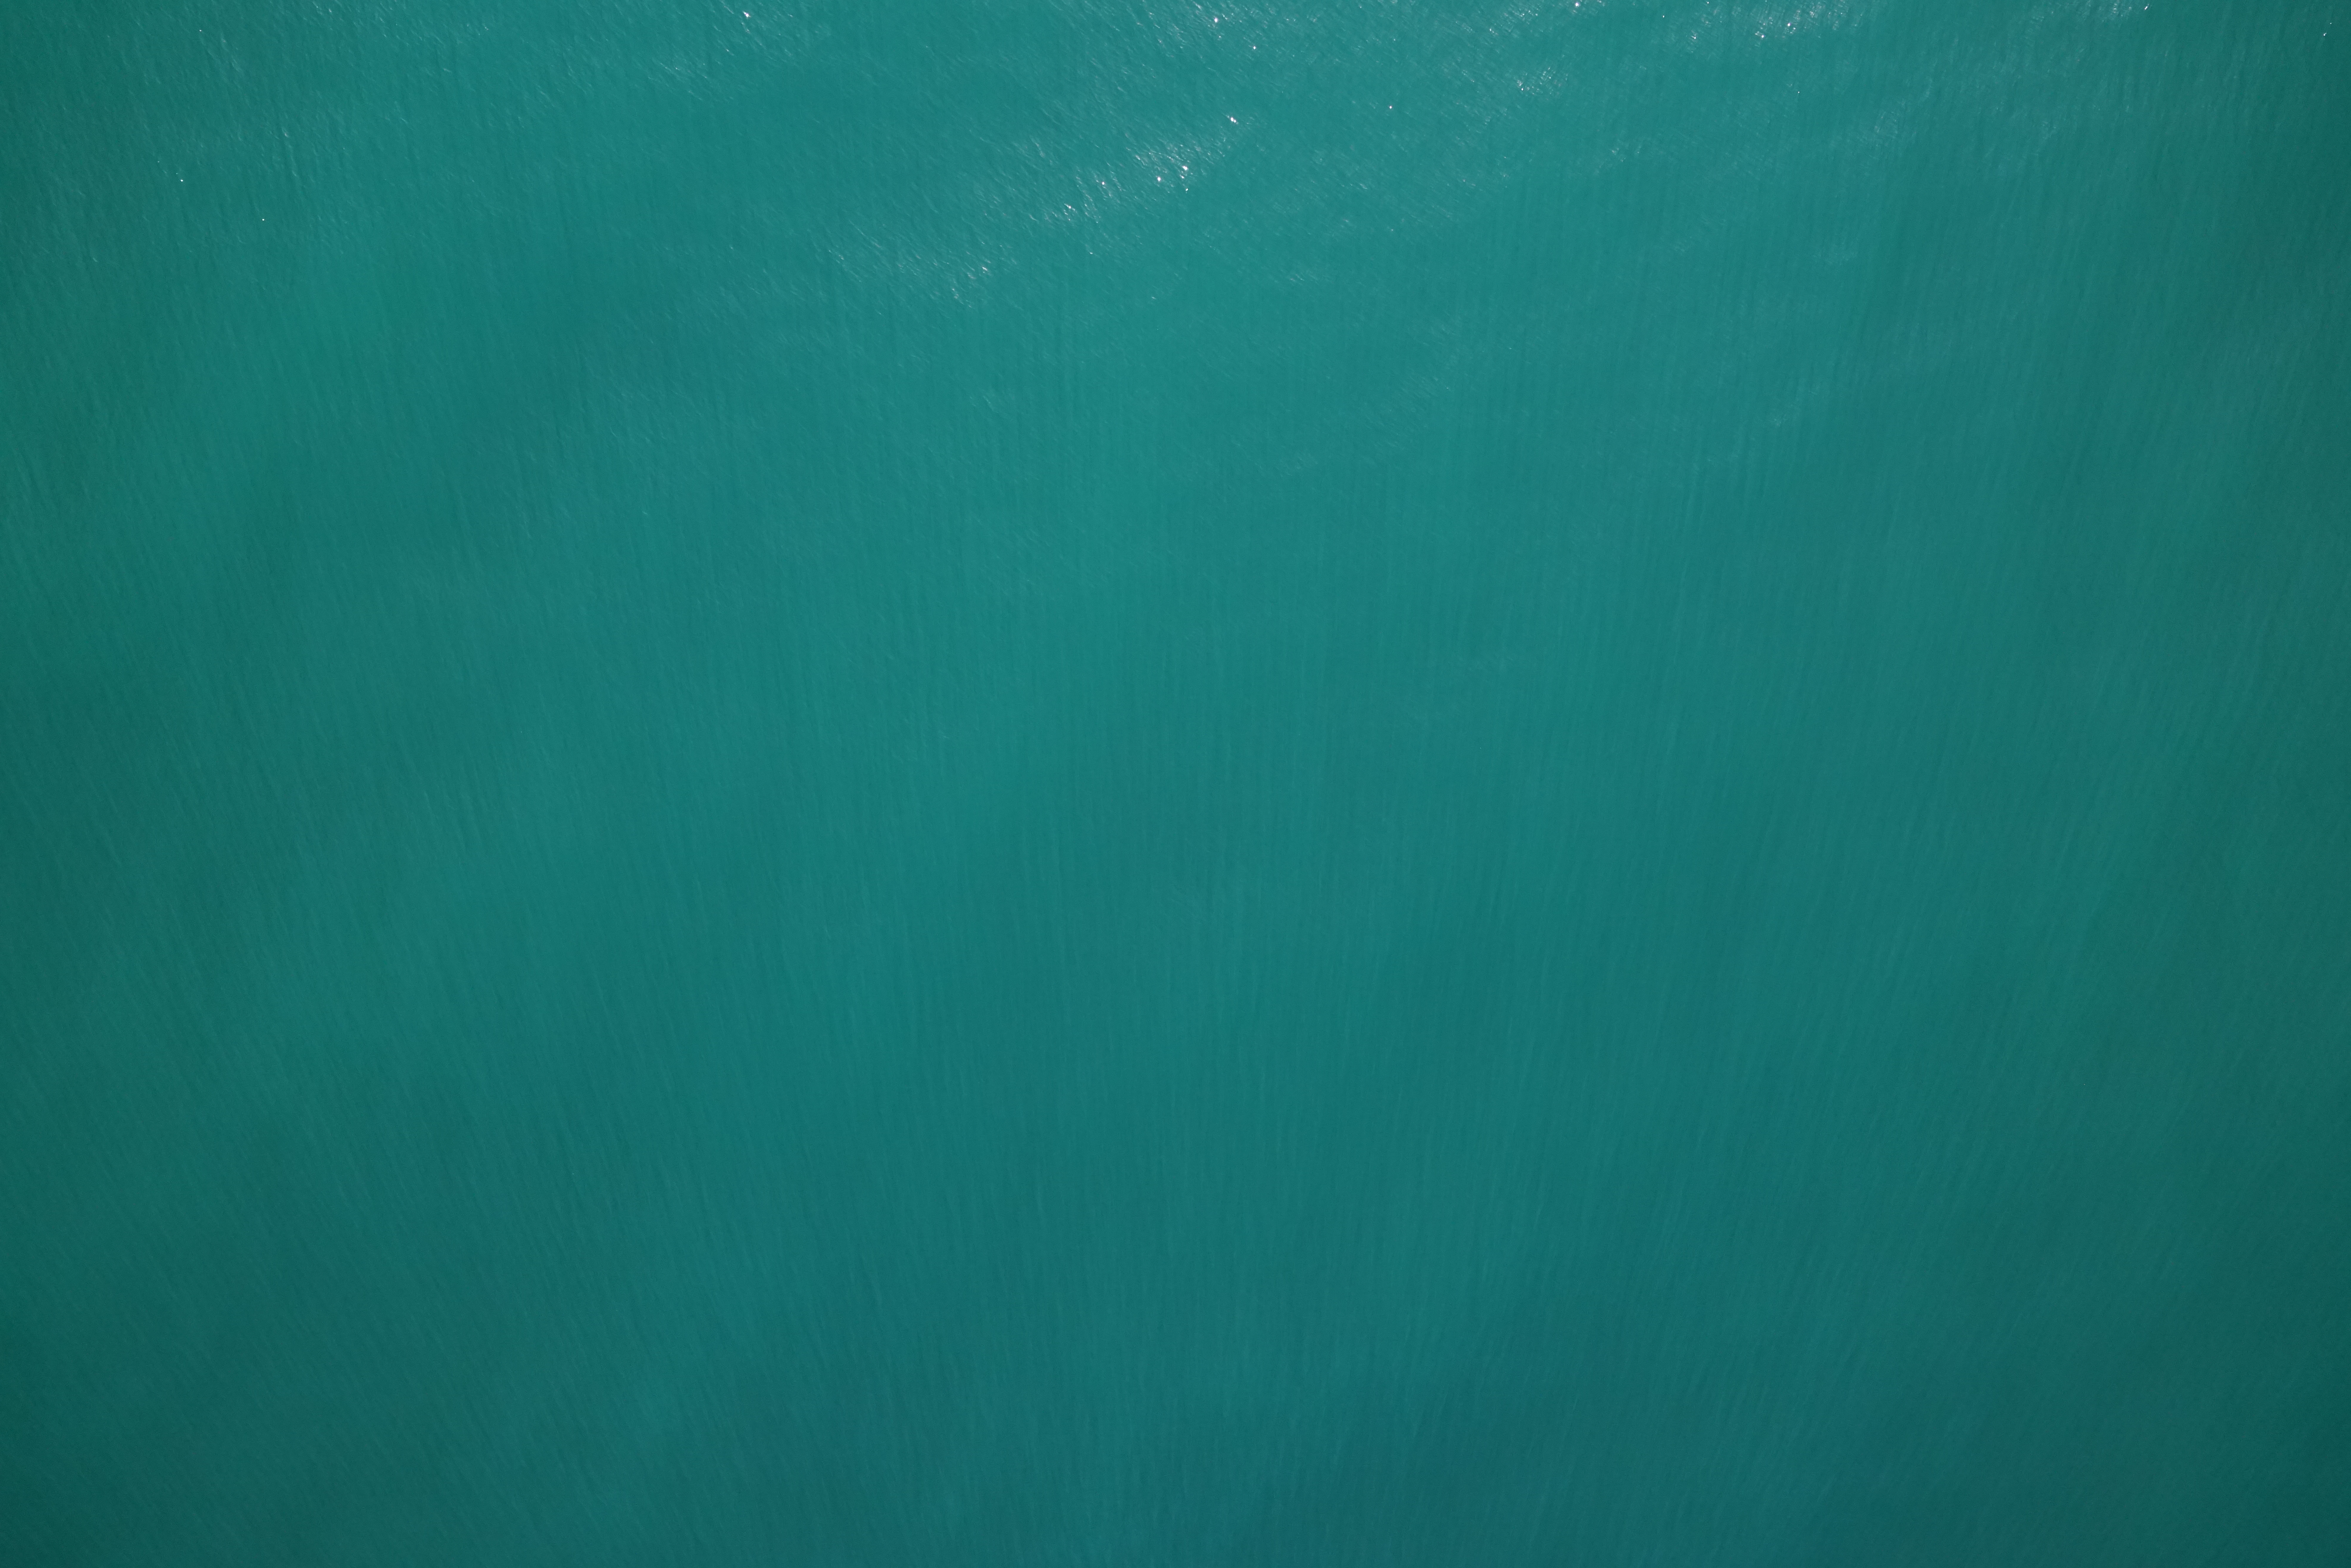
Example of how UAV images from the same site but at different times can be different. UAV image on the right was taken on 2025/06/18 and image on the left was taken on 2025/04/04 at the Seymour survey site
2. Slicing and Segmentation
Slicing the image serves two purposes.
- since the model was trained on 1024x1024 images, reducing the image to the native size of the Segment Anything Model (SAM) helps it better detect objects
- by slicing the image, the amount of space the kelp takes increases, thus making it easier for the model to detect it as an object and not a part of the background
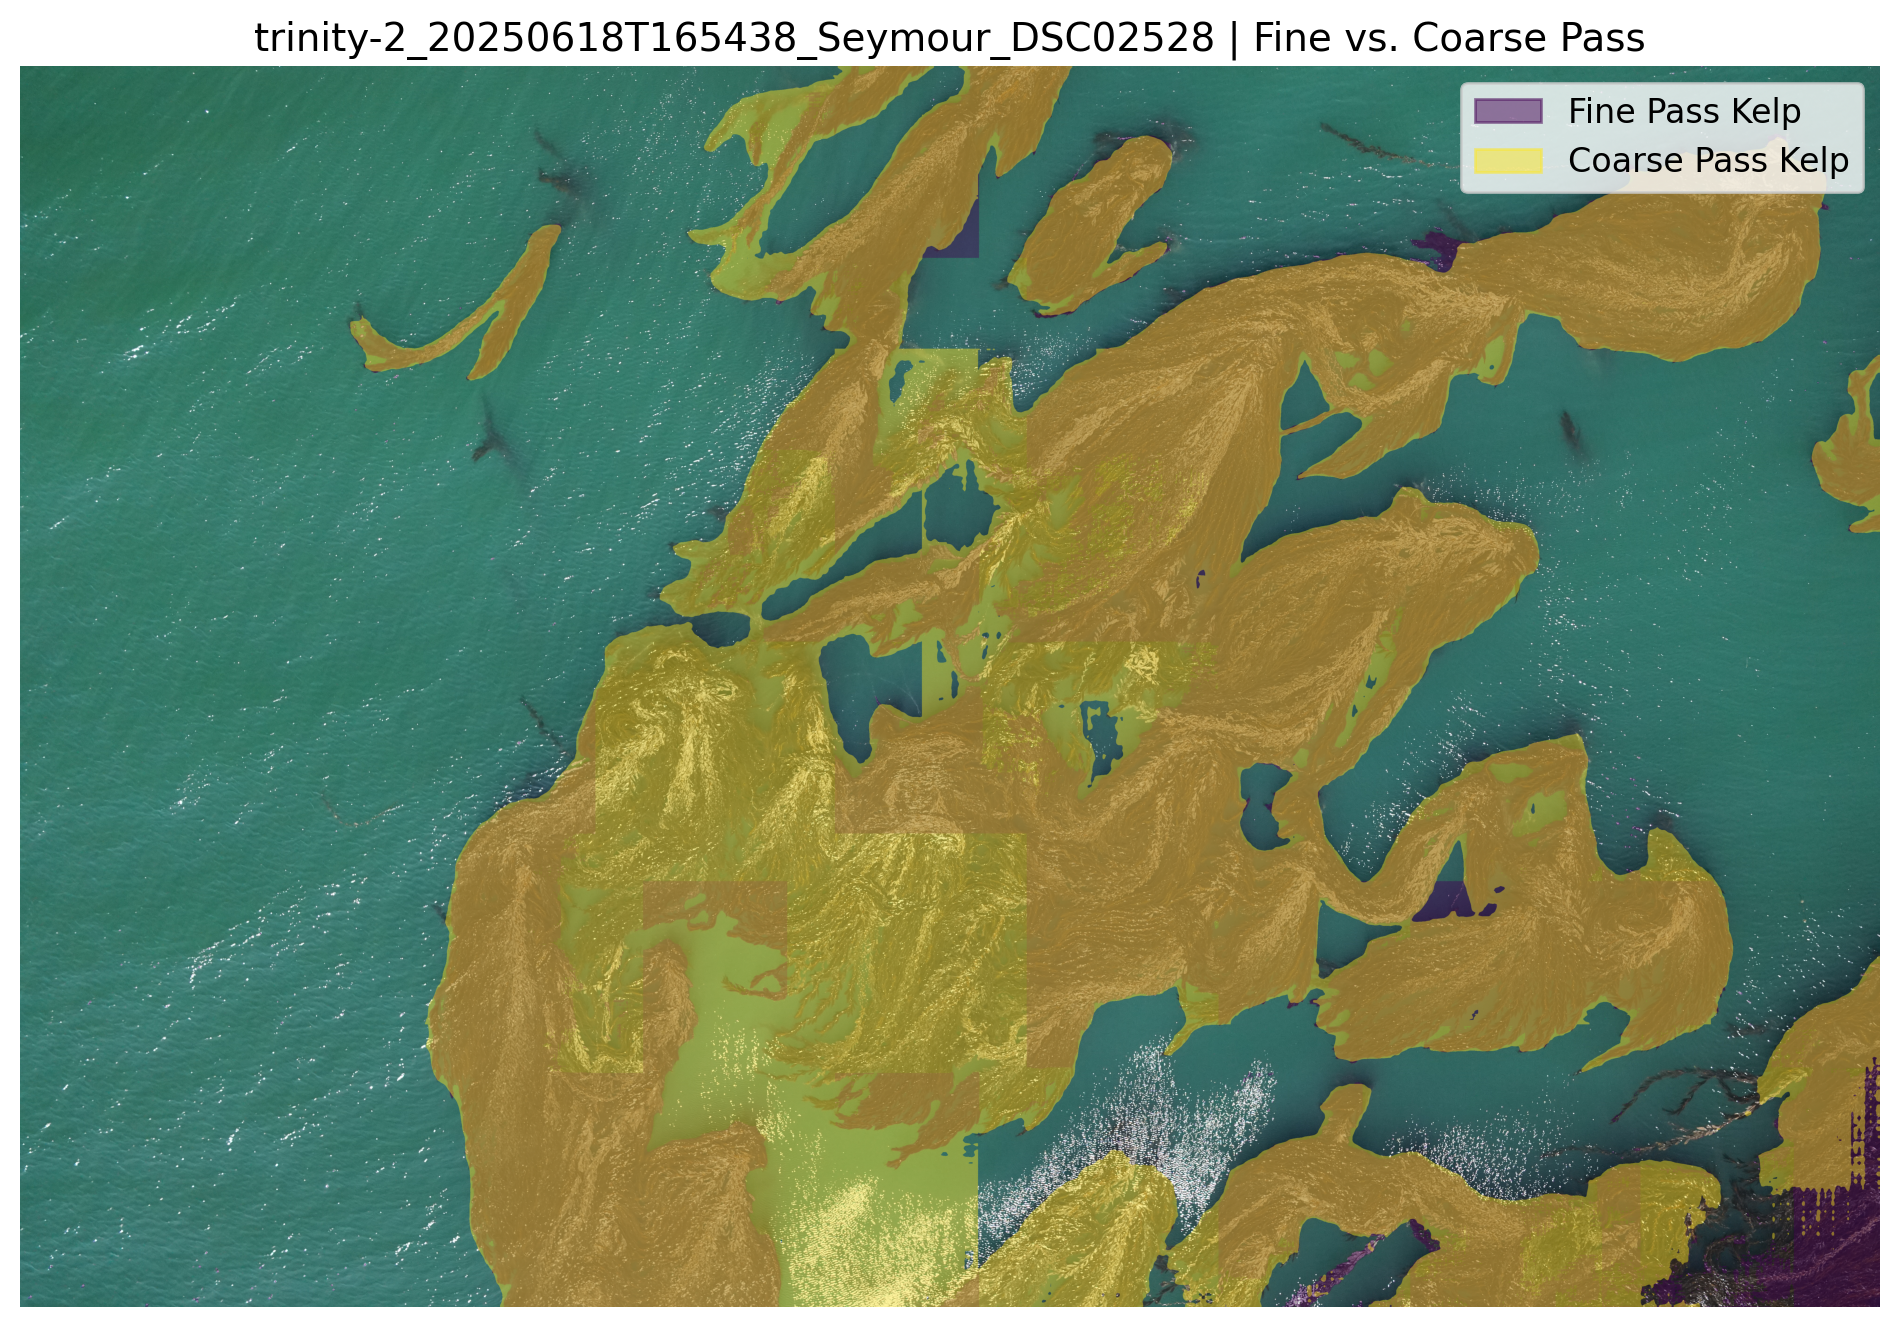
The tool first slices the image into smaller overlapping tiles. For each slice, the pipeline uses the calibrated water color to find pixels that are a close match. These water-colored pixels are used as seed points for the SAM model and are used to generate slice segmentations. This process also utilizes a hierarchical two-pass system (coarse and fine) to ensure both large bodies of water and small gaps are accurately captured.
utilizing a hierarchical two-pass approach is optional but recommended for more accurate results
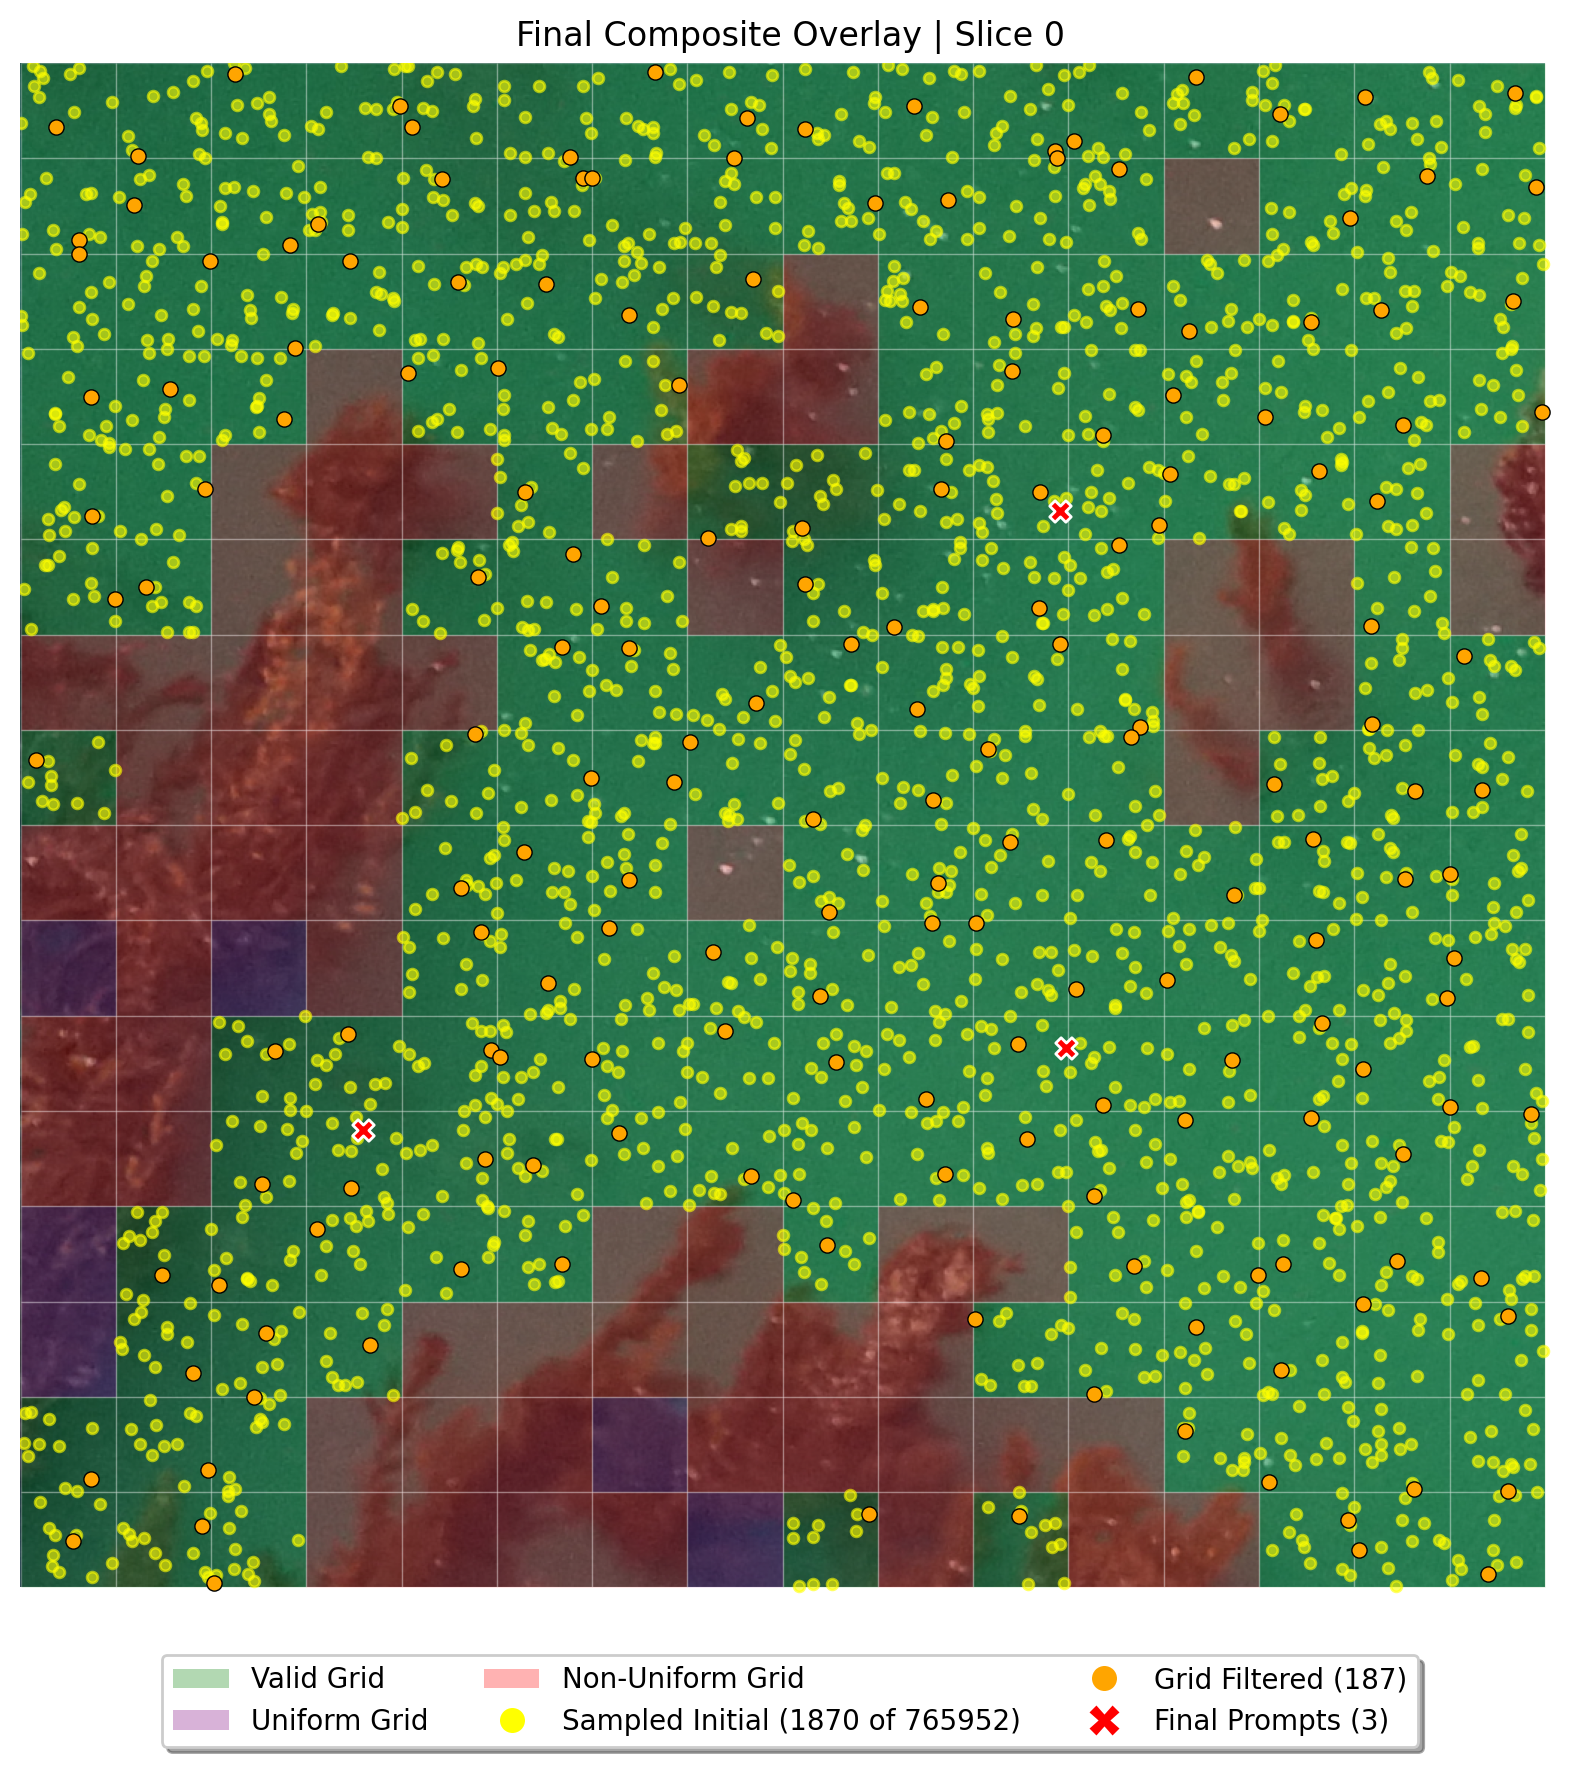
Debug image showcasing the point selection.
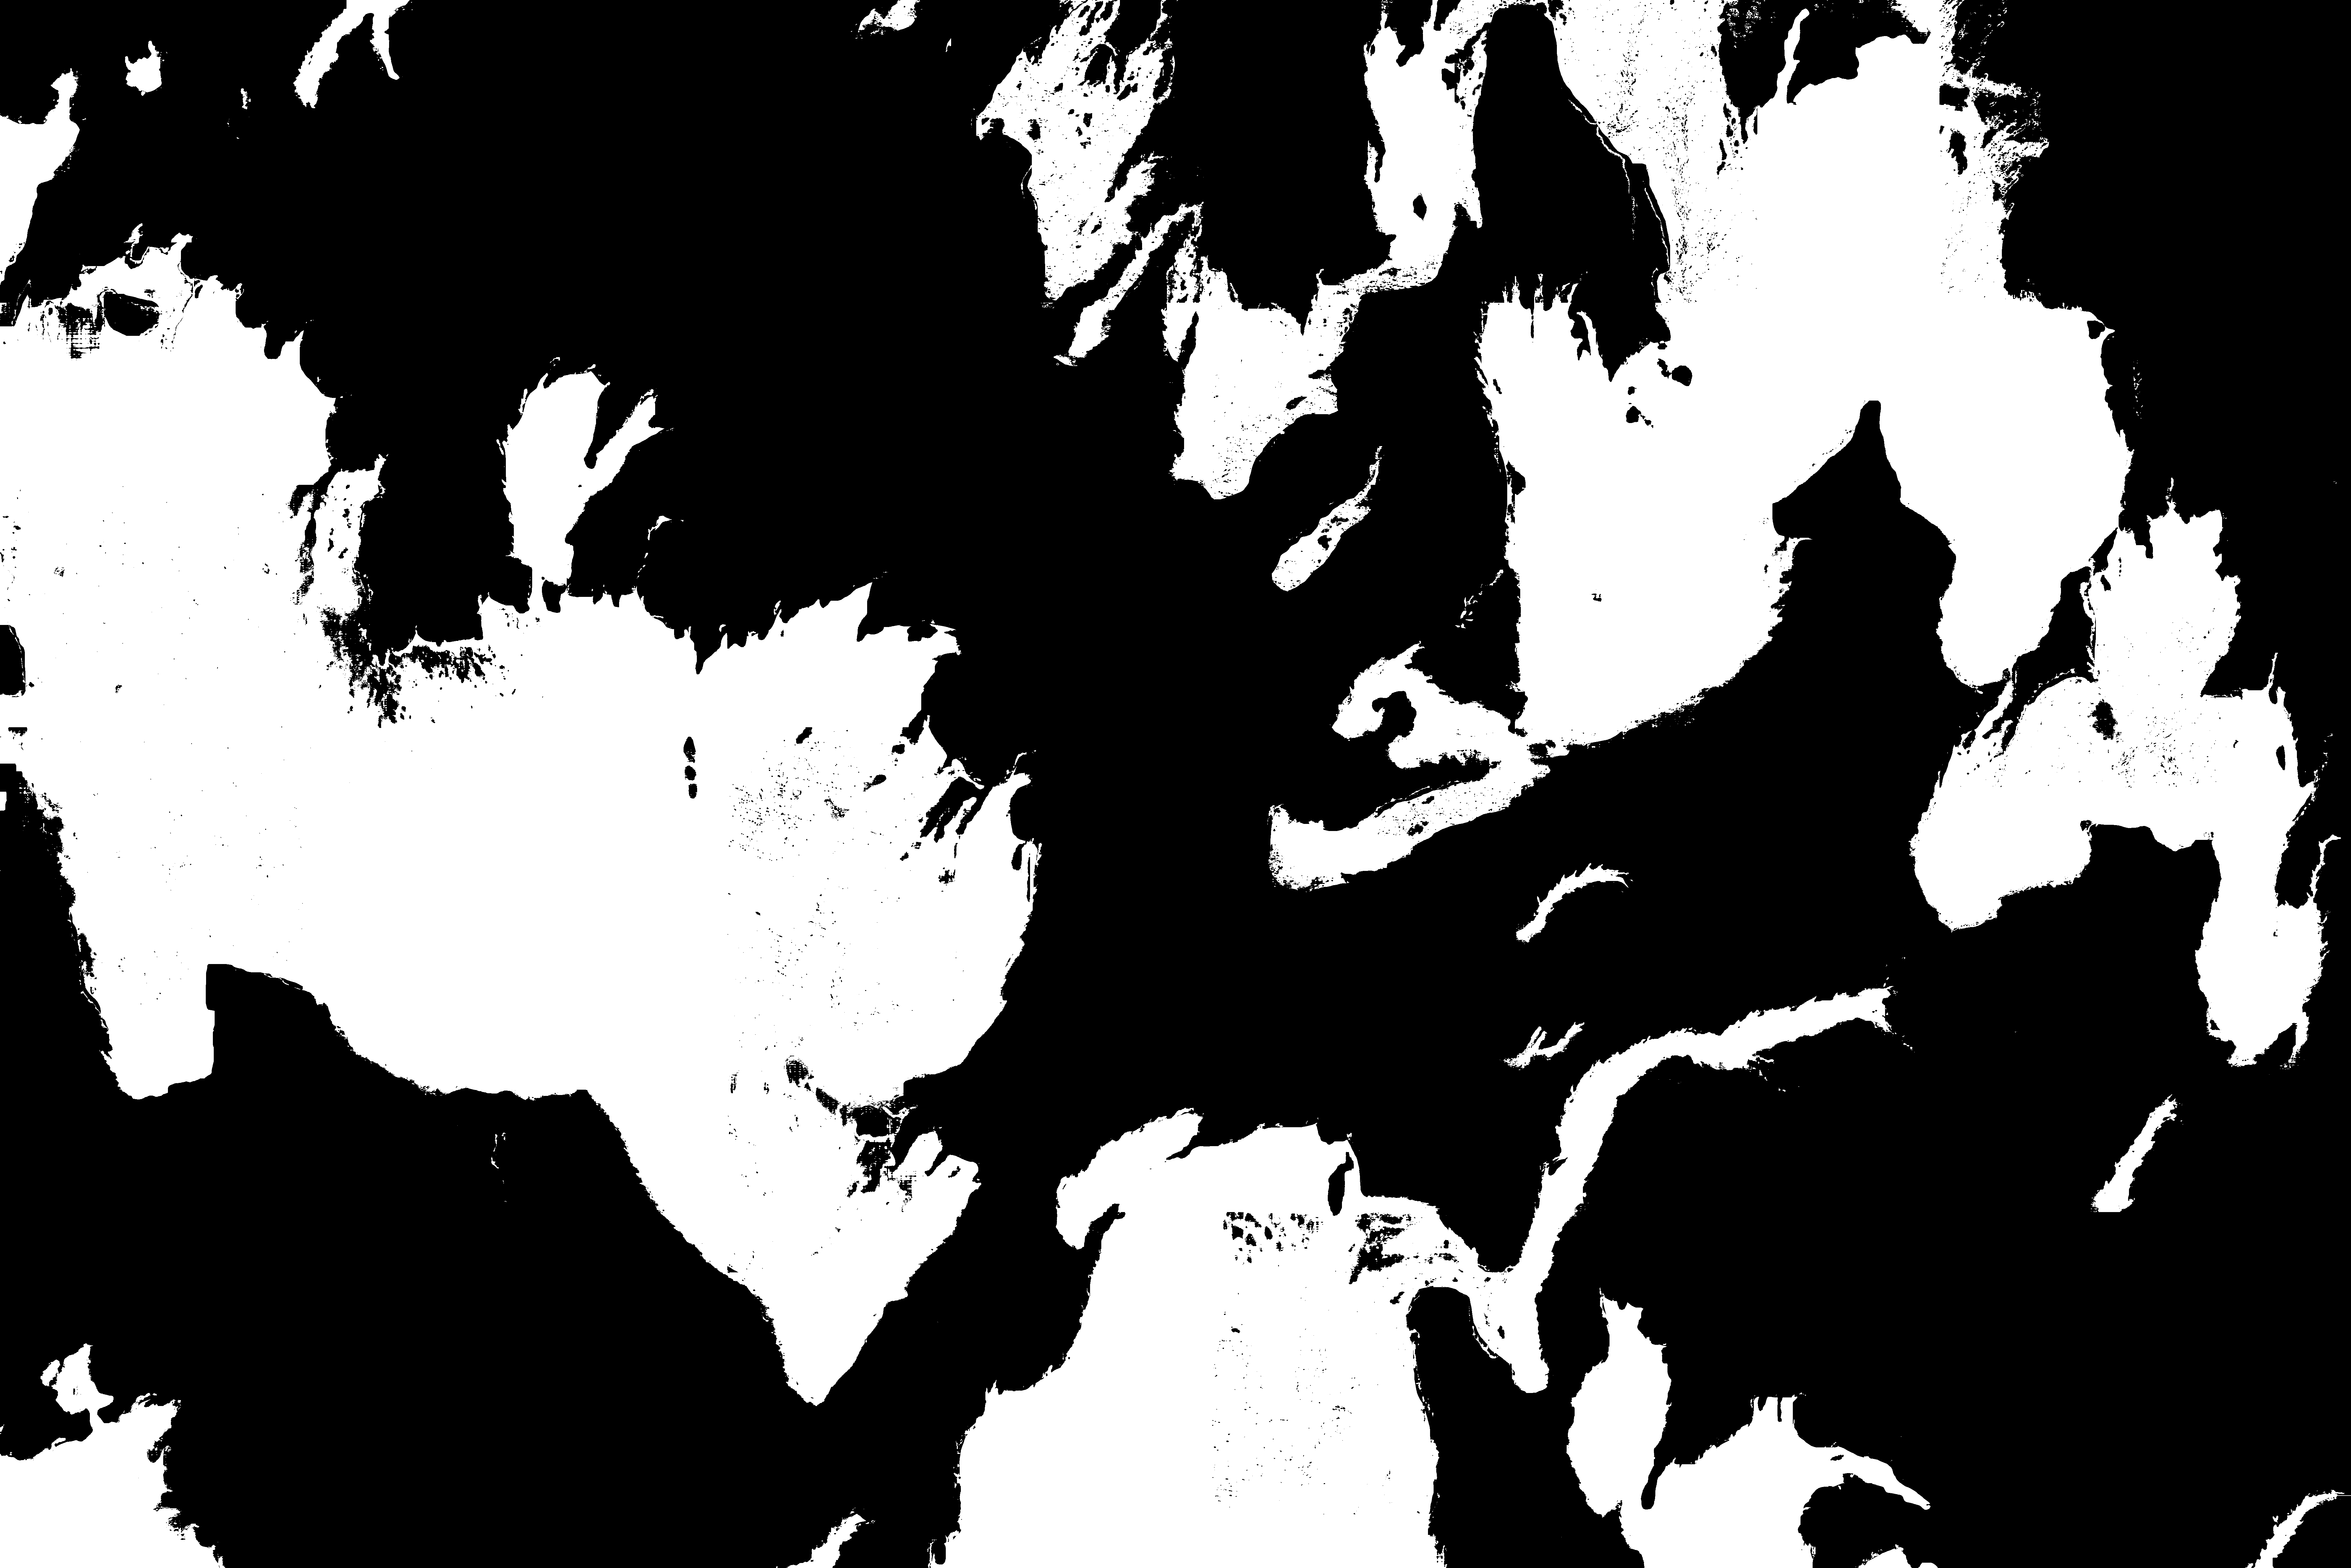
3. Merging and Reconstruction
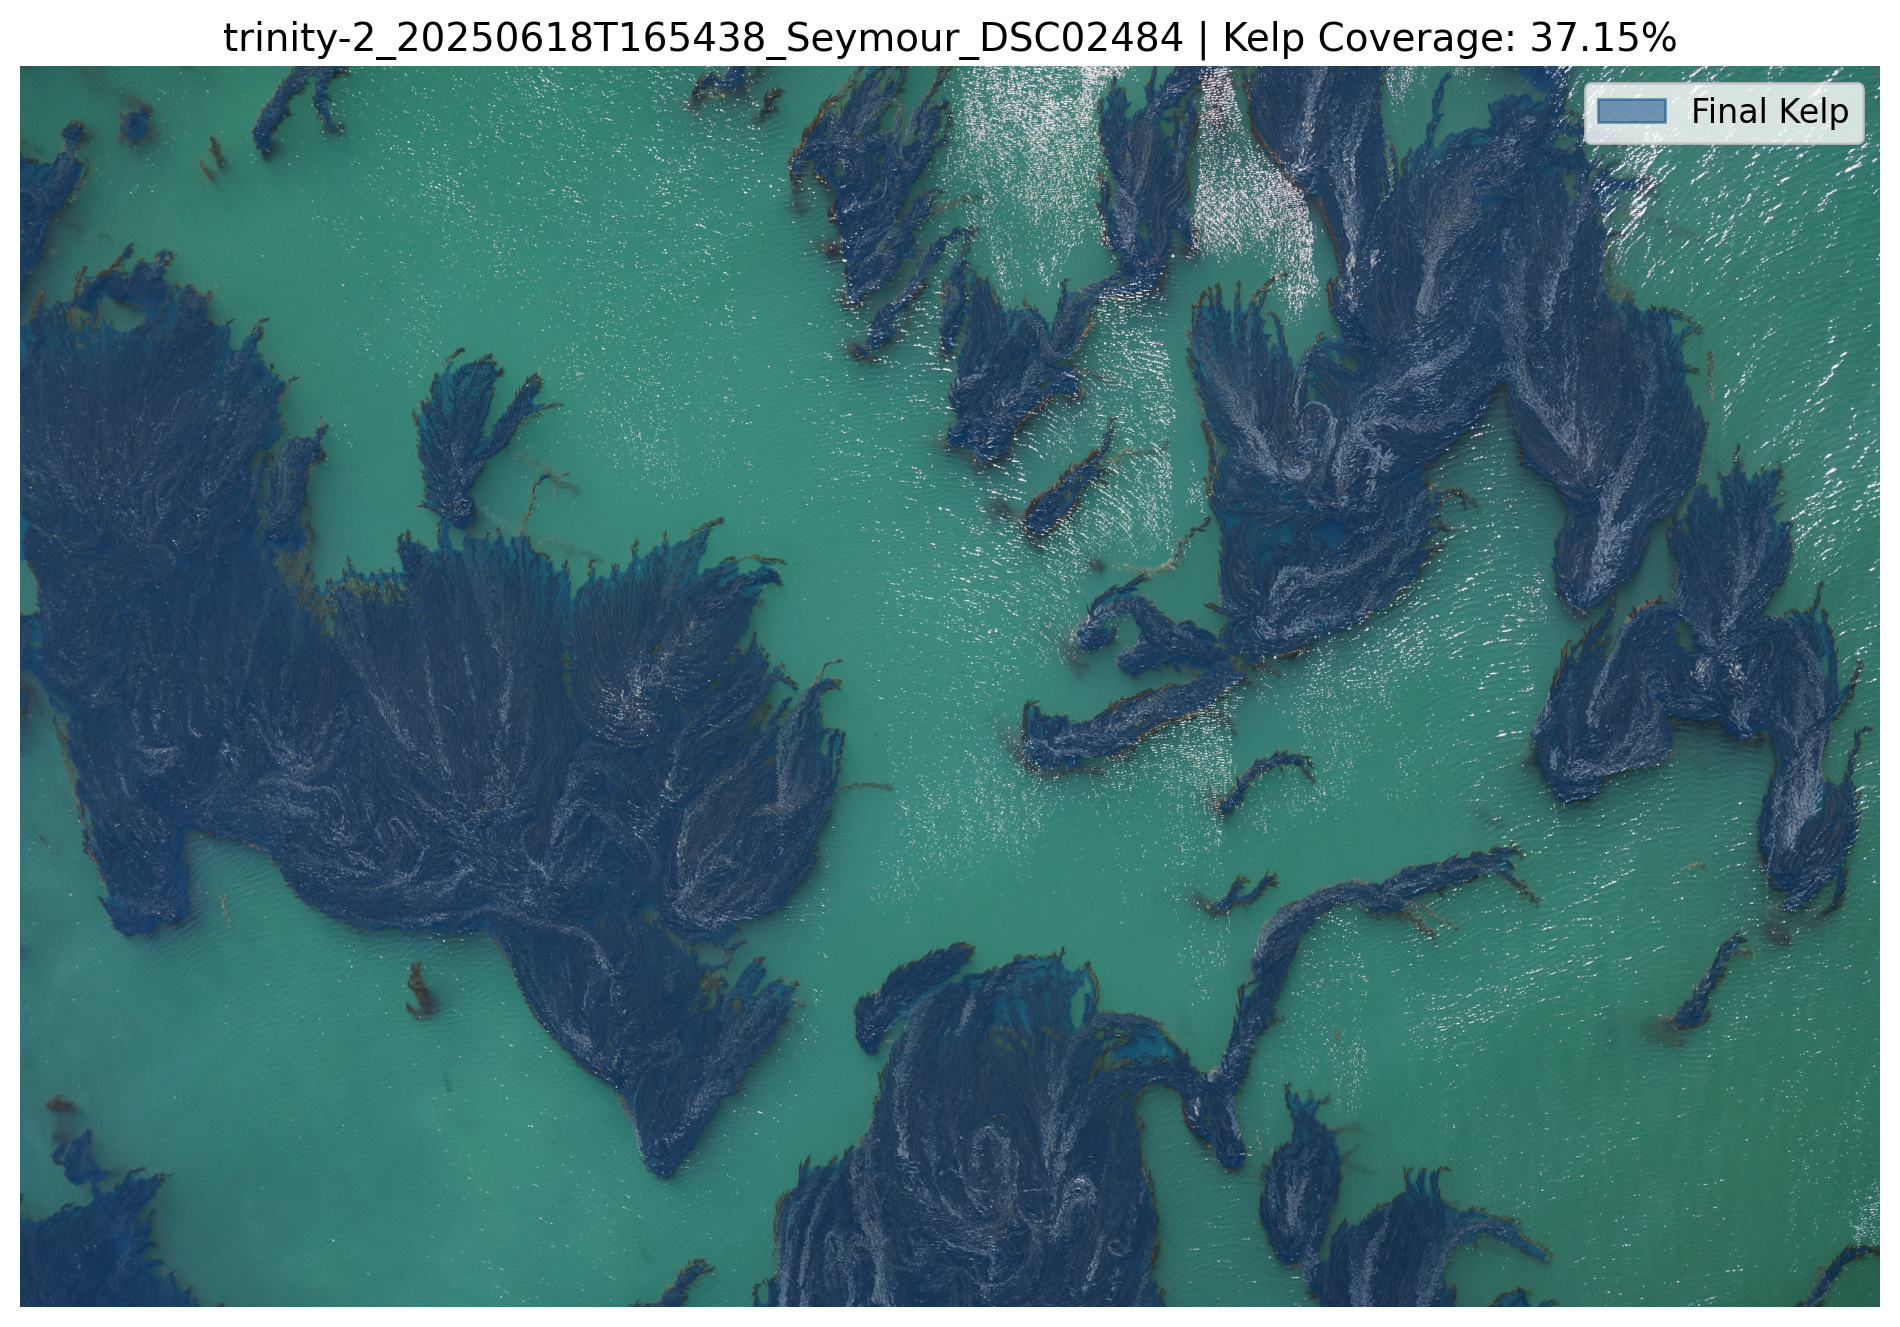
After all slices are processed they are merged and inverted to create a full resolution kelp segmentation mask.
Output Files and Directory Structure
The tool organizes all outputs into a results/ directory. Each analysis run is stored in a subdirectory named with a unique hash of the run parameters, ensuring that results from different settings don't overwrite each other.
results/
├── debug/
│   └── trinity-2..._slice_0_thresh20_stage1_grid_validation.png
│   └── trinity-2..._slice_0_thresh20_stage2_point_selection.png
│   └── ... (more debug images)
├── heatmap/
│   └── 20241220T190455_heatmap.png
├── trinity-2_20241220T190455/
│   └── 89bb41f9/
│       ├── results.json
│       ├── masks/
│       │   └── trinity-2..._kelp_mask.png
│       └── visualizations/
│           └── trinity-2..._overlay.png
│           └── ... (more viz images)
└── pixel_values.csv
results.json
This is the main output file, containing the command used, all run parameters, and a list of results for each processed image, including its name, ID, geolocation, and the final calculated kelp coverage percentage.
{
    "command": "kelp-coverage analyze --site trinity-2_20241220T190455...",
    "run_args": {
        "command": "analyze",
        "hierarchical": true,
        "slice_size": 1024,
        "hierarchical_slice_size": 4096,
        "threshold": 20,
        "use_erosion_merge": true,
        "use_color_validation": true,
        "...": "..."
    },
    "results": [
        {
            "image_name": "trinity-2_20241220T190455_NewBrighton_DSC01634.JPG",
            "image_id": 162986,
            "latitude": 36.97335830004439,
            "longitude": -121.94042791898332,
            "coverage_percentage": 0.0
        },
        "..."
    ]
}
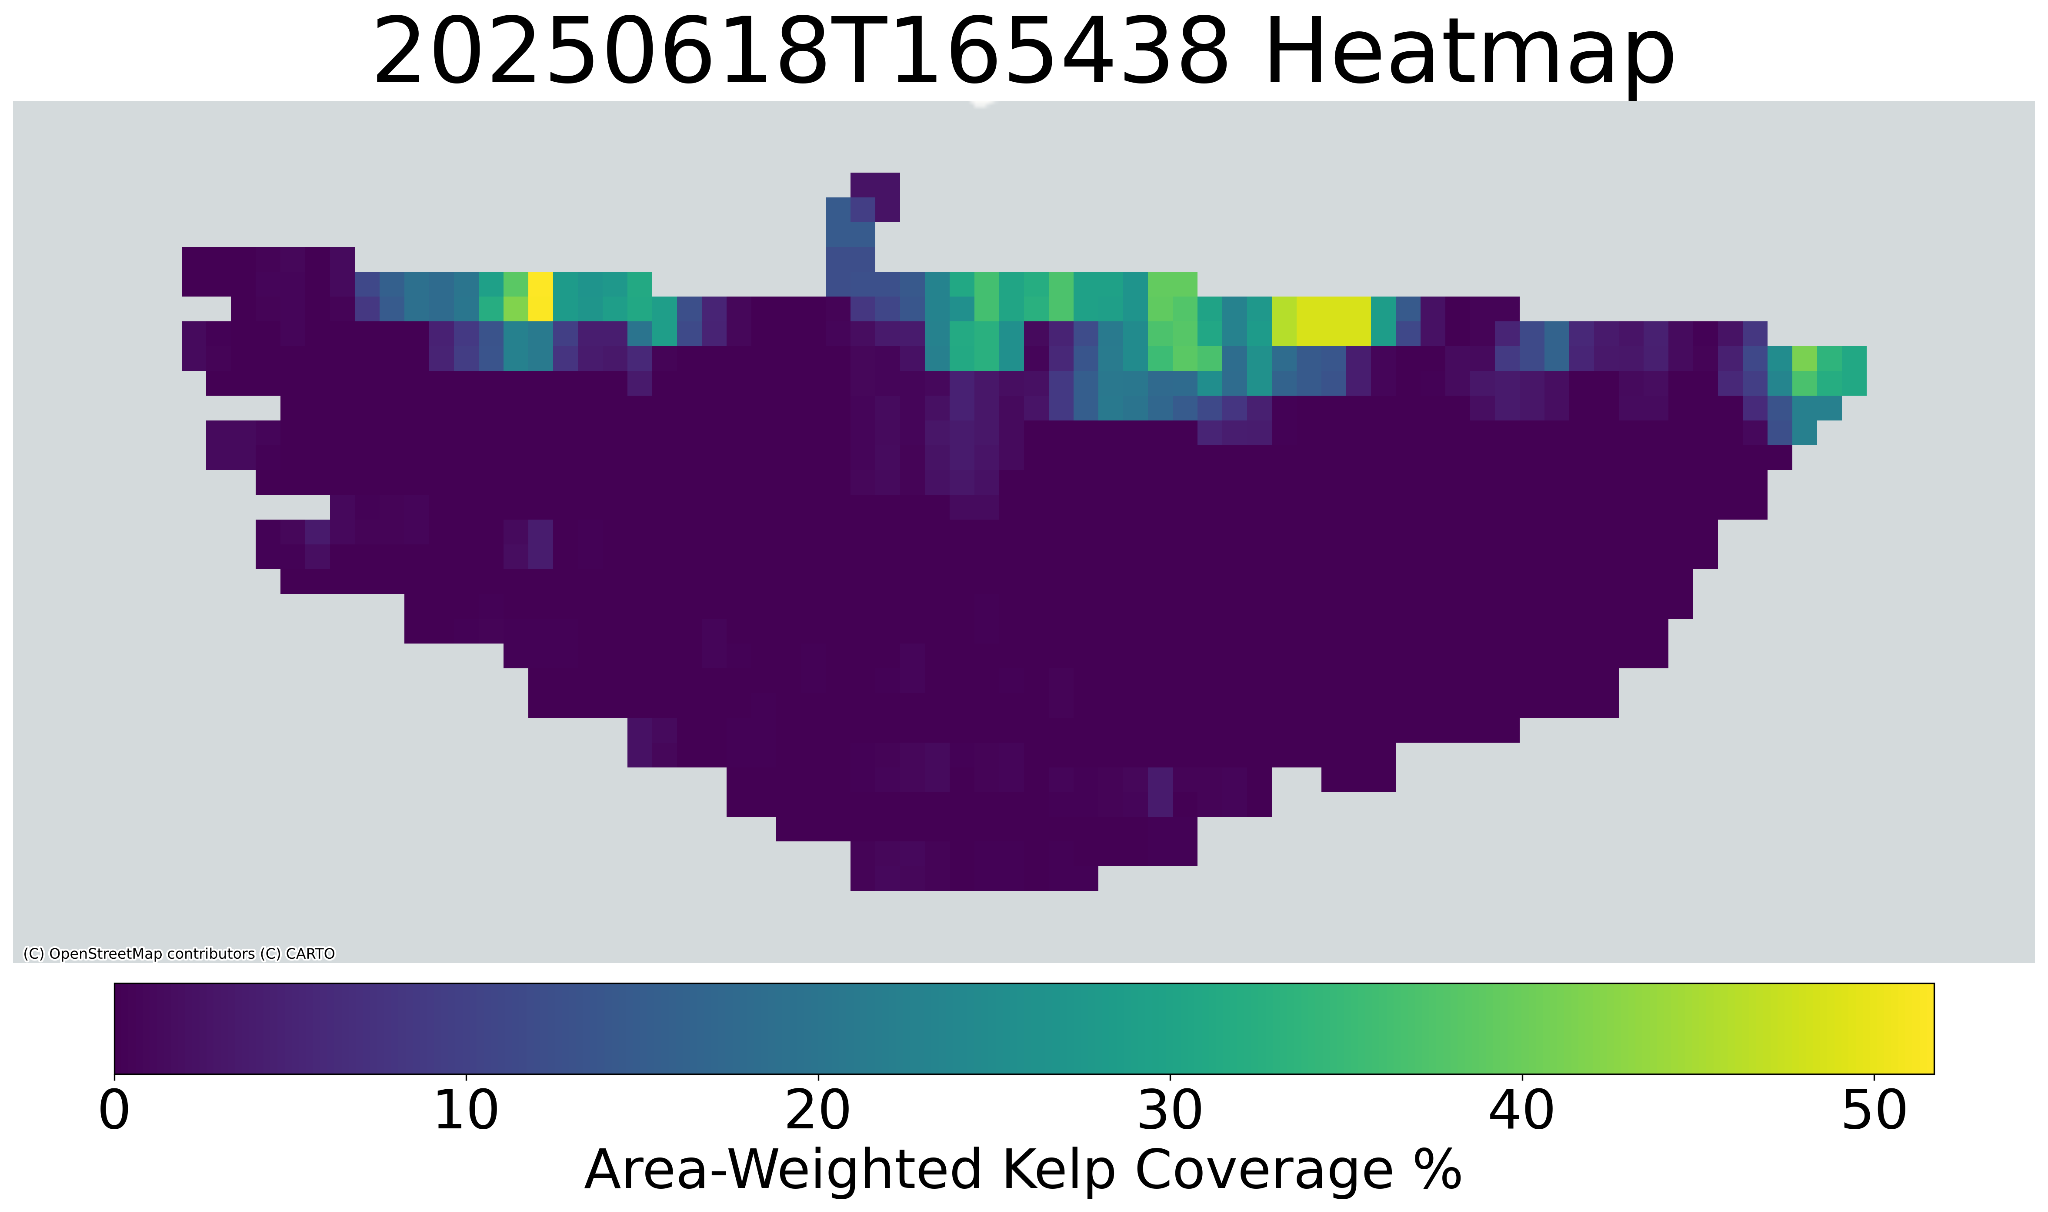
Geospatial Heatmap
You can also generate a georeferenced heatmap to get a spatial overview of kelp density across a site.
results/heatmap/ directory.
Examples
Standard Workflow:
-
Setup: Download 5 images per site from a csv containing Tator metadata.
kelp-coverage setup \
--tator-csv all_sites_metadata.csv \
--tator-token <your_api_token> \
--images 5
-
Analysis: Run analysis on a single site.
kelp-coverage analyze \
  --site "trinity-2_20241220T190455" \
  --tator-csv all_sites_metadata.csv \
  --hierarchical \
  --generate-overlay
-
Debug a problematic image:
kelp-coverage debug-slice \
  --site "trinity-2_20241220T190455" \
  --image-path "/content/images/trinity-2_20241220T190455/trinity-2_20241220T190455_NewBrighton_DSC01645.JPG" \
  --slice-index 42 \
  --visualize-stages \
  --heatmap
-
Create a heatmap from results:
kelp-coverage heatmap --coverage-data "/content/results/trinity-2_20241220T190455/4005f6fd/results.json" --show-points
Command Reference
setup
Downloads images via Tator and computes representative water pixel values for each site.
kelp-coverage setup --tator-csv <path_to_metadata.csv> --tator-token <your_api_token> [options]
Arguments:
--tator-csv <path>: (Required) Path to the image CSV file.--tator-token <token>: (Required) API token for Tator.--images <int>: Number of images to download per site. -1 for all images (default).--start-idx <int>/--end-idx <int>: Optional start/end index from the CSV to process.--visualize: Display histograms of the LAB color channels for each site.
analyze
Run the kelp segmentation analysis.
kelp-coverage analyze --site <site_name> --tator-csv <path_to_metadata.csv> [options]
Key Arguments:
--site <name>: Specify a single site to process. Processes all sites if omitted.--tator-csv <path>: (Required) Path to the CSV to link results with metadata.--images <filenames>: A comma-separated list of specific image filenames to process.--count <int>: Number of images to randomly select and process from each site. -1 for all (default).--coverage-only: Only compute and save coverage values (fastest).--overwrite: Overwrite existing results for a site.--verbose, -v: Verbose output.
Hierarchical Method:
--hierarchical / --no-hierarchical: Use a two-pass hierarchical method (default: enabled).--hierarchical-slice-size <int>: Slice size for the coarse pass (default: 4096).--use-erosion-merge / --no-use-erosion-merge: Use erosion on the coarse mask (default: enabled).--use-color-validation / --no-use-color-validation: Use color validation to merge masks (default: enabled).
Visualization:
--generate-overlay: Generate a transparent overlay of the kelp mask on the original image.--generate-slice-viz: Generate a grid visualization of all slices.--generate-erosion-viz: Generate a visualization of the erosion merge effect.--generate-merge-viz: Generate a heatmap visualization of the disagreement area during mask merging.--generate-component-viz: Generate a visualization of the fine and coarse masks overlayed.
debug-slice
Debug the program on a particular slice(s).
kelp-coverage debug-slice --image-path <path_to_image.JPG> --slice-index <index> --site <site_name> [options]
Arguments:
--image-path <path>: (Required) One or more full paths to images to debug.--slice-index <indices>: (Required) One or more slice indices to debug.--site <name>: (Required) Site name.--heatmap: Generate threshold visualization of color distances.--visualize-stages: Visualize the point filtering pipeline step-by-step.
heatmap
Generates a spatial heatmap from a resulting json file.
kelp-coverage heatmap --coverage-data <path_to_results.json> [options]
Arguments:
--coverage-data <path>: (Required) Path to the results.json file from an analysis run.--output <path>: Path to save the output heatmap image.--grid-size <int>: Size of heatmap grid cells (default: 30).--show-grid-values: Show numerical coverage values on the grid cells.--show-points: Show the location of data points on the map.--show-point-labels: Show labels for the data points.


Download files
Download the file for your platform. If you're not sure which to choose, learn more about installing packages.
Source Distribution
Built Distribution
Filter files by name, interpreter, ABI, and platform.
If you're not sure about the file name format, learn more about wheel file names.
Copy a direct link to the current filters
File details
Details for the file kelp_coverage-1.0.1.tar.gz.
File metadata
- Download URL: kelp_coverage-1.0.1.tar.gz
- Upload date:
- Size: 49.3 MB
- Tags: Source
- Uploaded using Trusted Publishing? No
- Uploaded via: twine/6.1.0 CPython/3.13.5
File hashes
| Algorithm | Hash digest | |
|---|---|---|
| SHA256 |
21322b74fc0d43c18ea110f82a82b6d2d8b8b904e2cc807846ceea1e7049069f
|
|
| MD5 |
2052592d16f51777676efd4d9dc3e30f
|
|
| BLAKE2b-256 |
19e6ba47e3365b88fecc2730b52c646b09214c528d1c4508aaf247370e2d4f3e
|
File details
Details for the file kelp_coverage-1.0.1-py3-none-any.whl.
File metadata
- Download URL: kelp_coverage-1.0.1-py3-none-any.whl
- Upload date:
- Size: 34.3 kB
- Tags: Python 3
- Uploaded using Trusted Publishing? No
- Uploaded via: twine/6.1.0 CPython/3.13.5
File hashes
| Algorithm | Hash digest | |
|---|---|---|
| SHA256 |
6d3dcdfea8aed1be96f5528795690e3cee65119a20a0caaad50e23217d5eda91
|
|
| MD5 |
8e3a07c04f6a398e585d2db3adfb695a
|
|
| BLAKE2b-256 |
a3ab4b137516c81244c6b1c57df9ab01896bdceb37fb078c8ef27200ed6e3661
|


