Real-time GPU monitoring dashboard for DCGM Prometheus metrics


Project description
KempnerPulse

nvidia-smisays 100% GPU utilization - but are your tensor cores even active? KempnerPulse shows what's actually happening.
Real-time GPU monitoring dashboard for DCGM metrics. A single-file
Rich-based TUI that streams metrics from
dcgm-exporter via Prometheus HTTP
or directly from dcgmi dmon for high-resolution profiling (~100 ms),
and renders four interactive views in the terminal.
Features
- Fleet View : All GPUs at a glance: utilization, memory, power, temperature, PCIe/NVLink bandwidth, sparkline bars.
- Focus View : Deep dive into one GPU with per-metric sparkline history.
- Plot View : Stacked line charts across all GPUs.
- Job View : Running GPU compute processes with per-GPU metrics.
- Real Utilization : Weighted composite metric from SM active, tensor pipe, DRAM active, and GR engine counters (customizable weights with presets for AI/ML, HPC, and memory-bound workflows).
- Workload Classification : 12-category status based on NVIDIA DCGM profiling metric guidance (idle, tensor-heavy compute, memory-bound, I/O, etc.).
- Health Monitoring : Temperature, PCIe replay errors, and ECC errors with color-coded alerts.
- SLURM/CUDA Aware : Automatically detects
CUDA_VISIBLE_DEVICES,SLURM_JOB_GPUS, etc. to show only your allocated GPUs. - Direct DCGM Backend :
--backend dcgmqueriesdcgmi dmondirectly, bypassing dcgm-exporter for true high-resolution sampling. Automatically resolves physical GPU IDs inside SLURM cgroups. - Zero Dependencies beyond Python 3.9+ and
rich.
Screenshots
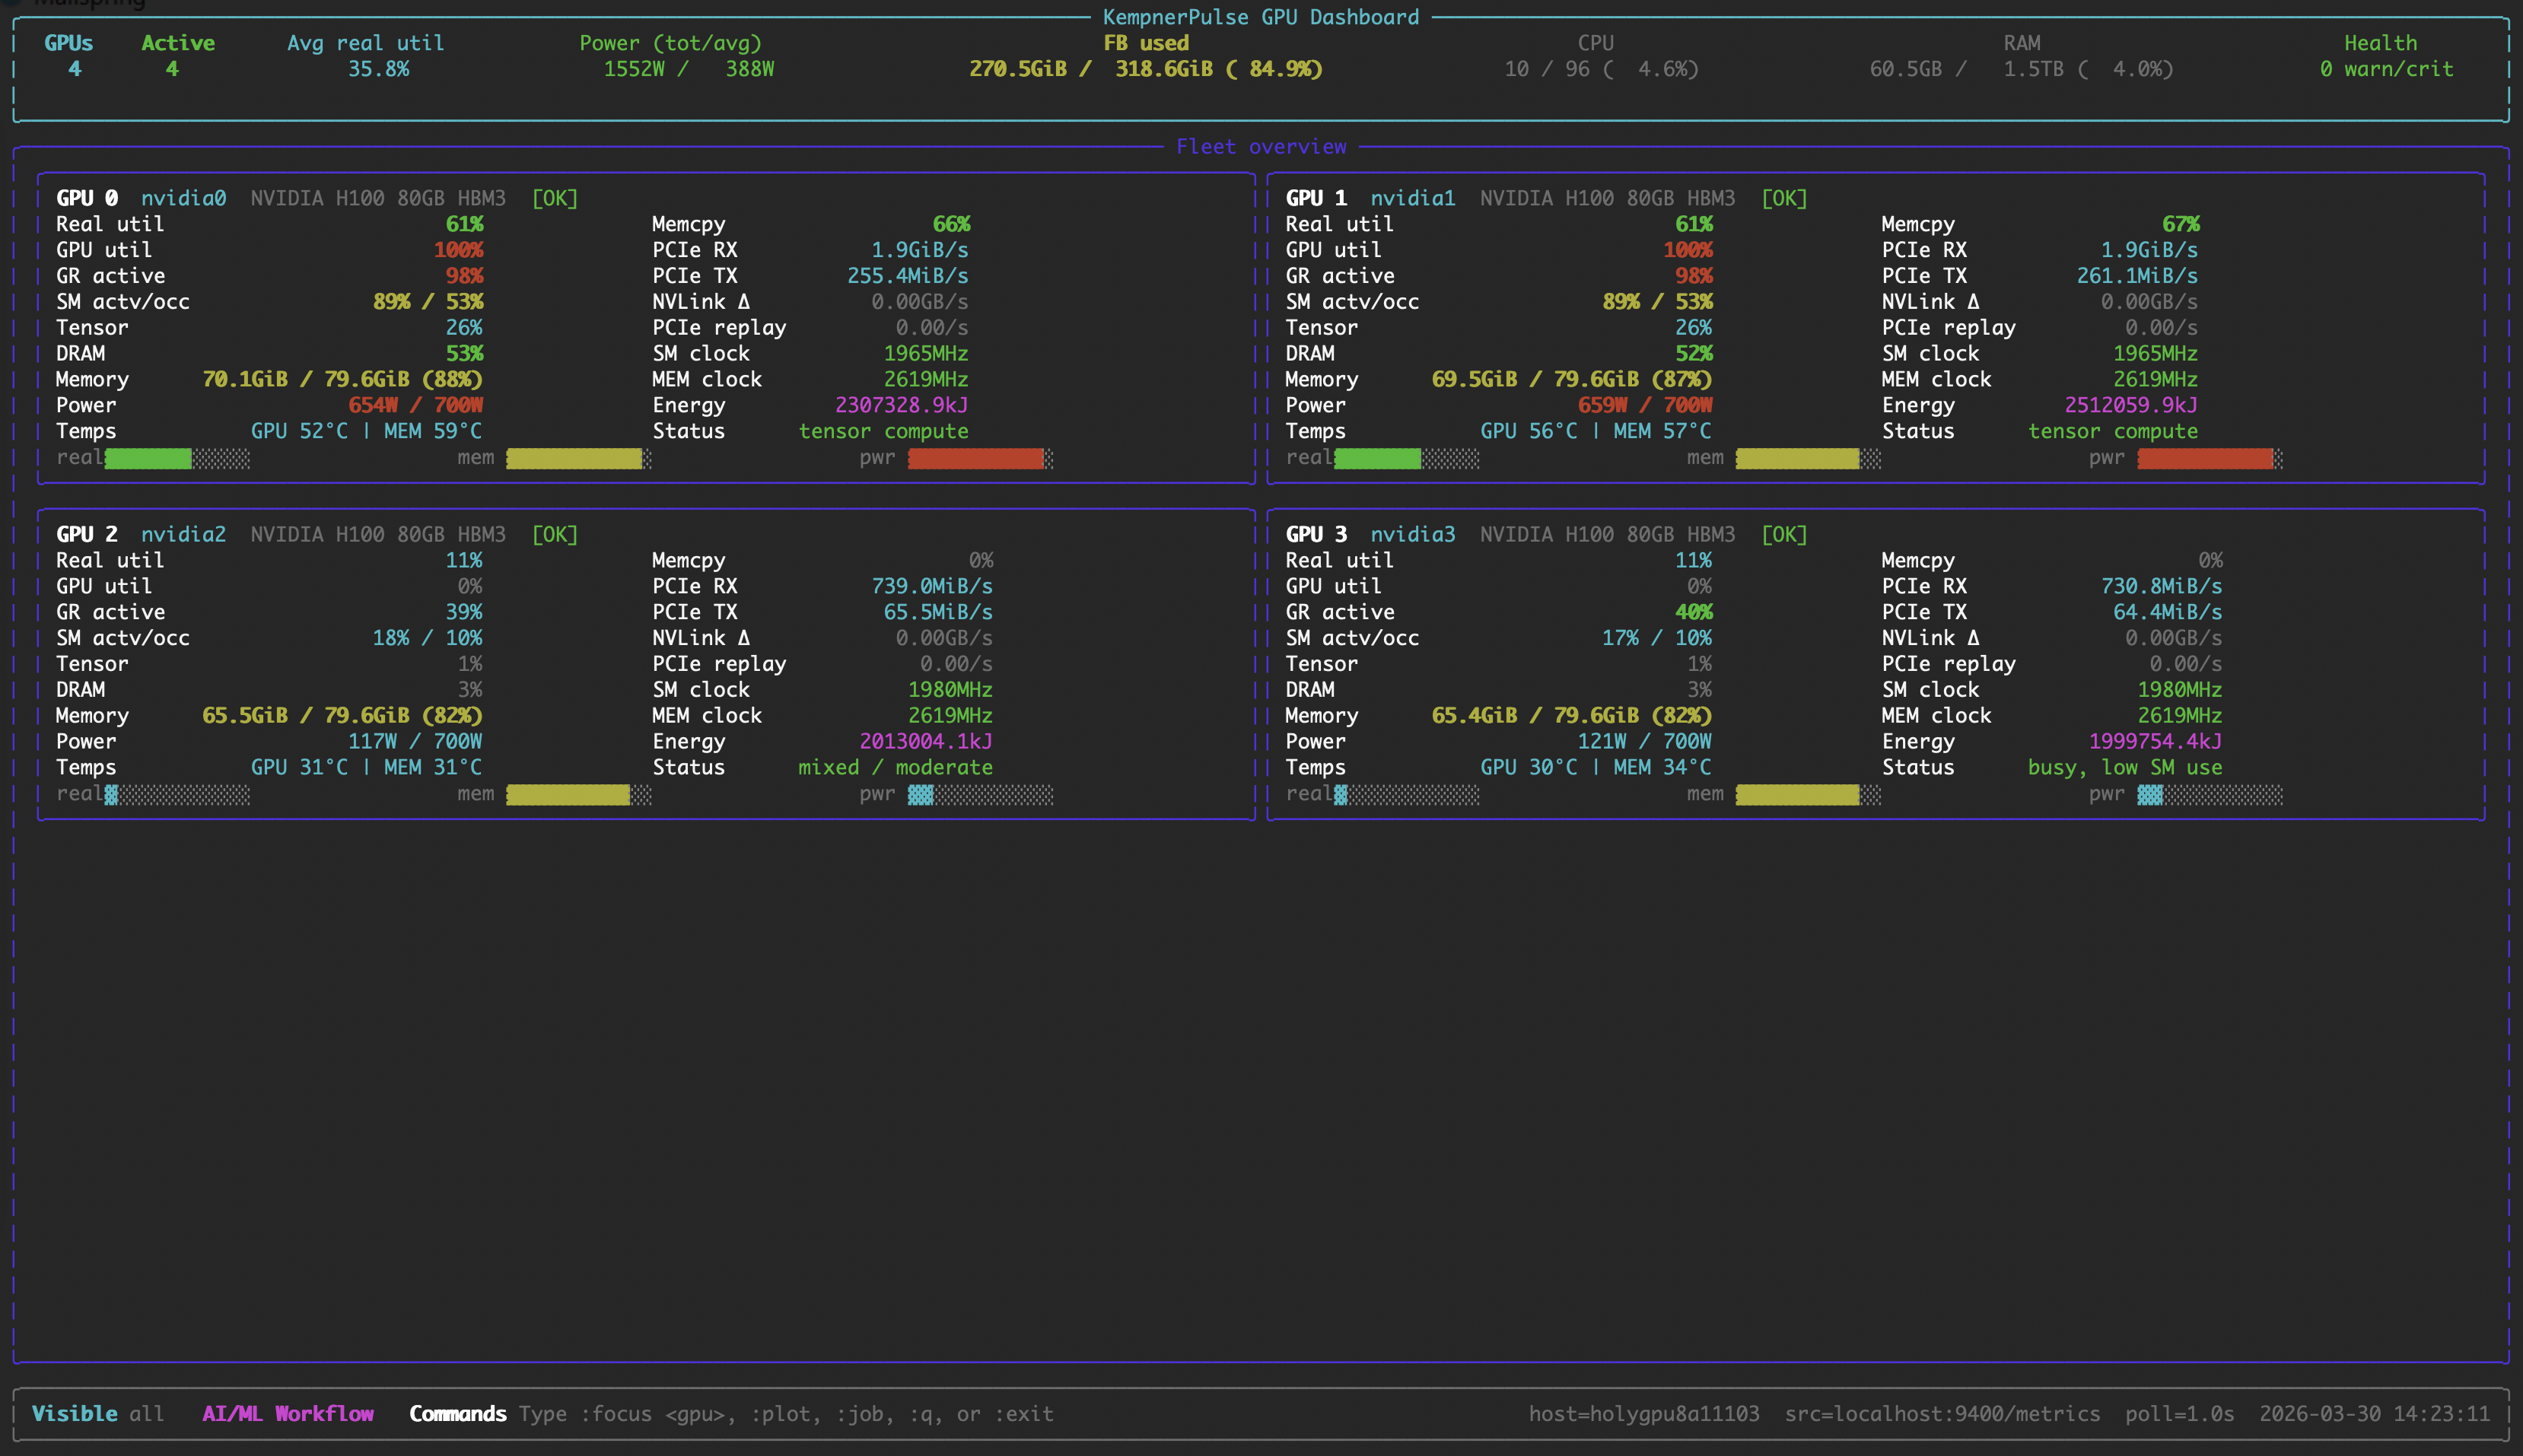
Fleet View
All GPUs at a glance with utilization bars, memory, power, temperature, and bandwidth.
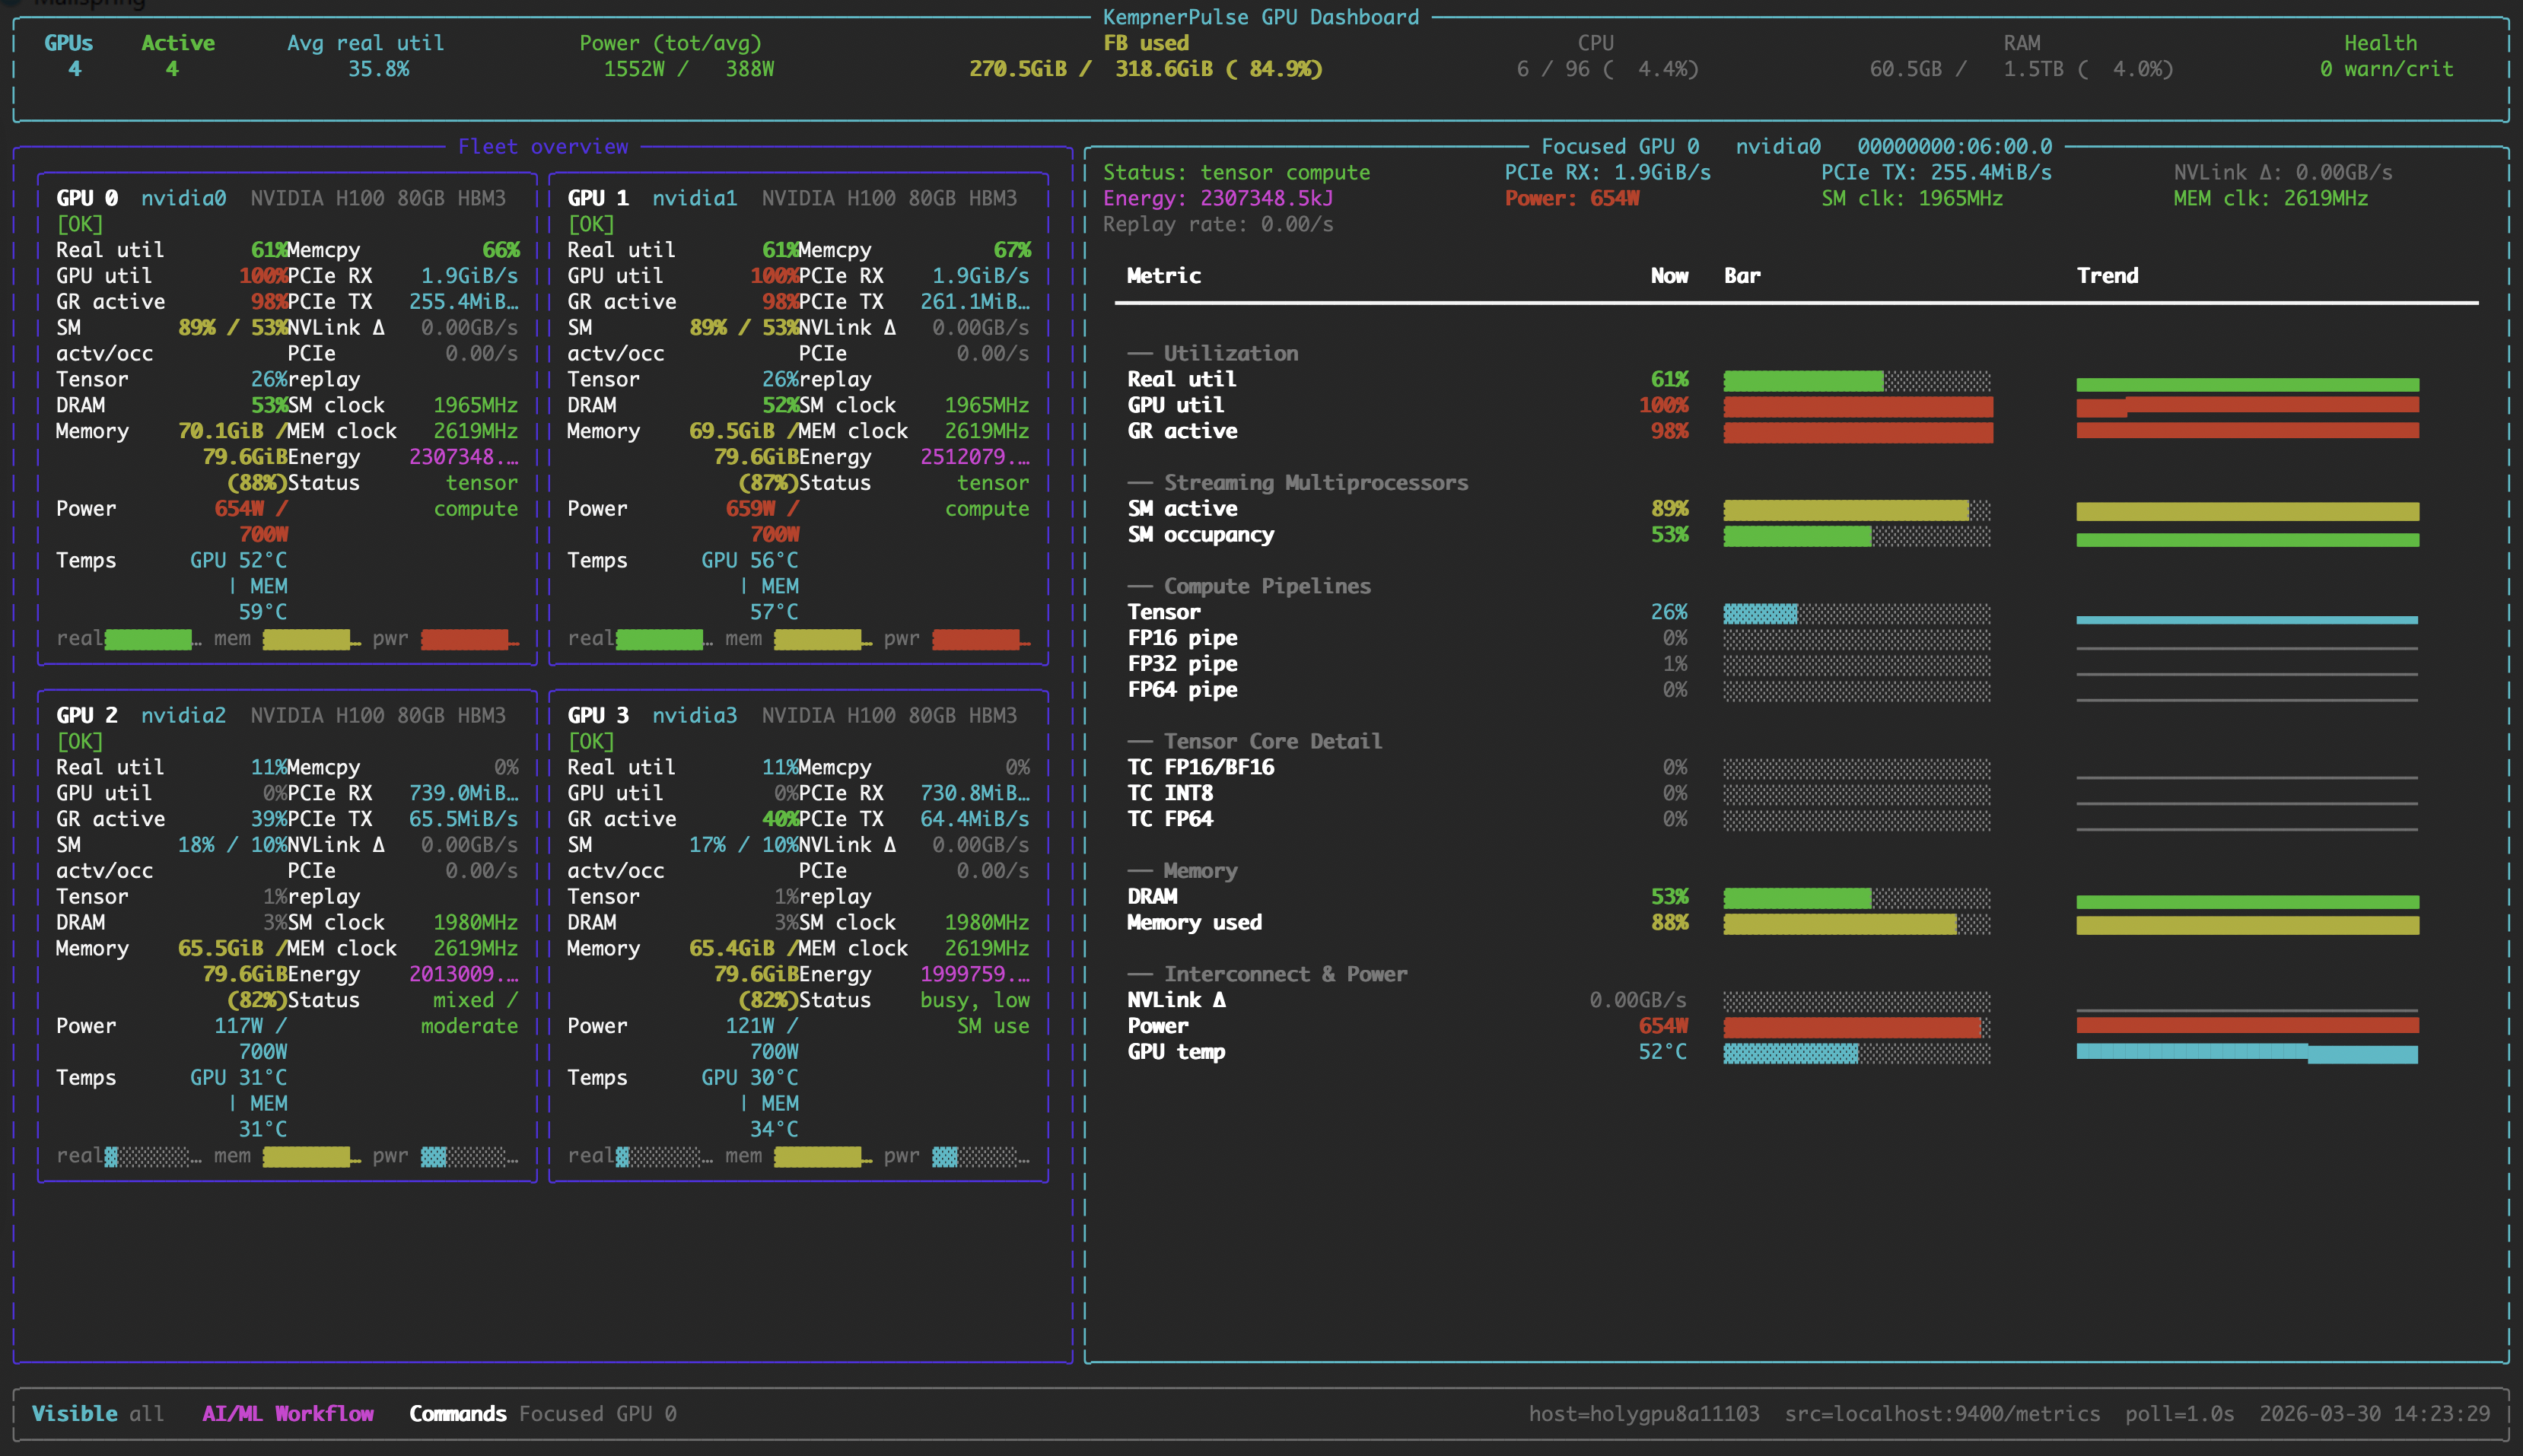
Focus View
Deep dive into a single GPU with per-metric sparkline history.
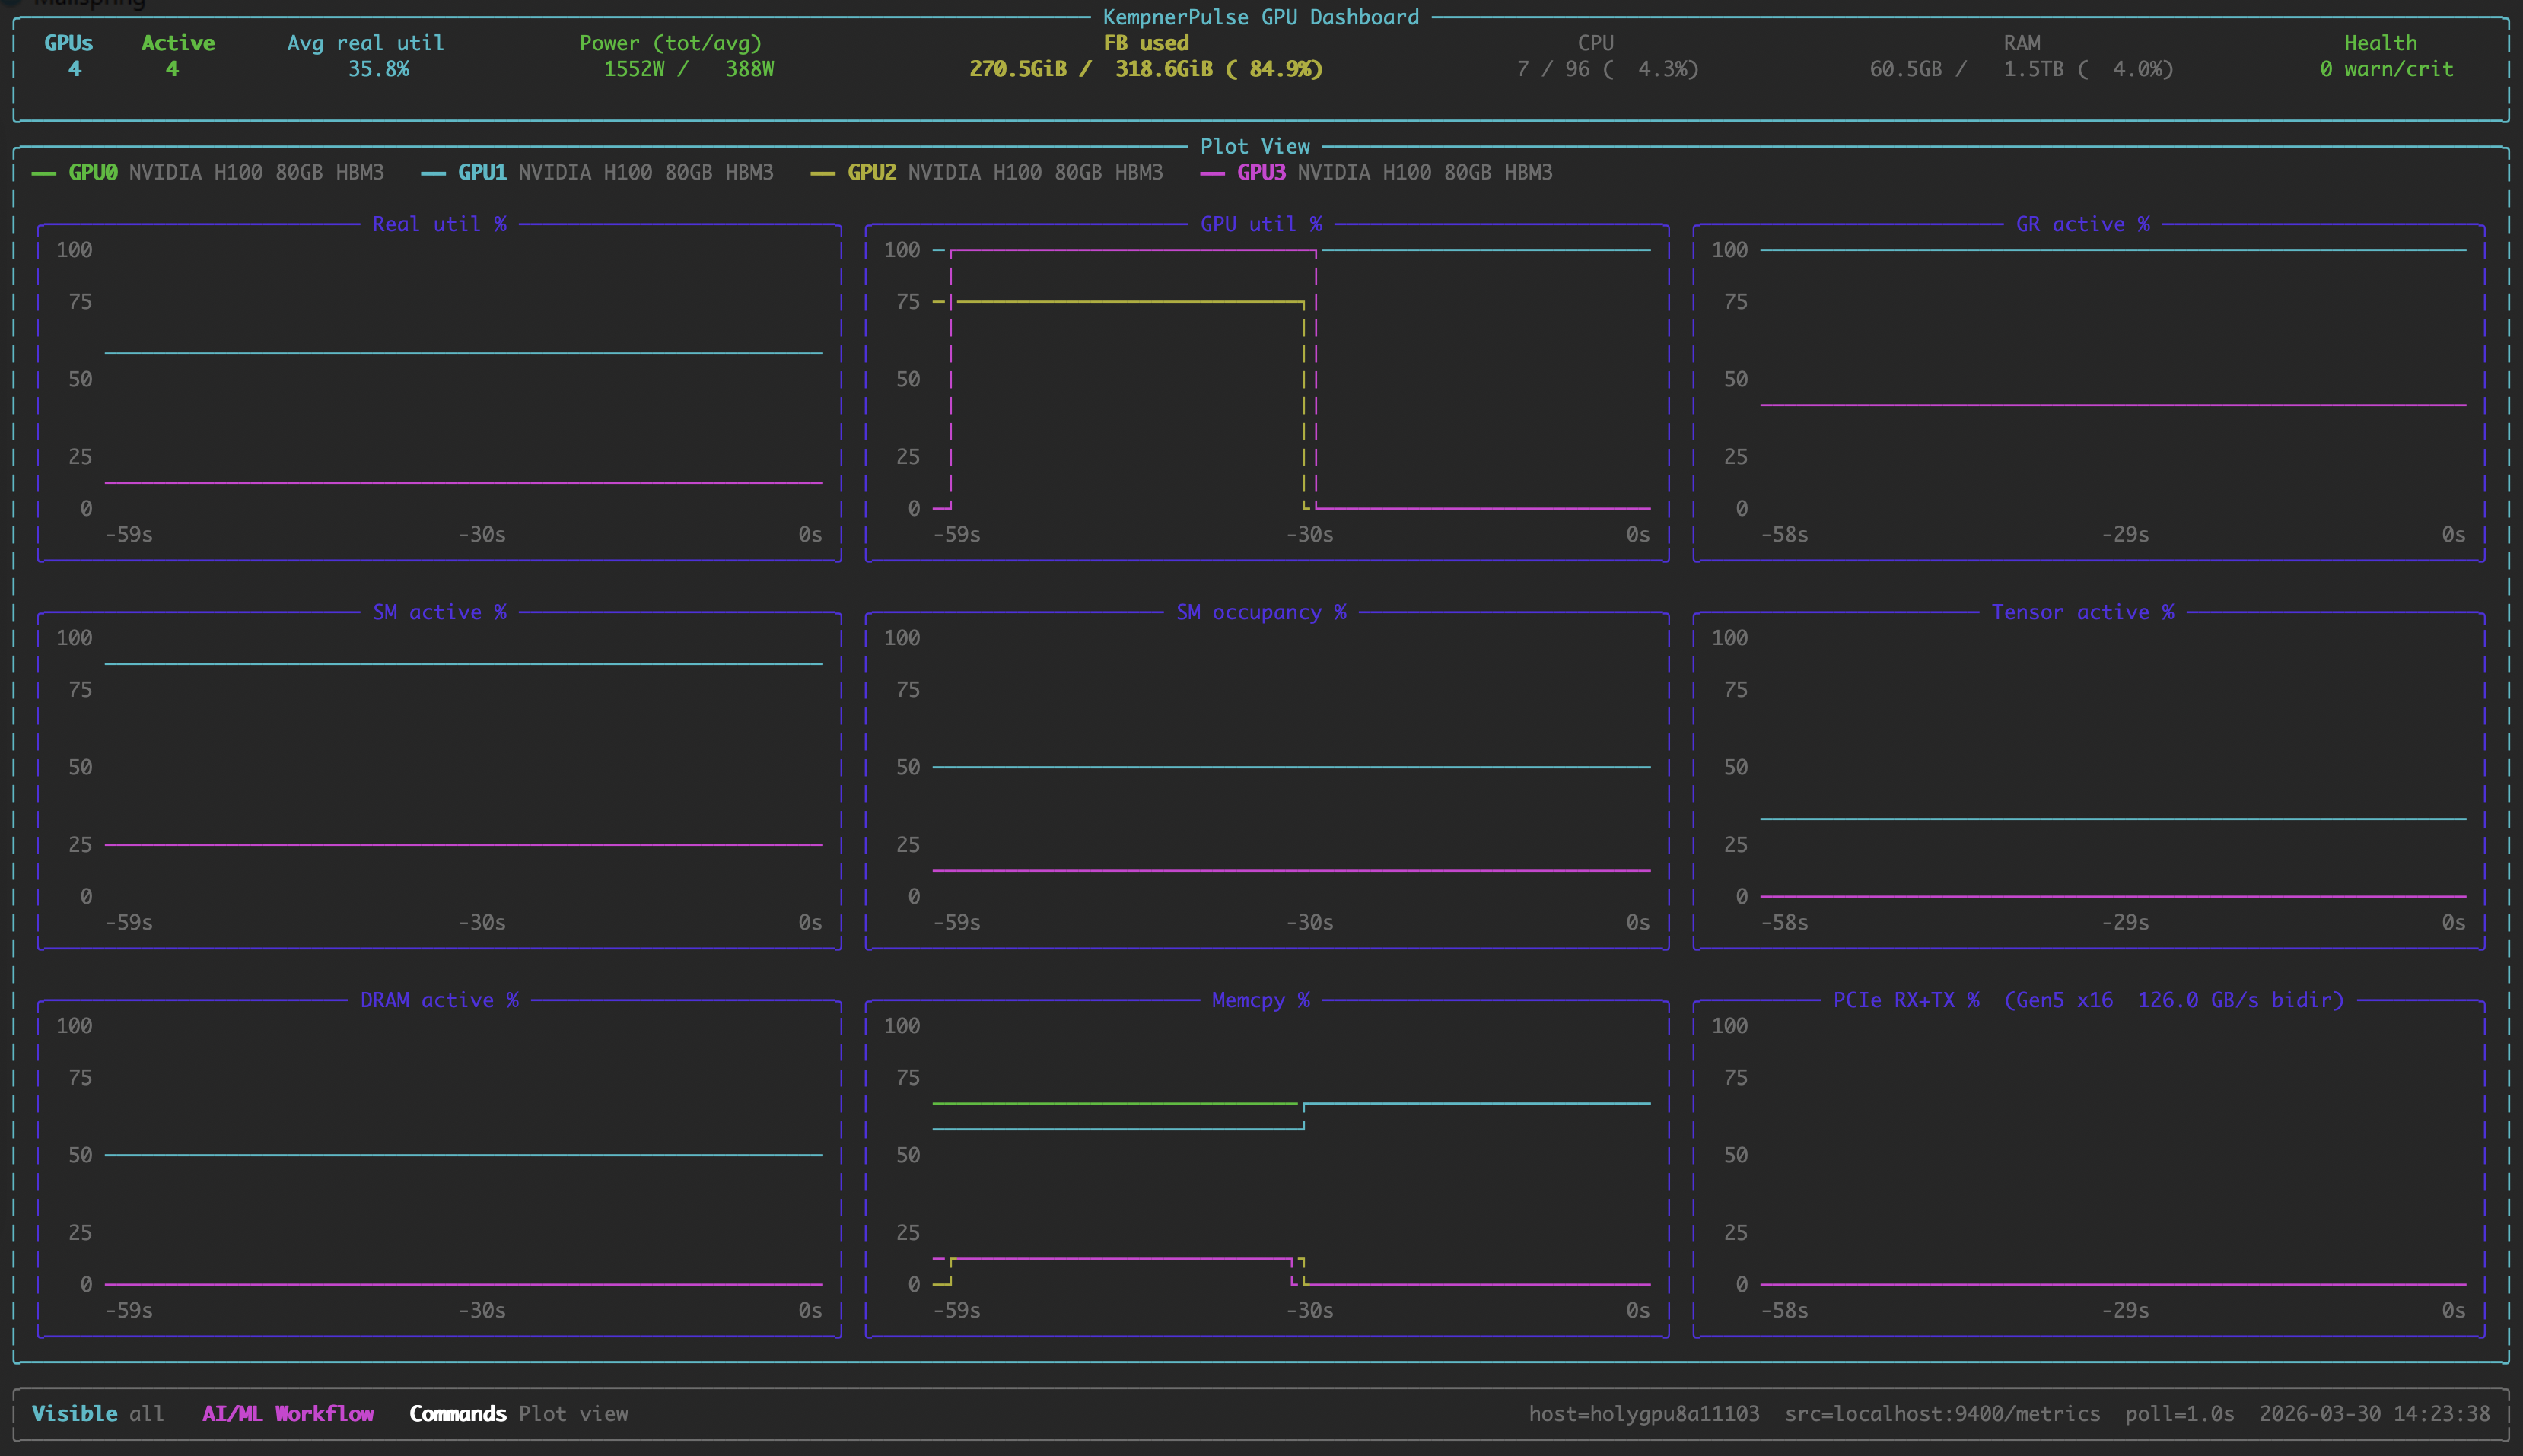
Plot View
Stacked line charts across all GPUs.
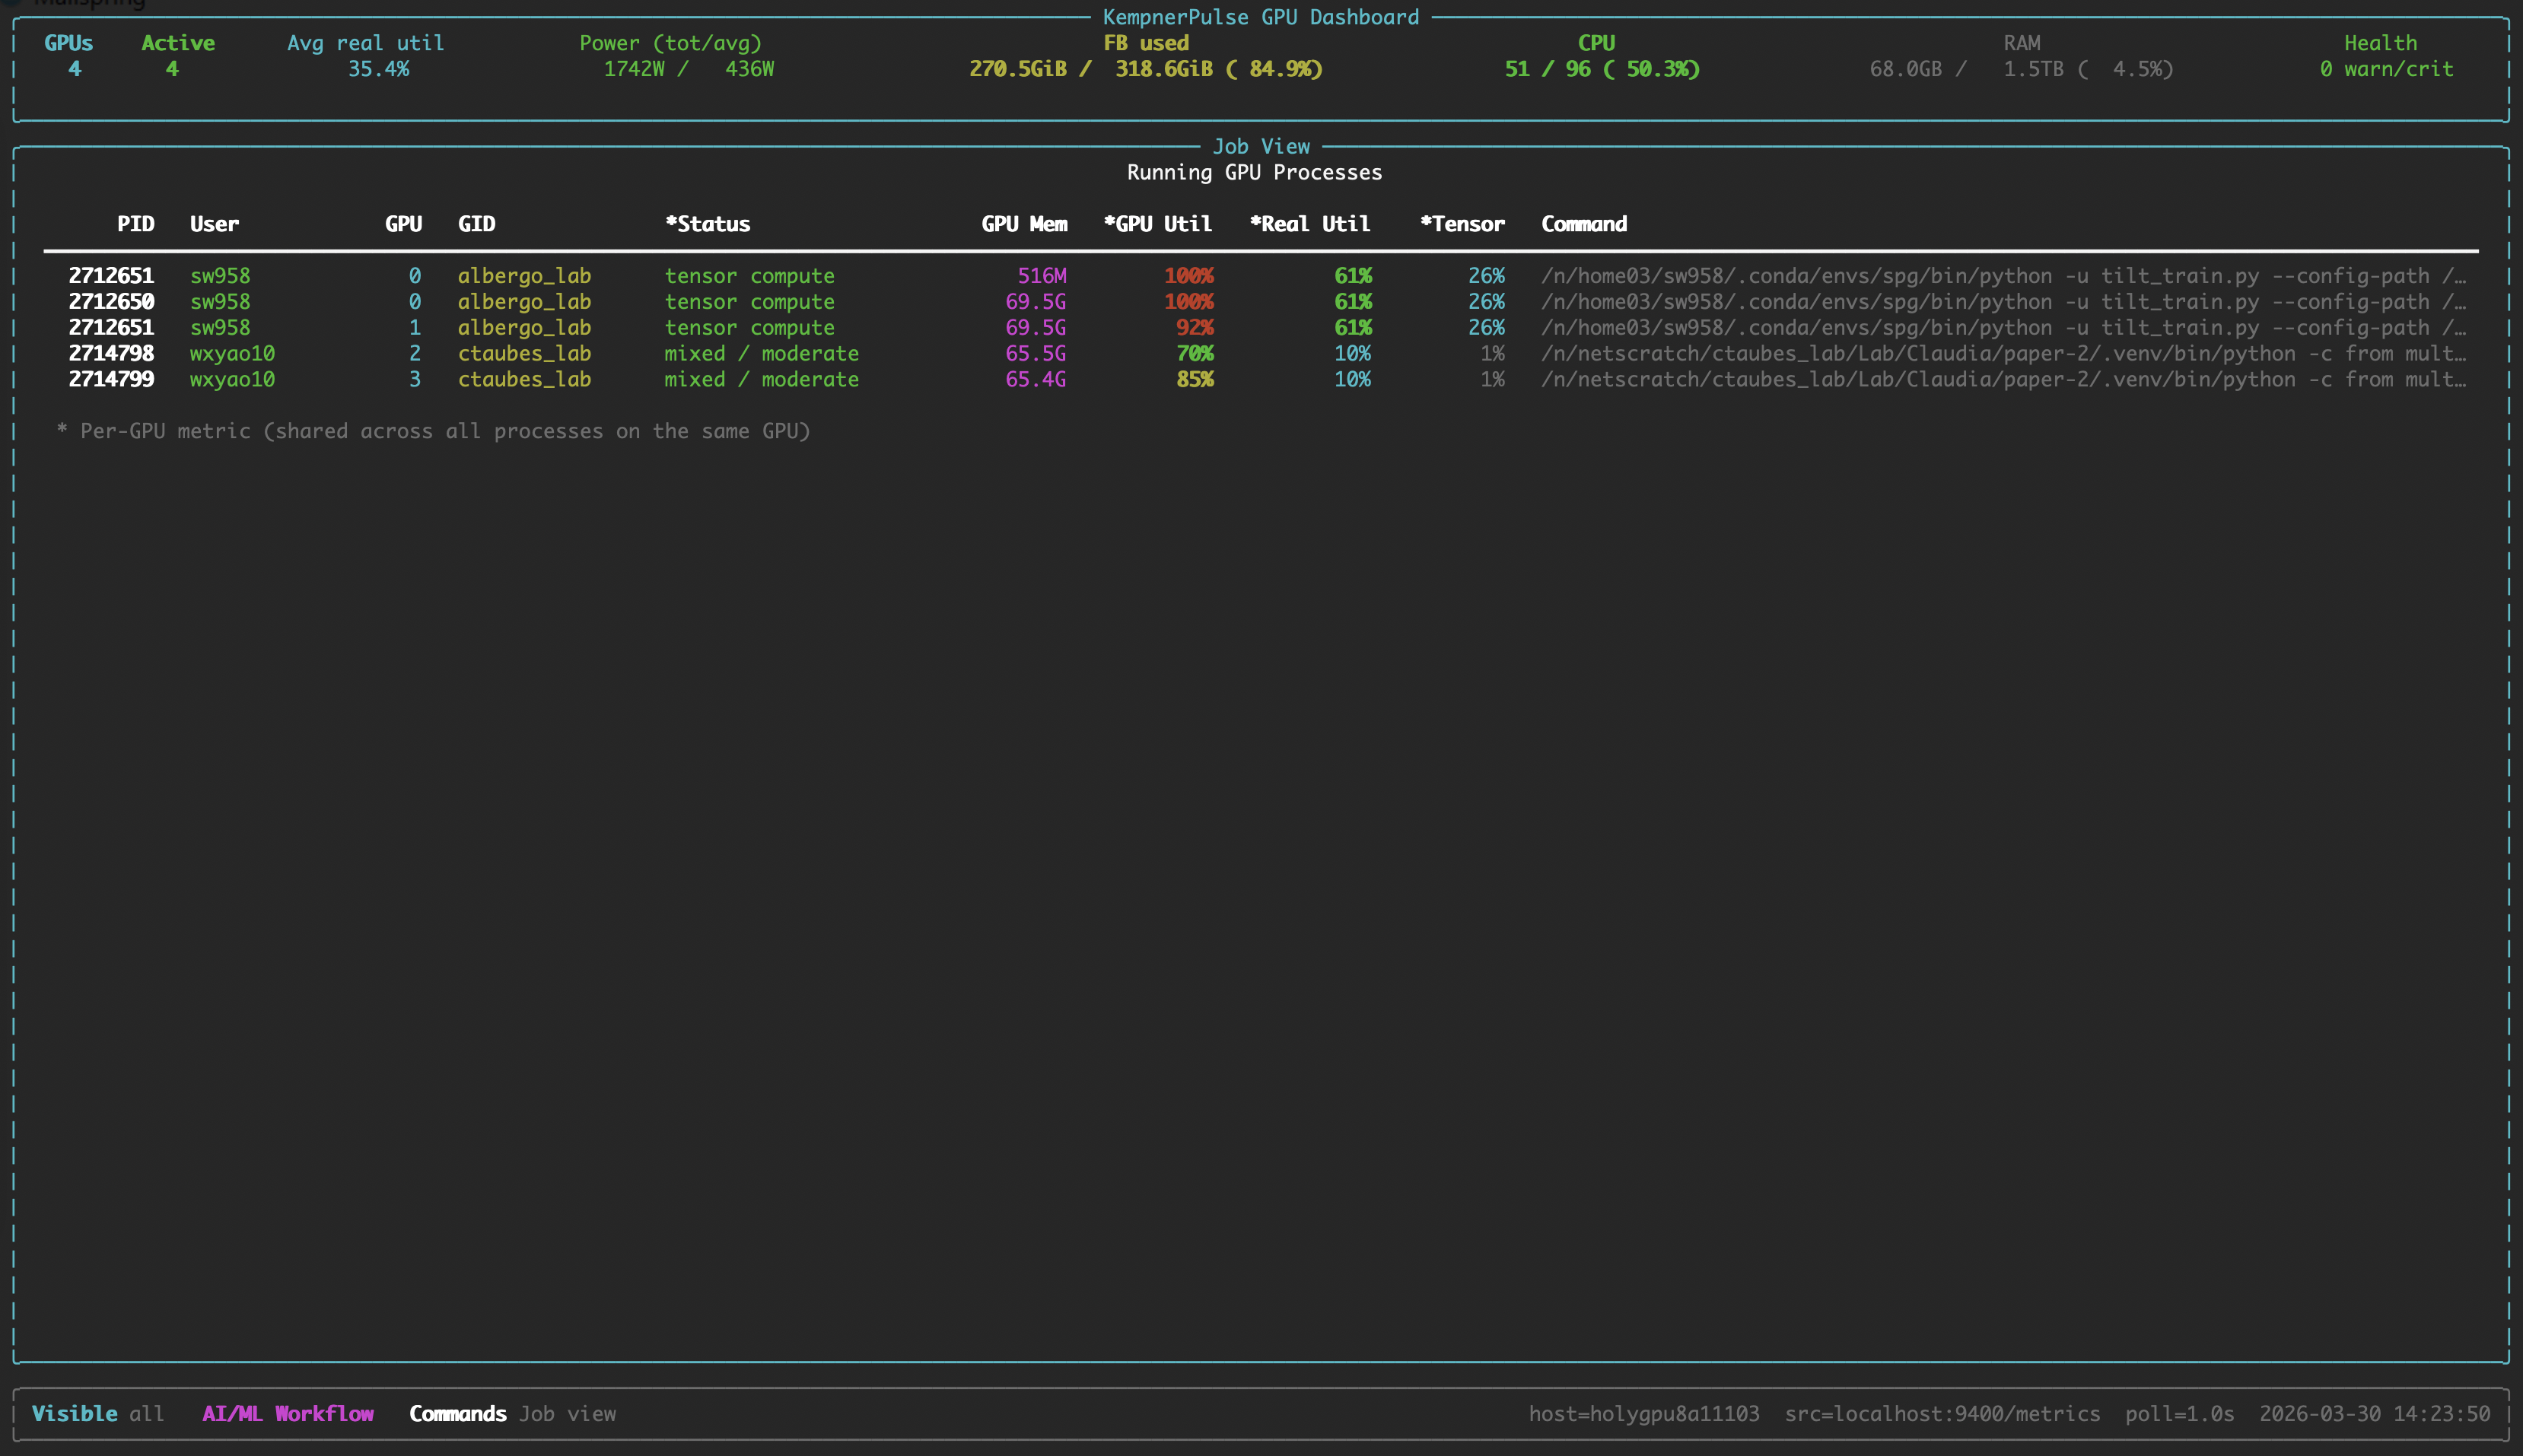
Job View
Running GPU compute processes with per-GPU metrics.
Requirements
- Linux with NVIDIA GPUs
- dcgm-exporter running and
exposing
/metrics(default:http://localhost:9400/metrics) — ordcgmiCLI available for--backend dcgm - Python >= 3.9
nvidia-smion the PATH (for hardware queries and process listing)
Note: KempnerPulse currently supports NVIDIA datacenter GPUs (V100, A100, H100, H200, B200, B300). Grace-Hopper (GH200), Grace-Blackwell (GB200) and RTX support is planned but not yet tested. AMD GPUs are not supported.
Installation
pip install kempnerpulse
Or install from source:
pip install .
Quick Start
# Default: connect to localhost:9400/metrics, show SLURM/CUDA-visible GPUs
kempnerpulse

# Explicit source and GPU selection
kempnerpulse --source http://gpu-node:9400/metrics --gpus 0,1,2,3

# Show all GPUs on the node
kempnerpulse --show-all

# Start in focus view for GPU 0
kempnerpulse --focus-gpu 0

# Use direct DCGM backend (bypasses Prometheus, higher resolution)
kempnerpulse --backend dcgm

# Use HPC weight preset
kempnerpulse --hpc-weights

# Custom weights (SM, Tensor, DRAM, GR; normalized automatically)
kempnerpulse --weights 0.40,0.30,0.20,0.10

# Export CSV (default columns) — only GPUs with your processes
kempnerpulse --export > metrics.csv

# Export all columns
kempnerpulse --export all > metrics.csv

# Export custom columns
kempnerpulse --export gpu_id,real_util_pct,power_w,tensor_active_pct > metrics.csv

# Single snapshot export
kempnerpulse --export --once
Interactive Commands
| Command | Action |
|---|---|
:focus <id> |
Enter focused view for a specific GPU |
:plot |
Enter plot view (line charts) |
:job |
Enter job view (running GPU processes) |
:q |
Return to fleet view (or exit if in fleet) |
:exit |
Exit the dashboard |
Ctrl+C |
Exit the dashboard |
Esc |
Cancel an unfinished : command |
CLI Reference
| Flag | Type | Default | Description |
|---|---|---|---|
--version |
Show version and exit. | ||
--backend |
string | prometheus |
Data source backend: prometheus (dcgm-exporter HTTP) or dcgm (dcgmi dmon direct). |
--source URL |
string | http://localhost:9400/metrics |
dcgm-exporter /metrics endpoint or a local text file (prometheus backend only). |
--poll SECS |
float | 1.0 |
Sampling/refresh interval in seconds. With --backend dcgm, drives a persistent dcgmi stream and is honored down to a 100ms floor (DCGM profiling counters refresh at ~10Hz internally; below 100ms most profiling rows would be blank). With --backend prometheus, must be >= 1.0 (dcgm-exporter scrapes profiling fields at ~30s, so sub-second values just duplicate samples). |
--history N |
int | 120 |
Number of samples kept for sparkline history. |
--focus-gpu ID |
string | Start in Focus View for the given GPU id (e.g. 0). |
|
--once |
flag | Render a single snapshot and exit instead of running live. | |
--gpus IDS |
string | Explicit GPU ids or ranges (0,1 or 0-3). Overrides SLURM/CUDA env vars. |
|
--show-all |
flag | Ignore SLURM/CUDA visibility env vars; show every GPU in the source. | |
--weights W |
4 floats | 0.35,0.35,0.20,0.10 |
Comma-separated Real Util weights: SM,TENSOR,DRAM,GR. Auto-normalized. |
--ai-weights |
preset | AI/LLM training preset (0.35, 0.35, 0.20, 0.10). This is the default. |
|
--hpc-weights |
preset | HPC / mixed CUDA preset (0.45, 0.15, 0.25, 0.15). |
|
--mem-weights |
preset | Memory-bound / bandwidth-heavy preset (0.35, 0.10, 0.40, 0.15). |
|
--export |
string | (off) | Output CSV to stdout. --export for default columns, --export all for every column, or --export col1,col2,... for a custom set. Rows are emitted for every GPU in the visibility set (CUDA_VISIBLE_DEVICES / SLURM_JOB_GPUS / --gpus), so you can start the recorder before your job launches. |
GPU Visibility Selection
The dashboard picks the first available source in this order:
--gpusflagCUDA_VISIBLE_DEVICESenv varNVIDIA_VISIBLE_DEVICESenv varSLURM_STEP_GPUSenv varSLURM_JOB_GPUSenv var
If none are set, all GPUs on the node are shown. Use --show-all to
explicitly override all env vars. All GPU selections are filtered against
GPUs accessible to the current process (as reported by nvidia-smi),
which respects cgroup and container restrictions.
Weight Presets
| Preset | Flag | SM | Tensor | DRAM | GR | Best For |
|---|---|---|---|---|---|---|
| AI/ML (default) | --ai-weights |
0.35 | 0.35 | 0.20 | 0.10 | DL training, LLM inference, transformers |
| HPC | --hpc-weights |
0.45 | 0.15 | 0.25 | 0.15 | Scientific computing, mixed CUDA |
| Memory-bound | --mem-weights |
0.35 | 0.10 | 0.40 | 0.15 | Bandwidth-heavy workloads, stencil codes |
Custom: --weights 0.40,0.30,0.20,0.10 (values are normalized automatically).
How It Works
KempnerPulse reads GPU metrics via one of two backends: Prometheus
(dcgm-exporter HTTP endpoint, ~30 s update interval for profiling fields) or
DCGM direct (dcgmi dmon, configurable down to ~100 ms).
It computes a Real Utilization score as a weighted combination of four
DCGM profiling counters:
Real Util = clamp(0, 100,
              W_sm    × SM_ACTIVE
            + W_tensor × TENSOR_ACTIVE
            + W_dram   × DRAM_ACTIVE
            + W_gr     × GR_ENGINE_ACTIVE)
This gives a more accurate picture of GPU utilization than nvidia-smi's
GPU-Util alone, which only reports kernel-launch duty cycle.
Workload Classification
Each GPU is classified into one of 12 categories every refresh cycle, based on thresholds from NVIDIA's DCGM profiling metric guidance. Categories are evaluated in order and the first matching rule wins.
| Status | Thresholds | Rationale |
|---|---|---|
| idle | Real Util < 5 %, GR < 5 %, DRAM < 5 %, no I/O | Nothing running. |
| tensor-heavy compute | Tensor ≥ 50 % and SM ≥ 60 % | DL training / large-scale inference. |
| tensor compute | Tensor ≥ 15 % and SM ≥ 40 % | Mixed-precision, moderate tensor use. |
| FP64 / HPC compute | FP64 ≥ 20 % and SM ≥ 50 % | Scientific double-precision workload. |
| I/O or data-loading | Memcpy ≥ 40 % or PCIe ≥ 1 GB/s, SM < 30 % | Heavy transfer; SMs idle. |
| memory-bound | DRAM ≥ 50 % and SM < 50 % | Bandwidth limited. |
| compute-heavy | SM ≥ 80 % | Effective SM use (NVIDIA: ≥ 80 % needed). |
| compute-active | SM ≥ 50 % | Moderate compute, no tensor dominance. |
| memory-active | DRAM ≥ 40 % | Significant DRAM traffic. |
| busy, low SM use | GR ≥ 40 % and SM < 25 % | Overhead / sync / small kernels. |
| low utilization | GR < 15 %, SM < 15 %, DRAM < 15 % | Barely active. |
| mixed / moderate | (fallthrough) | No single dominant pattern. |
Full details, bottleneck color key, and NVIDIA reference points: docs/classification.md
Health Monitoring
| Status | Condition | Meaning |
|---|---|---|
| OK | (none of the below) | Normal operation. |
| WARN | PCIe replay rate > 0/s | PCIe link retransmissions occurring. |
| HOT | GPU or memory temp ≥ warning threshold | Approaching thermal throttling. |
| CRIT | Row-remap failure > 0 or uncorrectable remapped rows > 0 | Hardware memory errors. Remove from production. |
Temperature warning thresholds are per-model (A100: 93 °C, H100/H200: 95 °C, RTX 6000: 92 °C, default: 93 °C). Full threshold table: docs/classification.md
CSV Export
Export GPU metrics as CSV for offline analysis or terminal monitoring. Only GPUs where the current user has running compute processes are included.
kempnerpulse --export > metrics.csv            # default columns
kempnerpulse --export all > metrics.csv        # all 34 columns
kempnerpulse --export gpu_id,real_util_pct,power_w > metrics.csv  # custom
kempnerpulse --export --once                   # single snapshot
Default columns: timestamp, gpu_id, model, gpu_util_pct, mem_used_mib, real_util_pct, sm_active_pct, tensor_active_pct, dram_active_pct
Full column reference and usage details: docs/export.md
DCGM Metrics
KempnerPulse consumes ~30 DCGM fields covering profiling counters, memory, temperature, power, clocks, PCIe, NVLink, and error counters. The complete list with descriptions and NVIDIA doc links: docs/metrics.md
Performance Overhead
KempnerPulse introduces minimal runtime overhead, using approximately 8.2% of a single CPU core on an AMD EPYC 9374F processor, with negligible memory usage (below the reporting resolution of top).
License
MIT. See LICENSE for details.


Download files
Download the file for your platform. If you're not sure which to choose, learn more about installing packages.
Source Distribution
Built Distribution
Filter files by name, interpreter, ABI, and platform.
If you're not sure about the file name format, learn more about wheel file names.
Copy a direct link to the current filters
File details
Details for the file kempnerpulse-0.4.0.tar.gz.
File metadata
- Download URL: kempnerpulse-0.4.0.tar.gz
- Upload date:
- Size: 45.5 kB
- Tags: Source
- Uploaded using Trusted Publishing? No
- Uploaded via: twine/6.2.0 CPython/3.12.13
File hashes
| Algorithm | Hash digest | |
|---|---|---|
| SHA256 |
acc1ef07b1b03433ea900d4ef4504c7d7960769c460e1588baea06c1554e060b
|
|
| MD5 |
b6064d043a915df318a653881787f127
|
|
| BLAKE2b-256 |
5b2a8c845509d63c01dd905798470f32d5f2cd43d11ada6734e2784f0f86b046
|
File details
Details for the file kempnerpulse-0.4.0-py3-none-any.whl.
File metadata
- Download URL: kempnerpulse-0.4.0-py3-none-any.whl
- Upload date:
- Size: 41.8 kB
- Tags: Python 3
- Uploaded using Trusted Publishing? No
- Uploaded via: twine/6.2.0 CPython/3.12.13
File hashes
| Algorithm | Hash digest | |
|---|---|---|
| SHA256 |
3ef93e08d47e76d42b64c35bbbe93cd94c261bbecf674b7601a16244fd747926
|
|
| MD5 |
6bd899abf592e775fbdc0d8a9f9f09a5
|
|
| BLAKE2b-256 |
0e49cfcbd30c9691853fc73aaa471e04dcedabf47f066aabed04f565725e74dc
|


