





KitikiPlot
KitikiPlot is a Python library for visualizing sequential and time-series categorical "Sliding Window" data.
(The term 'kitiki' means 'window' in Telugu)
Genome Grid Plot Generator: 🤗 HuggingFace Demo
Examples
Genome Visualization can be found in Genome.ipynb

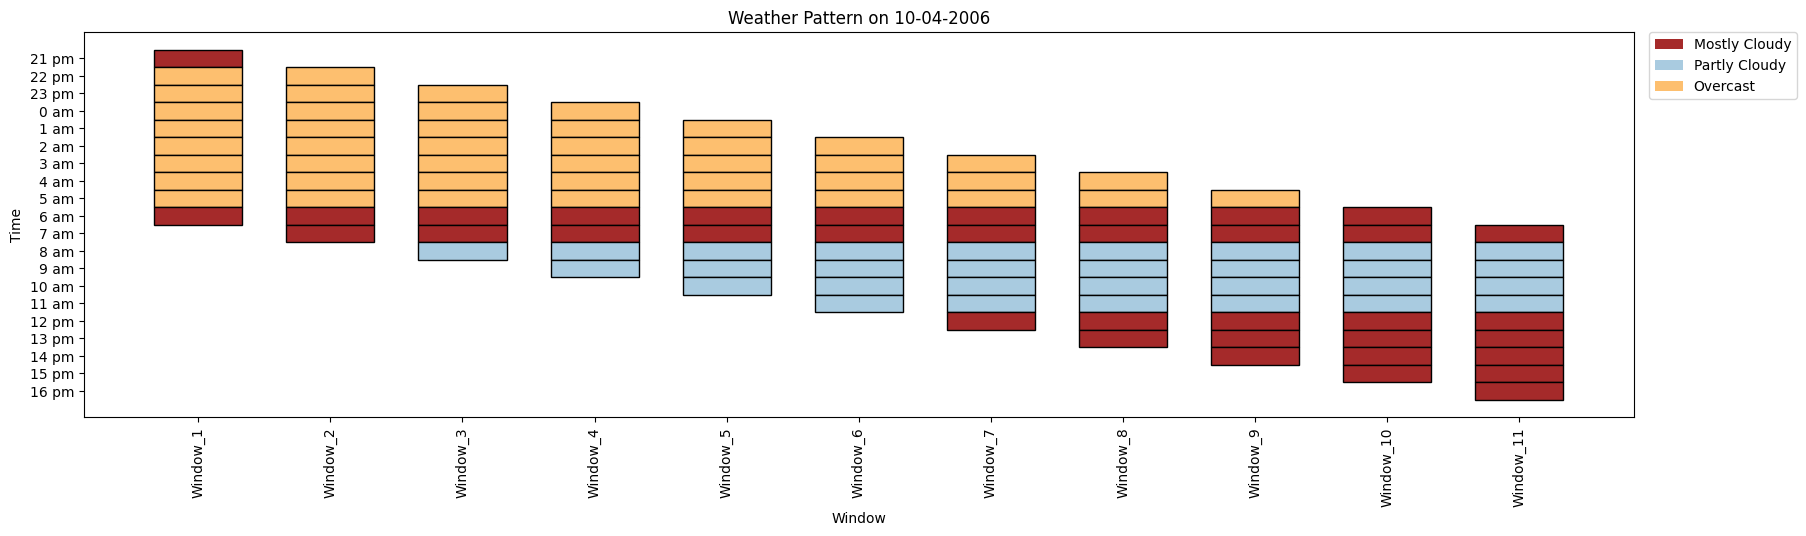
Weather Pattern in Weather Pattern.ipynb
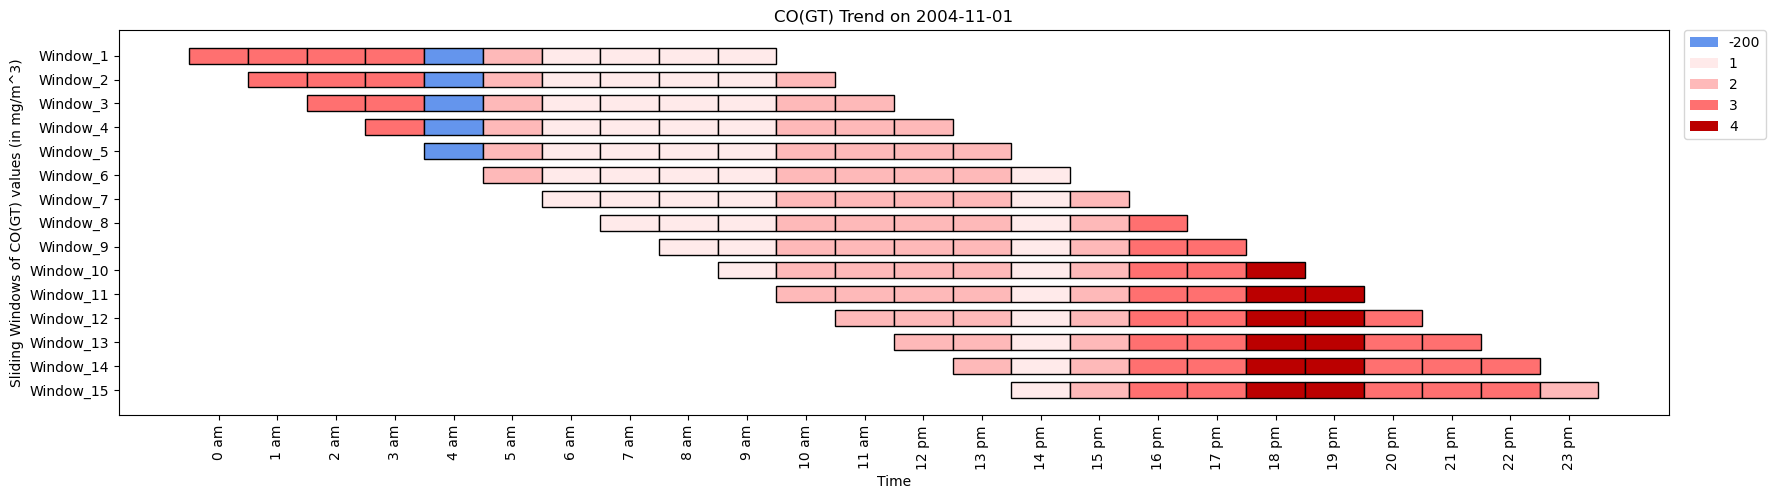
CO Trend in Air in Air_Quality.ipynb
Getting Started
Install the package via pip:
pip install kitikiplot
Usage
from kitikiplot import KitikiPlot

data = [] # DataFrame or list of sliding window data

ktk= KitikiPlot( data= data )

ktk.plot( display_legend= True ) # Display the legend
Check out the complete guide of customization here.
To-do
- Tooltip
- Interactive Plot
- Domain-specific modules
- Streamlit Demo Interface
- Website for documentation
Want to contribute?
- Please refer CONTRIBUTING.md for contributions to kitikiplot.
- Execute Tests when contributing to KitikiPlot
- Please refer Readme.md to run the tests
To join the Discord server for more discussion, click here
Key Author
Citation
Our preprint is published in TechRxiv. Find it here
Research paper is published in GIS Science Journal Volume 12 Issue 1, 186-193, 2025 (Scopus indexed with Impact factor 6.1).
Read it here: https://zenodo.org/records/14632005
APA
Boddu Sri Pavan, Chandrasheker Thummanagoti, & Boddu Swathi Sree. (2025). KitikiPlot A Python library to visualize categorical sliding window data. https://doi.org/10.5281/zenodo.14632005.
IEEE
Boddu Sri Pavan, Chandrasheker Thummanagotiand Boddu Swathi Sree, “KitikiPlot A Python library to visualize categorical sliding window data”, 2025, doi: 10.5281/zenodo.14632005.
BibTeX
@misc{boddu_sri_pavan_2025_14632005,
author = {Boddu Sri Pavan and
Chandrasheker Thummanagoti and
Boddu Swathi Sree},
title = {KitikiPlot A Python library to visualize
categorical sliding window data
},
month = jan,
year = 2025,
publisher = {Zenodo},
doi = {10.5281/zenodo.14632005},
url = {https://doi.org/10.5281/zenodo.14632005},
}
Thank You !
1 maintainer

Release files for kitikiplot 1.0.1
For a detailed explanation of source distributions (sdists) and built distributions (wheels), please see the package formats documentation.
Source distribution (sdist)
| File | Size | Uploaded | |
|---|---|---|---|
| kitikiplot-1.0.1.tar.gz | 12.2 kB | Details |
Built distribution (wheel)
| File | Interpreter | ABI | Platform | Reset |
|---|---|---|---|---|
| kitikiplot-1.0.1-py3-none-any.whl | Python 3 | none | any | Details |
Total release size: 29.7 kB
Release files / kitikiplot-1.0.1.tar.gz
| Download URL | kitikiplot-1.0.1.tar.gz |
|---|---|
| Size | 12.2 kB |
| Tags | Source |
|
SHA-256 checksum How to use checksums |
47478752ad4deeec21ddac4845f5d0b8446d369831f276aafe756a1ee99b8f65
|
|
BLAKE2b-256 checksum How to use checksums |
20e863aa0734f02b9b6550c56f757f48cf8c73be28670121d50988e74d714a1a
|
| Upload date | |
|
Uploaded using Trusted Publishing? What is trusted publishing? |
No |
| Uploaded via |
poetry/2.1.2 CPython/3.11.3 Windows/10
|
Release files / kitikiplot-1.0.1-py3-none-any.whl
| Download URL | kitikiplot-1.0.1-py3-none-any.whl |
|---|---|
| Size | 17.6 kB |
| Tags | Python 3 |
|
SHA-256 checksum How to use checksums |
21035b9ea12578d6e19298c3969bda42c2e28fa15f5717e73c603049d71cd9ee
|
|
BLAKE2b-256 checksum How to use checksums |
f7b69c45225d941f53fb81d60d92efd850bc5bb08b66713f92cff14ce19a2864
|
| Upload date | |
|
Uploaded using Trusted Publishing? What is trusted publishing? |
No |
| Uploaded via |
poetry/2.1.2 CPython/3.11.3 Windows/10
|














