Cross-platform-ish system monitor (tested on Linux & Windows). Clean PyQt UI for CPU, memory, network and filesystems.

Project description
KLV-System-Monitor
KLV System Monitor is a lightweight system monitor written in Python (PyQt5 + psutil) with a focus on clarity, low overhead, and control.
It takes inspiration from GNOME/Ubuntu System Monitor and brings a similarly clean experience to Linux and Windows, while adding features that were missing elsewhere.
- Three CPU views: Multi thread, General view, and Multi window (selectable in Preferences).
- Configurable smoothing and refresh: decoupled refresh rates for plots vs. text/labels; per-subsystem EMA alphas (CPU, memory, network).
- Tunable visuals: line width, colors (per-core or mono), grid toggles, antialiasing, translucent fill for CPU areas, and frequency labels per core.
- Efficient updates: process table refreshes only when visible; file systems view refreshes on demand.
- Power tools: filter and sort processes; clear current selection (stop following) and kill selected (when permitted).
Feature tour
1) CPU — General view (single curve)
Shows total CPU usage over the last 60 seconds with a fixed 0–100% Y-axis.
The average CPU frequency and total CPU usage are displayed beneath the chart.
Smoothing (EMA) and antialiasing can be enabled/disabled in Preferences.
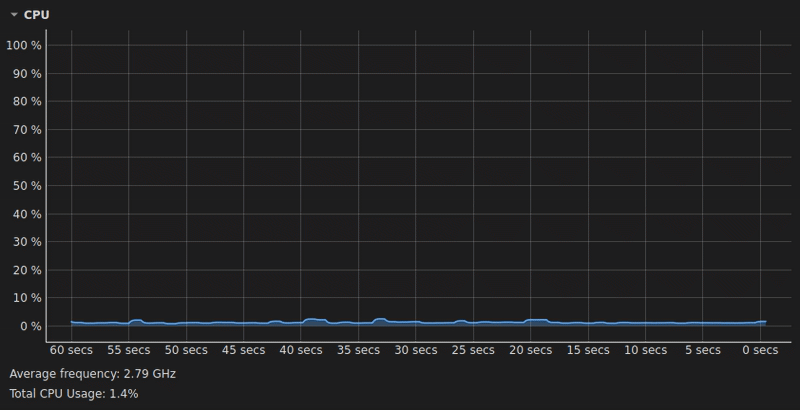
How to read this view
- X-axis: time window (seconds).
- Y-axis: total CPU utilization (%).
- Footer: average CPU frequency across cores + total CPU usage.
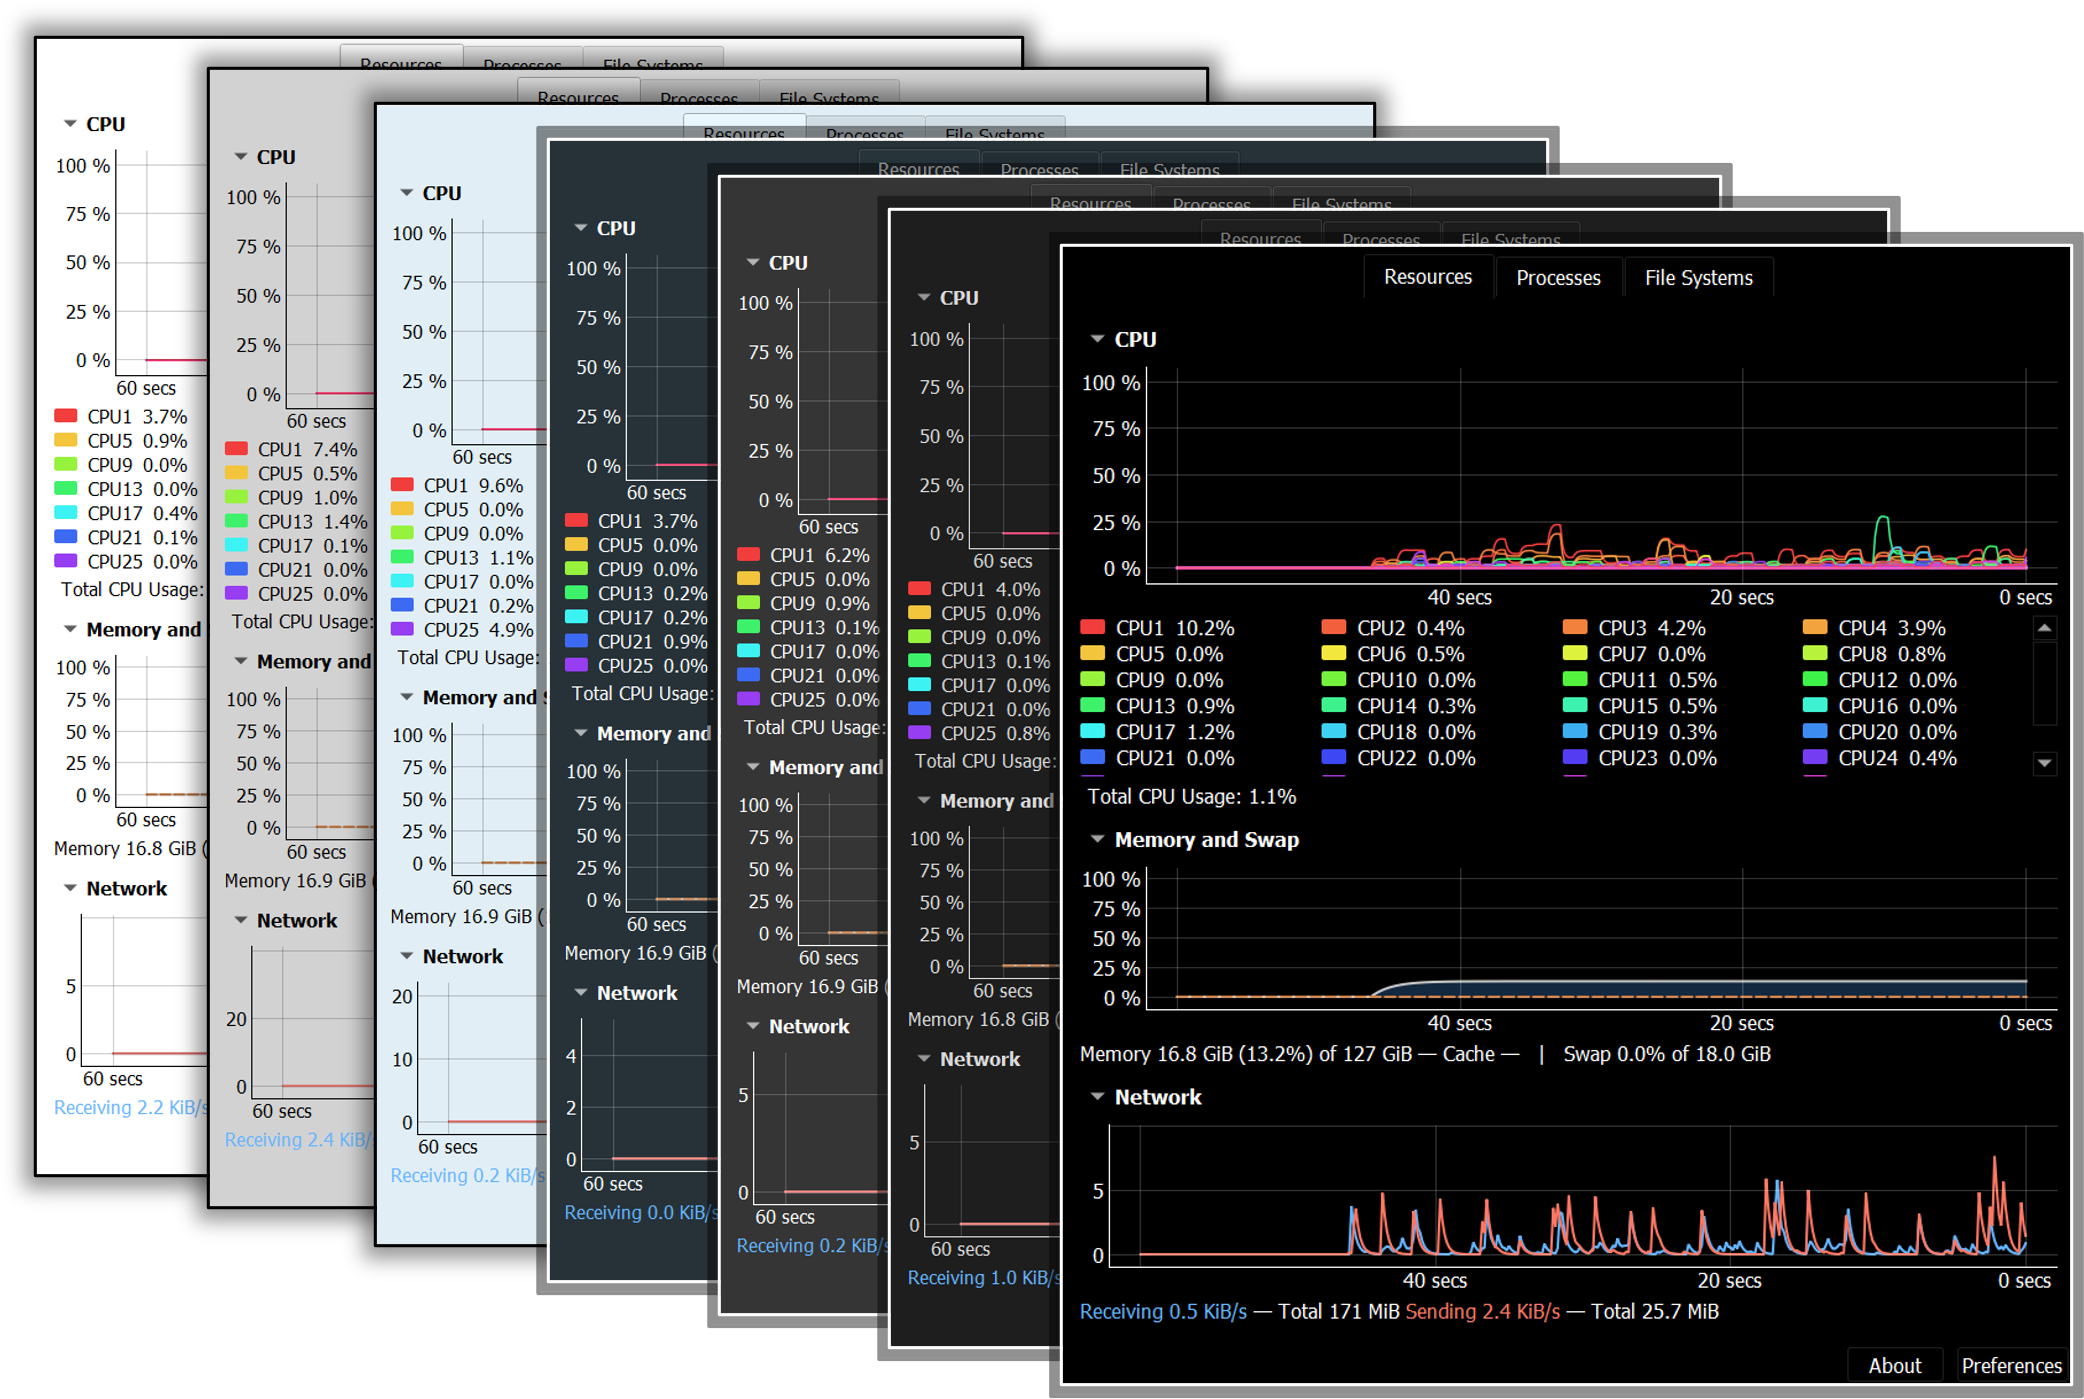
2) CPU — Multi-thread view (all cores)
Per-CPU utilization is plotted simultaneously, one colored line per core/thread.
Each legend entry shows CPU name → current % and frequency (if frequency display is enabled).
Line thickness, colors, smoothing and grids are configurable in Preferences.
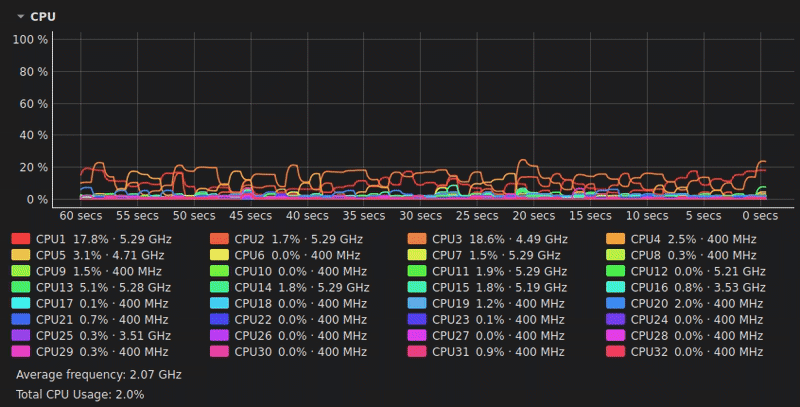
Tips
- Colors are persistent and can be customized.
- Toggle extra smoothing for a look similar to GNOME System Monitor.
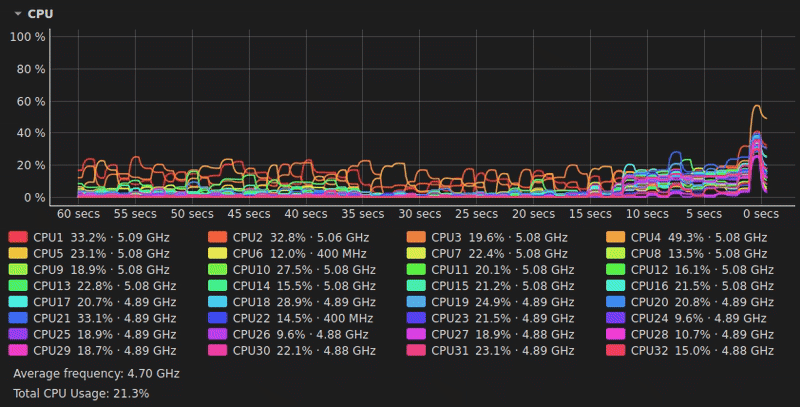
3) CPU — Parallel processes tracking
An example of a parallel workload starting and ramping up.
You can see how multiple threads pick up work at the same time and how the smoothing avoids jagged spikes while keeping short-term dynamics readable.
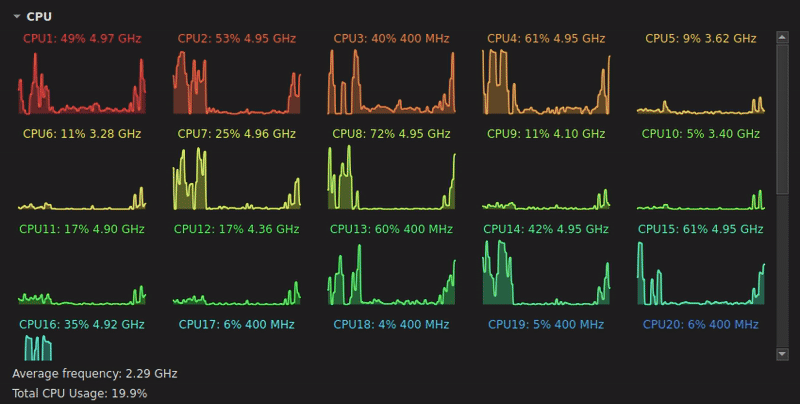
4) CPU — Multi-window per-core view
Compact grid of mini-plots: one small chart per core.
Great for many-core systems; the grid is scrollable and the number of columns is configurable.
You can optionally show axes, match label color to plot color, or use a mono color for all mini-plots.
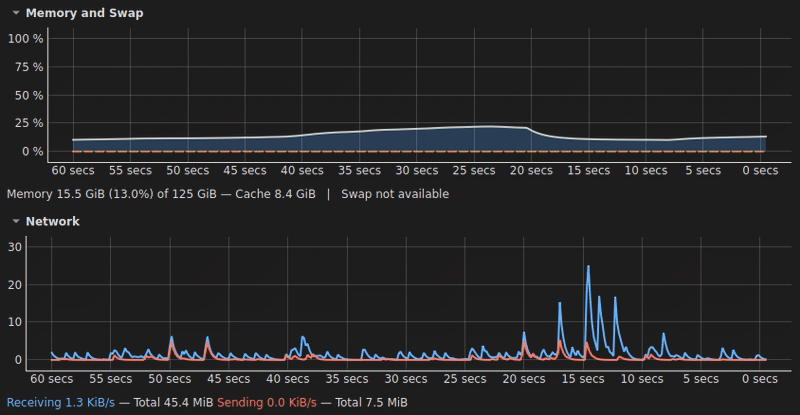
5) Memory, Swap and Network
Two stacked panels:
- Memory & Swap: filled area chart with used memory and cache; swap status is shown on the right.
- Network: receive/send rates (per second) plus totals since the start of the session.
Both panels support optional EMA smoothing and gridlines.
6) File Systems tab
Overview of mounted file systems and low-level disk I/O:
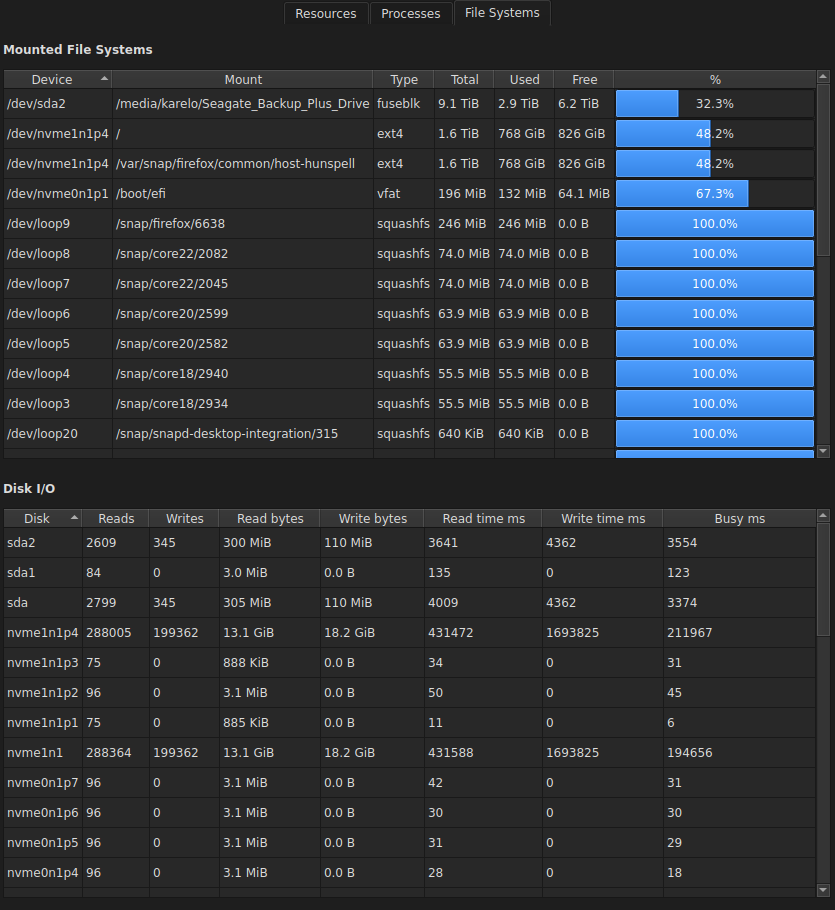
Mounted File Systems
- Columns: Device, Mount, Type, Total, Used, Free, %.
- The percentage column includes a horizontal utilization bar.
Disk I/O
- Per-disk counters since boot: reads / writes / read bytes / write bytes / read time / write time / busy ms.
7) Processes tab
A fast, filterable process table that updates only when the tab is visible (to reduce overhead).
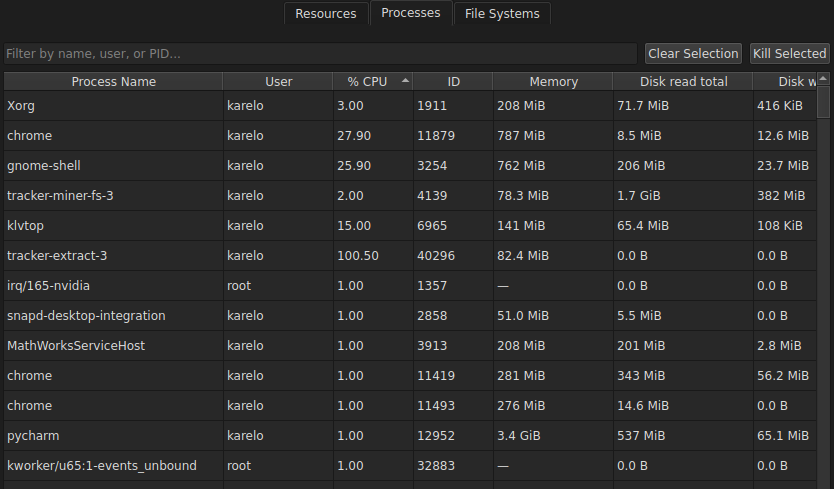
Features
- Filter box (top-left): search by process name, user, or PID.
- Click column headers to sort (ascending/descending).
- Columns: Process Name, User, % CPU, PID, Memory, Disk read total, Disk write total, …
- Clear Selection: stops following the current process (if you were tracking one).
- Kill Selected: terminates selected processes (requires sufficient permissions).
The refresh interval of this tab is configurable in Preferences.
8) Preferences
All performance, smoothing and UI options in one place:
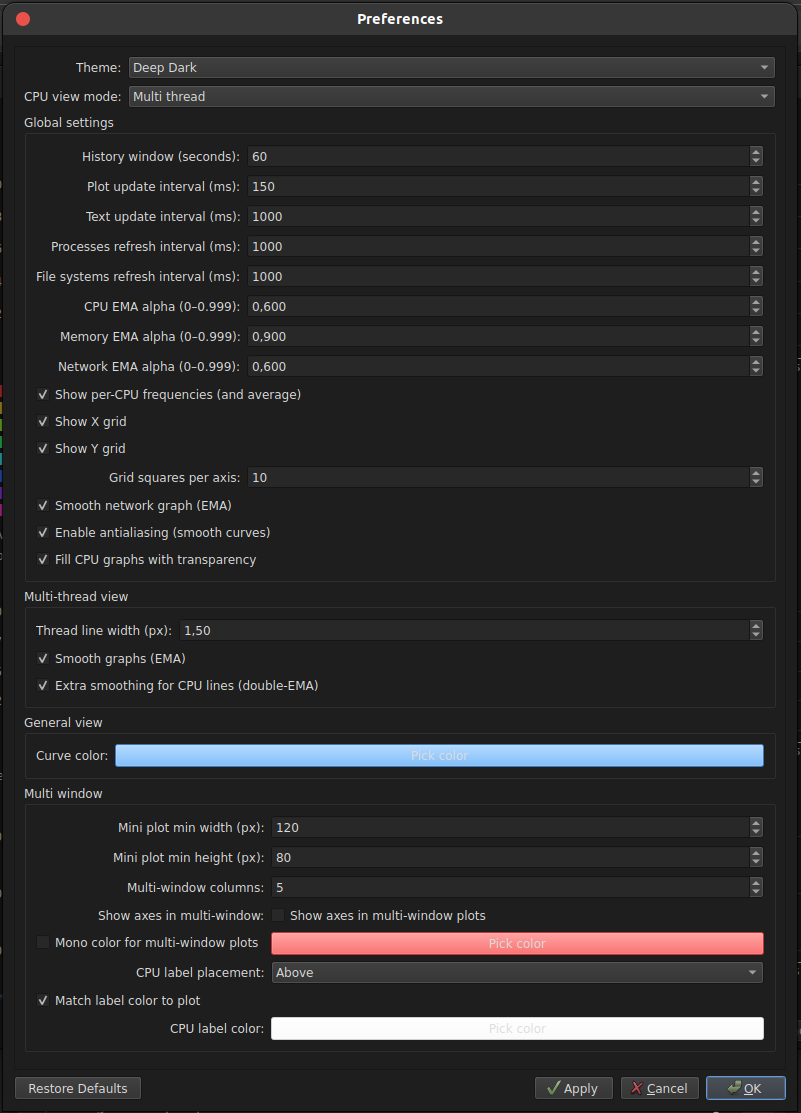
Global settings
- History window (seconds) — width of the time window.
- Plot update interval (ms) — how often lines are redrawn.
- Text update interval (ms) — how often labels (%/GHz) refresh.
- Processes refresh interval (ms), File systems refresh interval (ms) — decoupled from plot updates.
- CPU / Memory / Network EMA alpha — smoothing strength (0–0.999).
- Show per-CPU frequencies (and average) — overlay GHz per core + mean.
- Show X/Y grid, Grid squares per axis.
- Smooth network graph (EMA), Enable antialiasing, Fill CPU graphs with transparency.
Multi-thread view
- Thread line width (px).
- Smooth graphs (EMA) and Extra smoothing for CPU lines (double-EMA).
General view
- Curve color for the single-curve CPU view.
Multi-window
- Mini plot min width/height (px), columns count (grid layout).
- Show axes in multi-window plots.
- Mono color for multi-window plots (or per-core colors).
- CPU label placement and Match label color to plot.
Footer buttons: Restore Defaults, Apply, Cancel, OK.
Themes & Appearance
KLV System Monitor ships with multiple built-in themes ranging from light to deep dark.
Charts, legends and UI widgets adapt automatically to the selected theme to preserve contrast and readability.
Highlights
- Theme selector in Preferences → Theme (instant preview).
- High-contrast palettes for per-CPU lines and legends in both light and dark modes.
- Optional antialiasing for extra-smooth curves (toggle in Preferences).
- Grid visibility (X/Y), line width, mono/per-core colors, and label color matching are all configurable.
- The general CPU view keeps a fixed 0–100% Y-axis for consistent reading across themes.
Requirements
| Software | Minimum Version | Notes |
|---|---|---|
| Python | 3.10 | Installed automatically if you use the one-click installers |
Installation
You can install KLV System Monitor in two ways:
1. One-click installers (recommended)
- Download the ZIP package:
📦 One-click Installers - Extract the ZIP file and run the script for your operating system:
| OS | Script | How to Run | Duration |
|---|---|---|---|
| Windows 10/11 | install_klv_system_monitor.bat |
Double-click. This will open a terminal and the installation will start. If you are not familiar to terminals, please, do not be afraid. This script do not have any permission to make undesired things. |
≈ 5 min |
| Linux | install_klv_system_monitor.sh |
Open a terminal in the path of the installer and type: ./klv_system_monitor.sh |
≈ 5 min |
- After the installation finishes, you will find two shortcuts on your desktop:
| OS | Launch | Uninstall |
|---|---|---|
| Windows | run_KLVSystemMonitor.bat |
uninstall_KLVSystemMonitor.bat |
| Linux | KLV System Monitor (launcher) | Uninstall KLV System Monitor |
2. Install in a virtual environment (advanced)
# 1. Create a virtual environment
python3 -m venv <env_name>

# 2. Activate it
source <env_name>/bin/activate          # On Windows: <env_name>\Scripts\activate

# 3. Install BIDS Manager from GitHub
pip install klv-system-monitor
The package declares all dependencies, so installation
pulls everything required to run the GUI and helper scripts.
All core requirements are version pinned in pyproject.toml to ensure
consistent installations.
After installation the following commands become available:
klvtop– main GUI containing all KLV System Monitor functionalities


Download files
Download the file for your platform. If you're not sure which to choose, learn more about installing packages.
Source Distribution
Built Distribution
Filter files by name, interpreter, ABI, and platform.
If you're not sure about the file name format, learn more about wheel file names.
Copy a direct link to the current filters
File details
Details for the file klv_system_monitor-0.1.2.tar.gz.
File metadata
- Download URL: klv_system_monitor-0.1.2.tar.gz
- Upload date:
- Size: 1.1 MB
- Tags: Source
- Uploaded using Trusted Publishing? No
- Uploaded via: twine/6.1.0 CPython/3.10.12
File hashes
| Algorithm | Hash digest | |
|---|---|---|
| SHA256 |
b868285783ced6675fed1e75a23fdcee8ac6835867fd06f1cd96e83340a13230
|
|
| MD5 |
14637b3c6713b8170c516d644e0f6561
|
|
| BLAKE2b-256 |
e7bb9e27515b7fb138b3140957ea6085ba8d4c005e1ca70e17f5042de3730684
|
File details
Details for the file klv_system_monitor-0.1.2-py3-none-any.whl.
File metadata
- Download URL: klv_system_monitor-0.1.2-py3-none-any.whl
- Upload date:
- Size: 1.1 MB
- Tags: Python 3
- Uploaded using Trusted Publishing? No
- Uploaded via: twine/6.1.0 CPython/3.10.12
File hashes
| Algorithm | Hash digest | |
|---|---|---|
| SHA256 |
f3ad56d86248580560f53b6cc112d52ea57aa0c9899a281afa9897a23be21aea
|
|
| MD5 |
c67f01f0c4f7ecc709aa704eef532cfb
|
|
| BLAKE2b-256 |
19bcd29619092c482ff47254a616fa0f5cff9596ce30eabb2e146d2fa4840d9e
|


