
komorebi_mpl



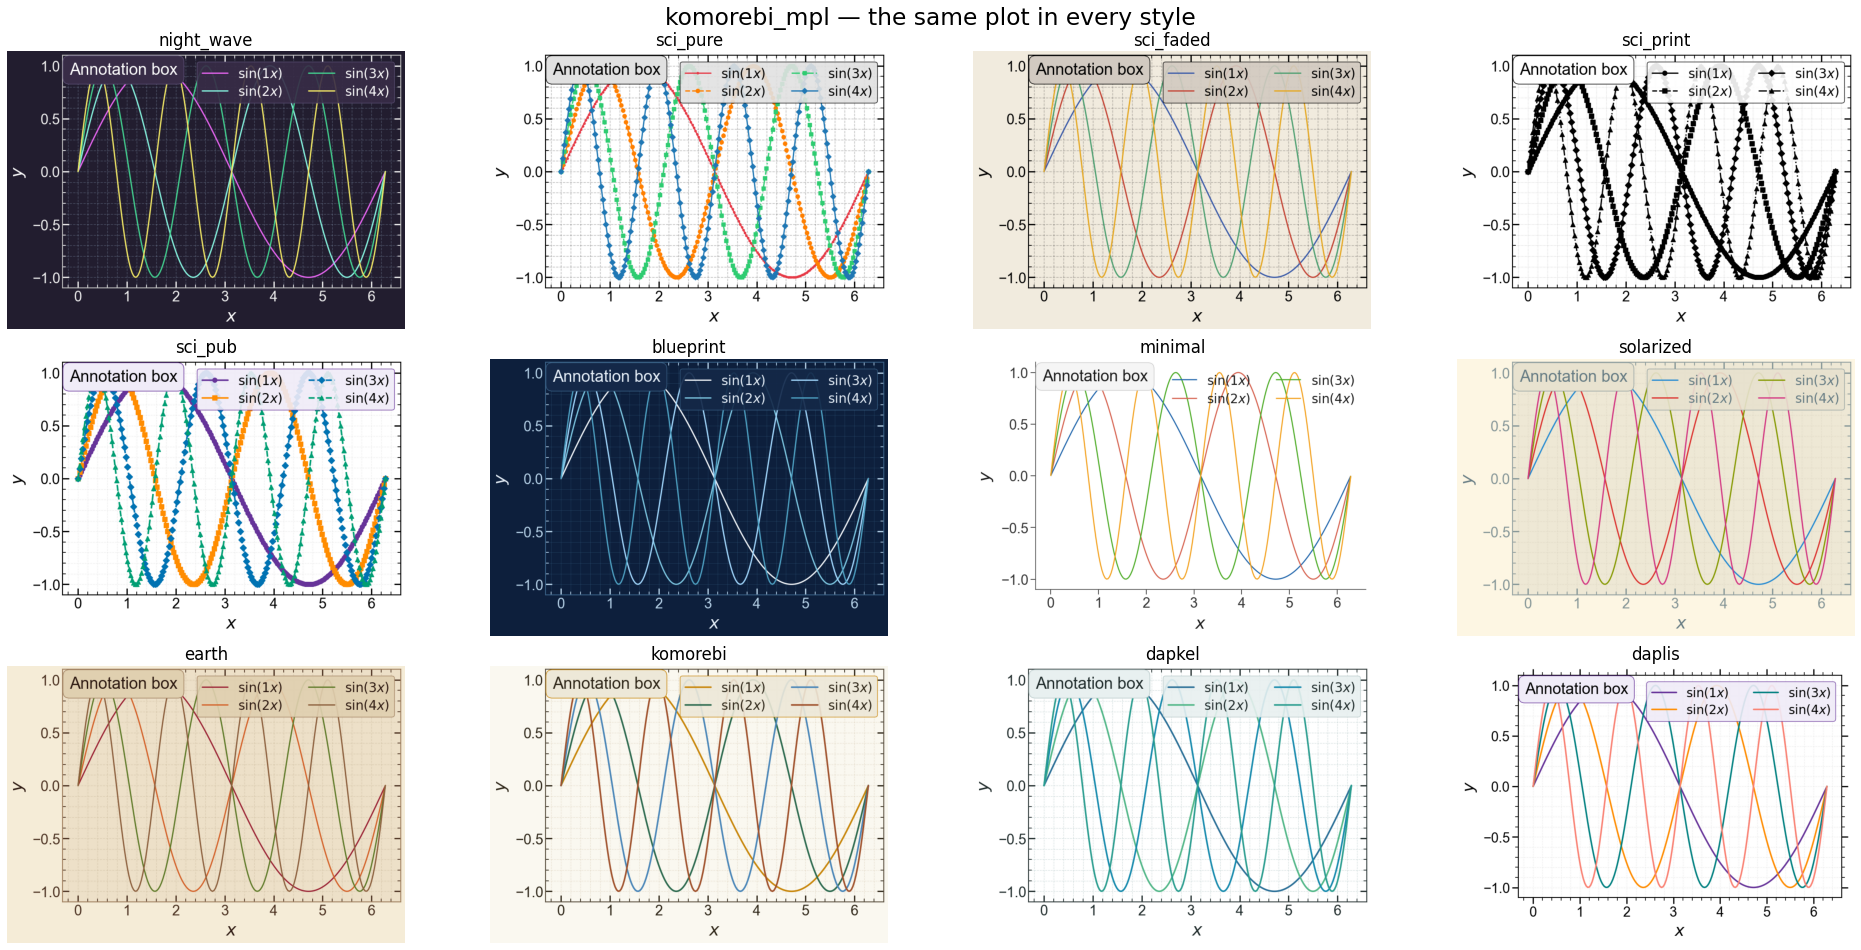
A collection of matplotlib style sheets for scientific plots — from publication-ready and greyscale-print-safe to warm parchment and neon-on-dark.
Every sheet is built on one shared template: the same 66 parameters in the same order, so styles differ only in their values and switching between them never leaves a stray matplotlib default behind.
Installation
pip install komorebi_mpl
Usage
use() applies a style and hands back pyplot, ready to go:
import komorebi_mpl as kmpl

plt = kmpl.use("sci_pub")
plt.plot([i for i in range(30)])
Or register the styles and drive matplotlib yourself:
from matplotlib import pyplot as plt
import komorebi_mpl  # importing registers the styles

plt.style.use("sci_faded")
plt.plot([i for i in range(30)])
As a package default
use() marks your choice as final; apply_default() is the library-safe
counterpart that steps aside once a user has chosen. A package can set its own
look on import without ever clobbering an explicit selection, whatever the
import order:
# in yourpackage/__init__.py
import komorebi_mpl
komorebi_mpl.apply_default("dapkel")   # no-op if the user already called use()
This is how dapkel and daplis pick up their house styles.
| function | what it does |
|---|---|
use(name) |
apply a style, close open figures, lock it as the user's choice, return pyplot |
apply(name) |
apply a style to the current rcParams without touching open figures |
apply_default(name) |
apply a package default; a no-op once use() has been called |
unlock() |
clear the lock so apply_default() can take effect again |
style_path(name) |
on-disk path of a bundled sheet |
Styles
| Style | Look | Background | Best for |
|---|---|---|---|
sci_pub |
colorblind-safe rebeccapurple + Okabe-Ito, linestyle & marker cycling | white | journal figures |
sci_pure |
vivid, clean, linestyle & marker cycling | white | papers, slides |
sci_print |
no colour at all; series told apart by linestyle and marker | white | greyscale print |
sci_faded |
soft desaturated colours, graph-paper grid | aged paper #F1EBDE |
a gentler paper look |
minimal |
Tufte-inspired; no grid, outward ticks, bottom-left spines only | white | data-forward figures |
solarized |
Ethan Schoonover's Solarized light | #FDF6E3 |
easy on the eyes |
earth |
terracotta, rust, olive, sage | parchment #F5ECD7 |
posters, warm decks |
komorebi |
木漏れ日 — forest canopy gold, green and sky blue | parchment #FAF8F0 |
posters, talks |
blueprint |
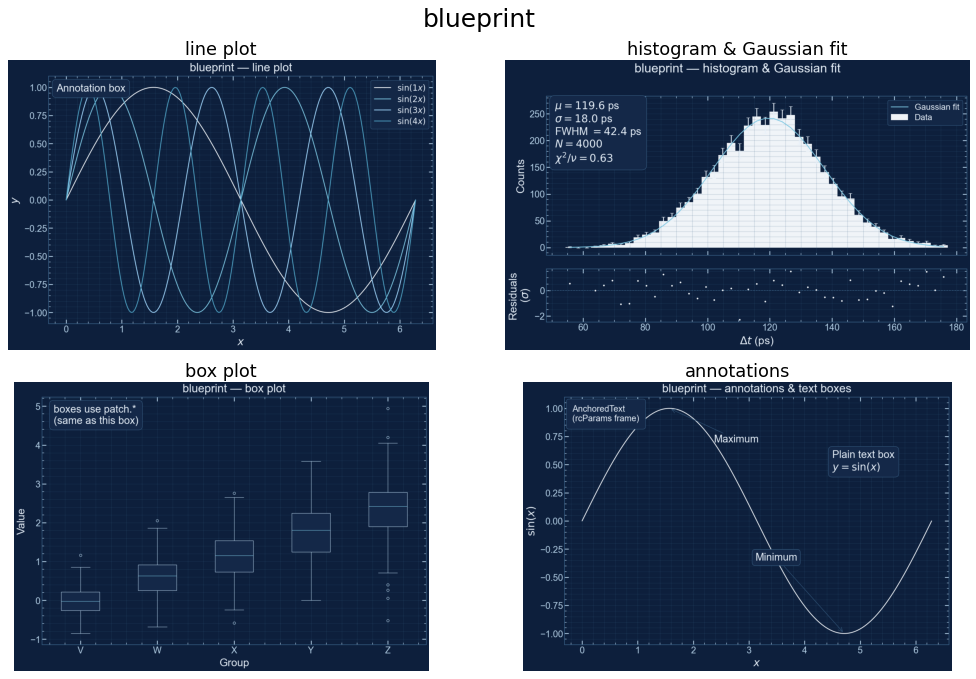
white and ice-blue lines, like a CAD drawing | deep navy #0D1F3C |
dark slides |
night_wave |
neon synthwave, with optional glow and gradient helpers | #221D2F |
dark slides |
dapkel |
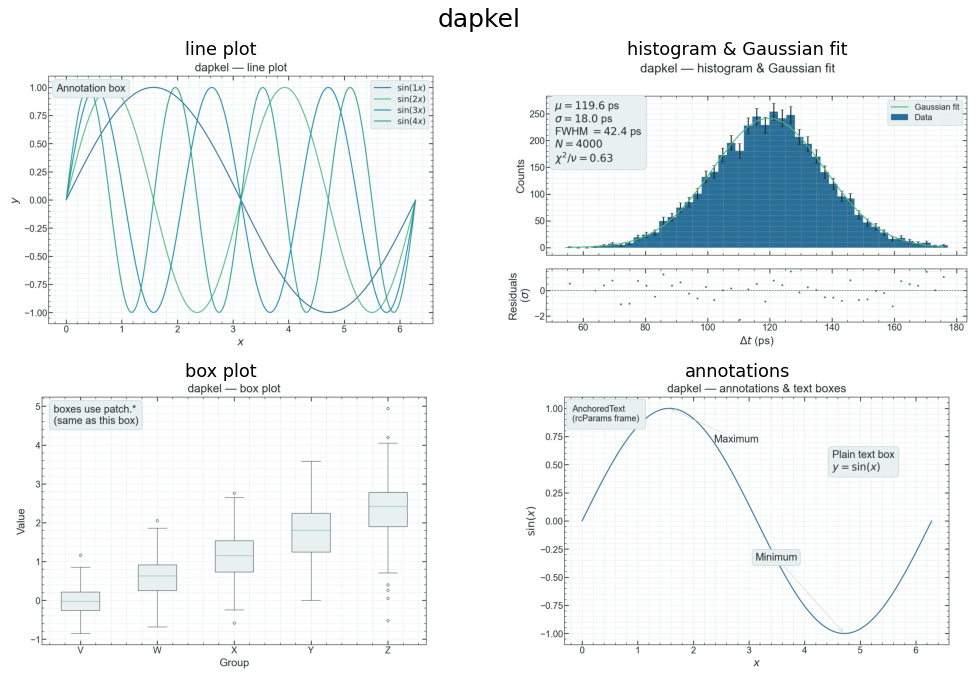
green-to-blue house style of the dapkel package | white | Kelpie analysis |
daplis |
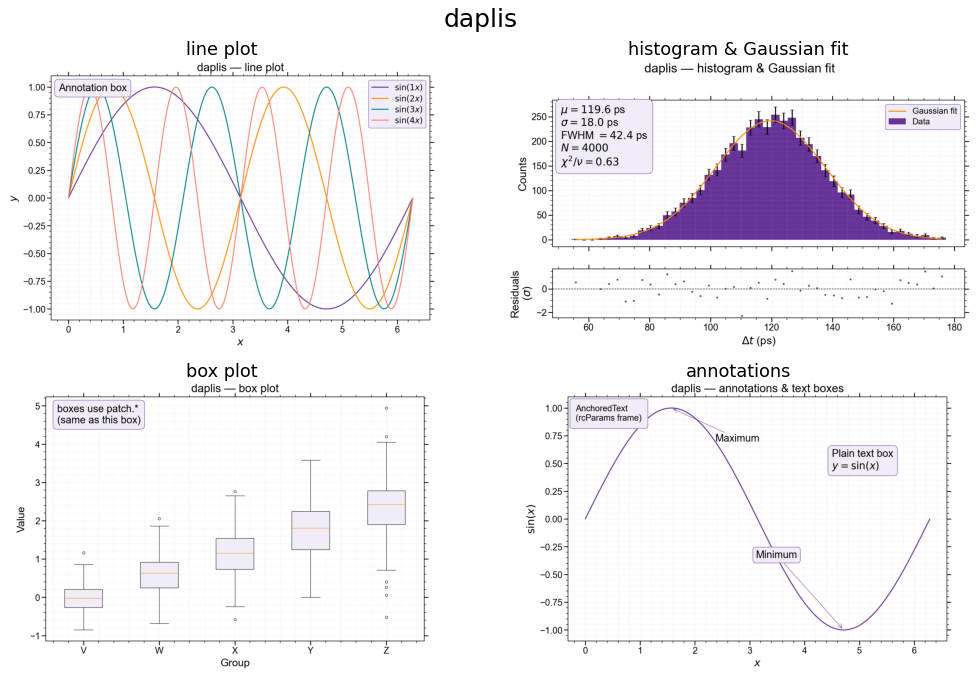
colorblind-accessible house style of the daplis package, outward ticks | white | LinoSPAD2 analysis |
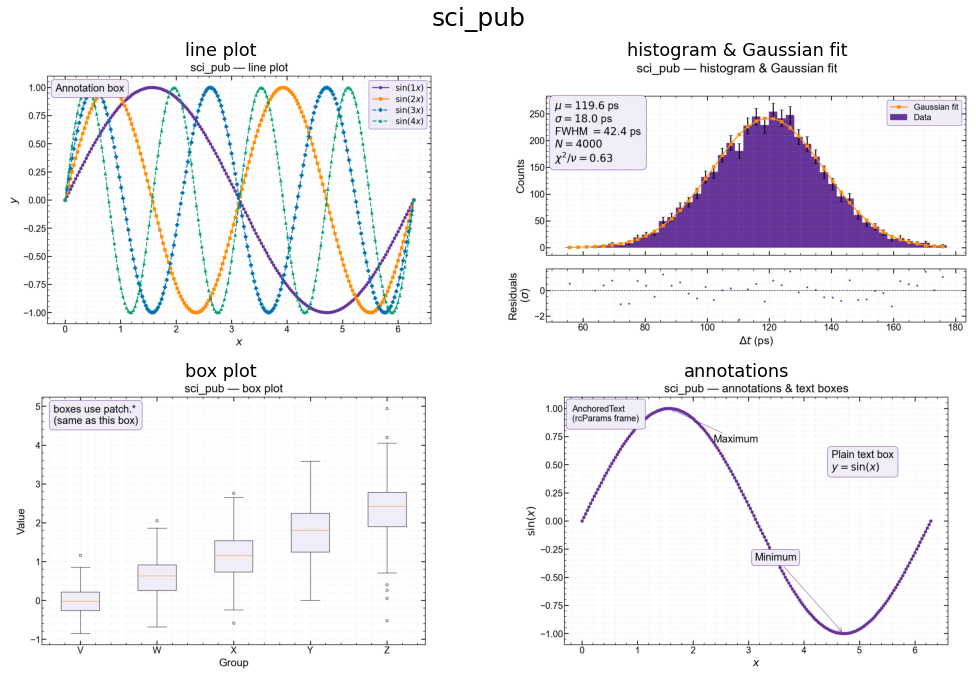
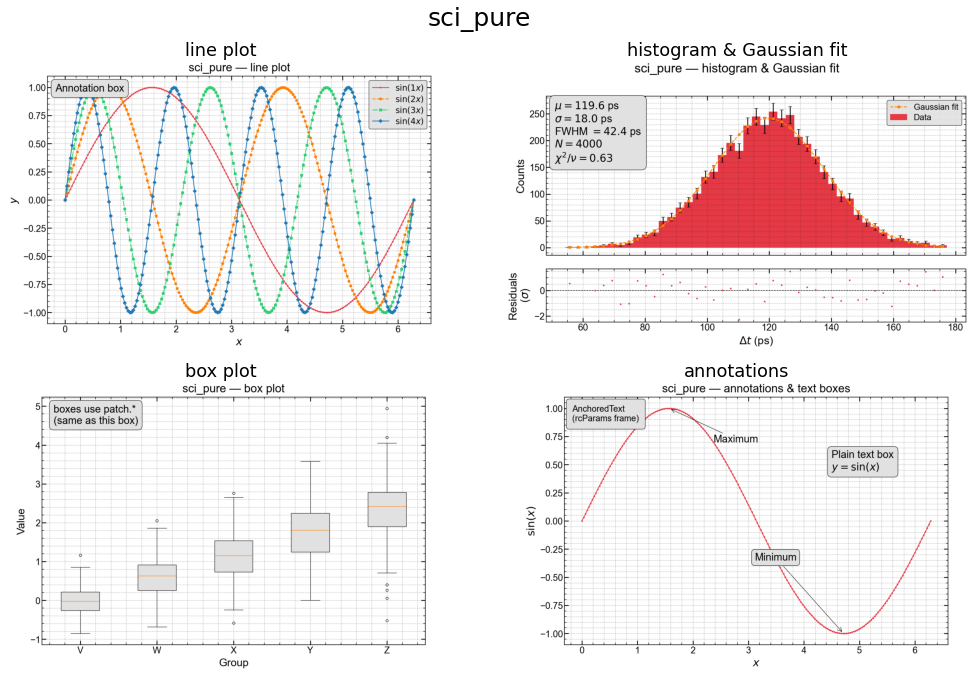
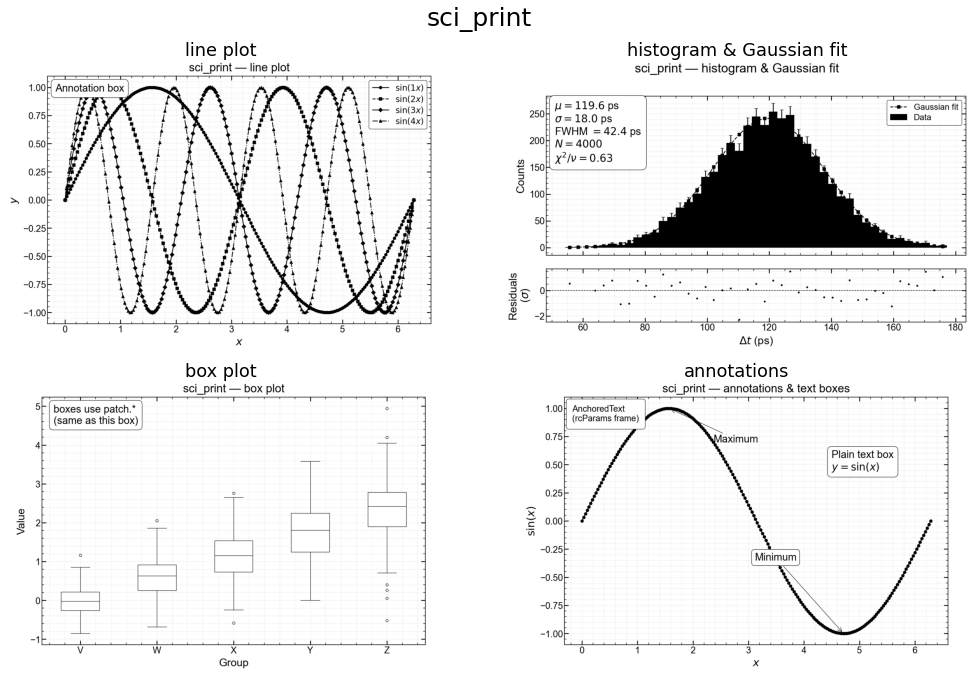
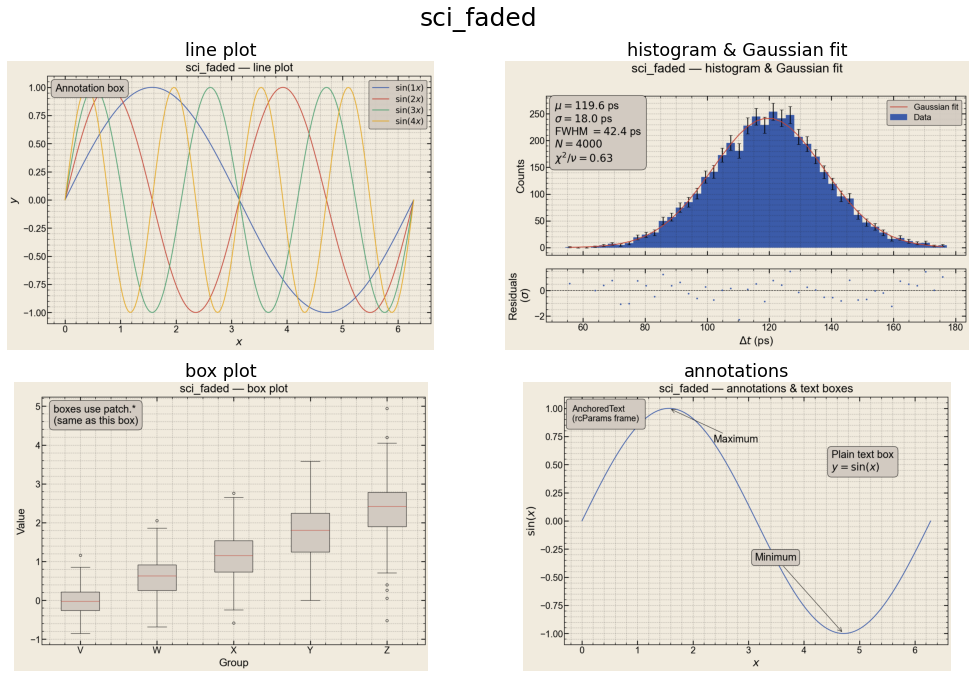
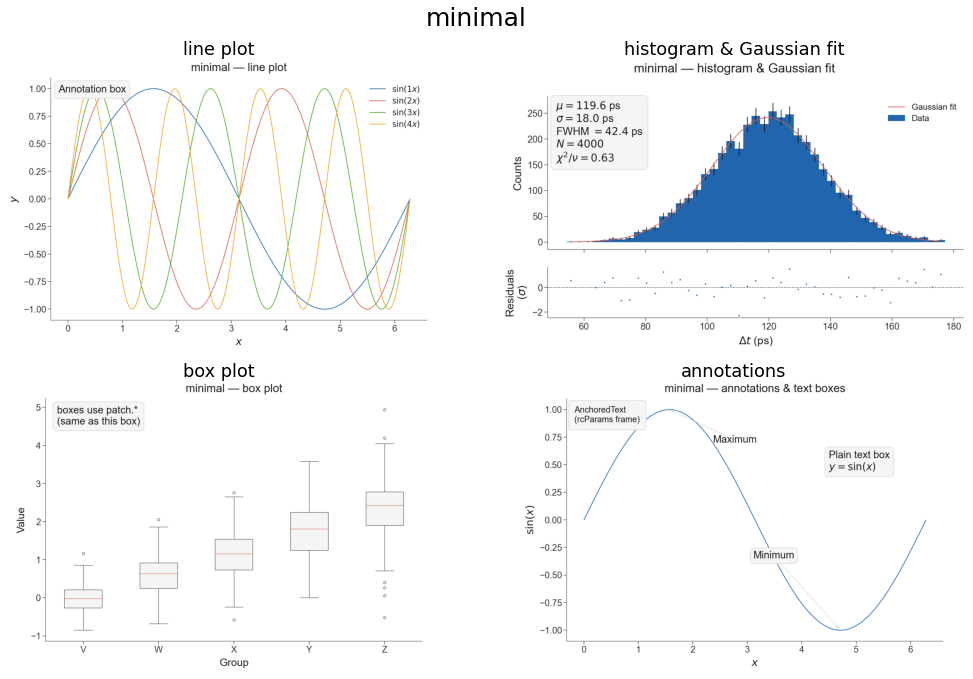
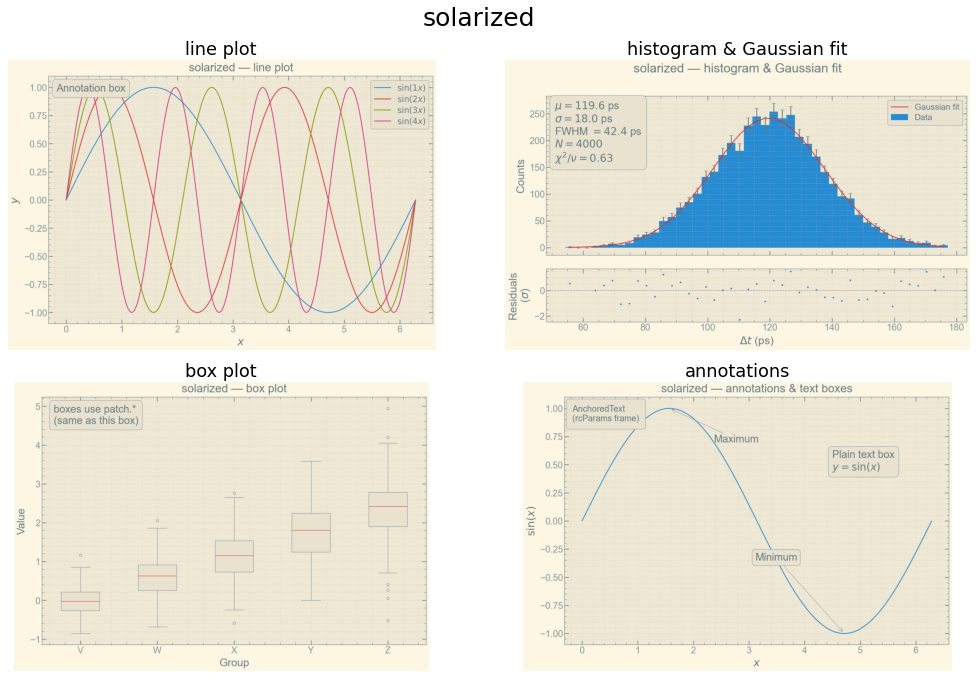
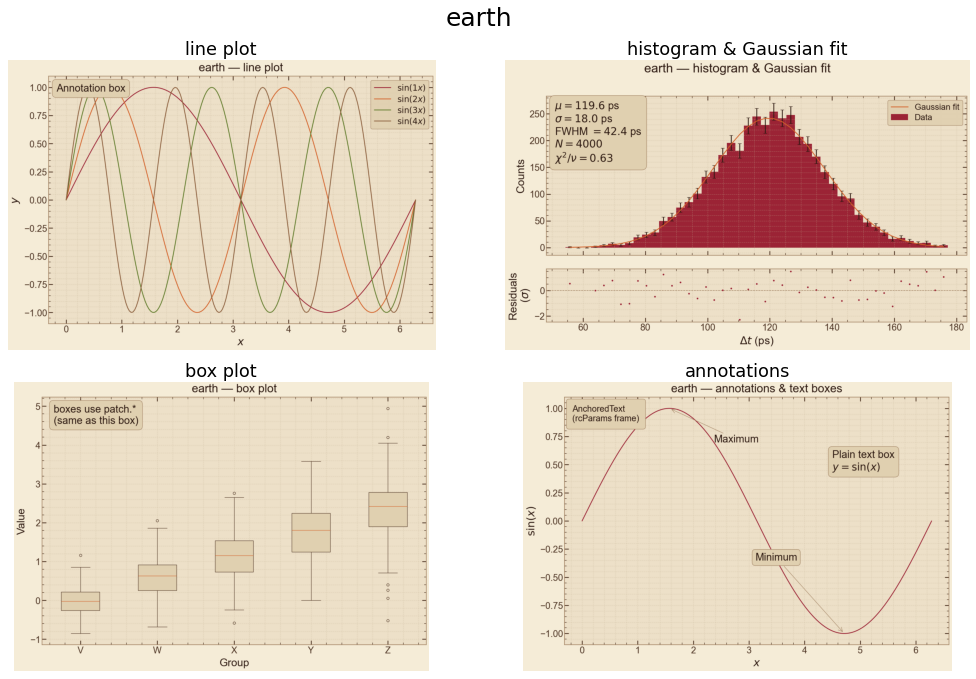
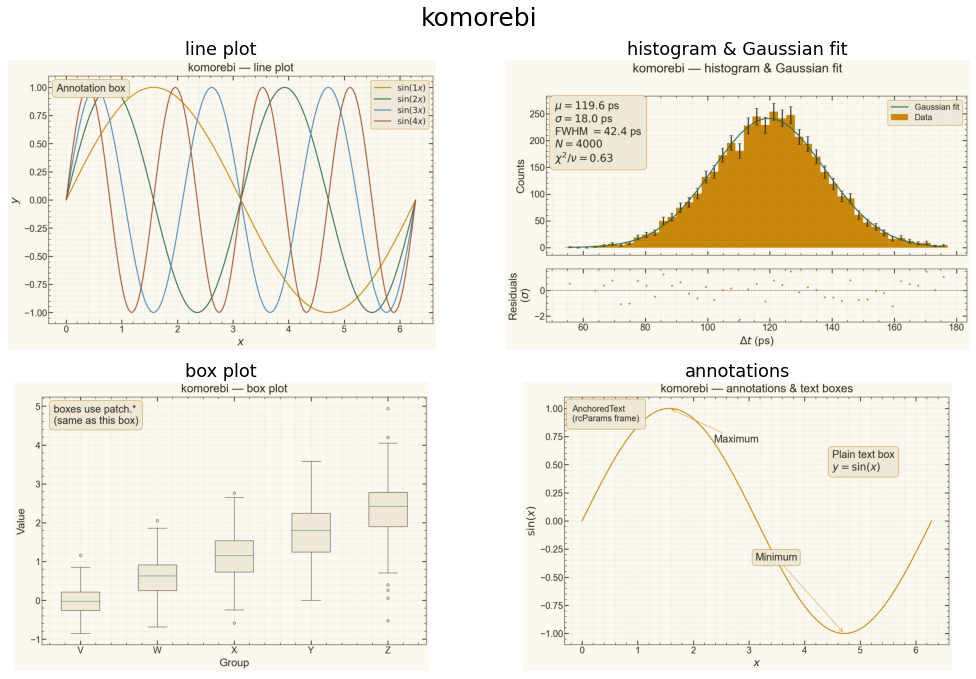
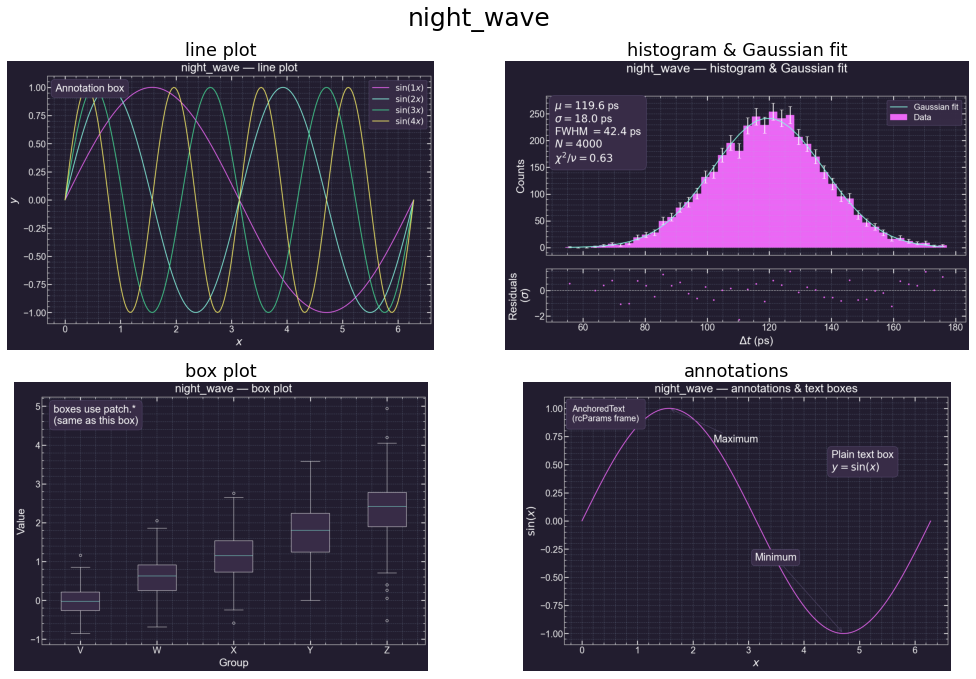
Each block below shows a line plot, a histogram with a Gaussian fit, a box plot and the annotation set, all in that style.
sci_pub — colorblind-safe publication style
Anchored on rebeccapurple and darkorange, with the rest drawn from Okabe-Ito so the series stay distinguishable under protanopia, deuteranopia and tritanopia. Linestyle and marker cycling give a second differentiation axis, so the figure also survives black-and-white reproduction.
sci_pure — clean and vivid
sci_print — greyscale only
Every series is black. They are told apart by linestyle alone or by marker alone, so nothing is lost when the journal prints in greyscale. Legends and text boxes are white with a black border, for minimum ink.
sci_faded — sun-faded paper
minimal — Tufte-inspired
No grid, outward ticks, no minor ticks, only the bottom and left spines, and a frameless legend. The grid and minor-tick parameters are still declared in the sheet, so re-enabling them gives a coherent look rather than matplotlib defaults.
solarized — Solarized light
earth — warm and natural
komorebi — 木漏れ日, sunlight through leaves
The Japanese word for the dappled interplay of light and shadow under a forest canopy: deep gold for the sunlight shafts, forest green for the foliage, sky blue for the glimpses of sky, sienna for bark, leaf green and a dusk lavender.
blueprint — CAD drawing
night_wave — neon on dark
Heavily inspired by Dominik Haitz's
mplcyberpunk. This is the one style
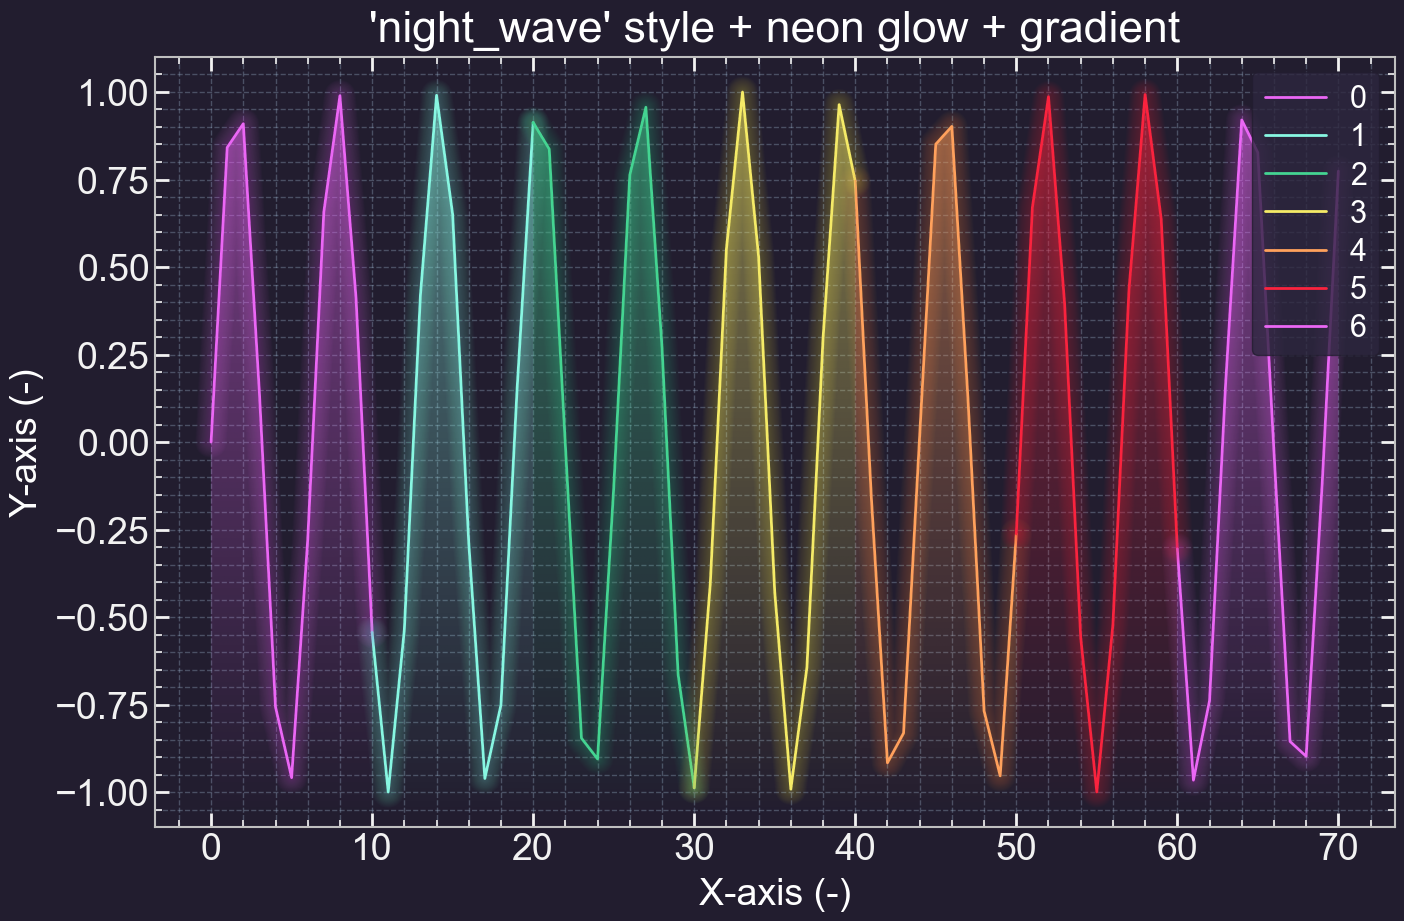
with helper functions: komorebi_mpl.functions.night_wave_func adds glow to
lines and scatter points, and gradient fills under lines, bars and histograms.
import komorebi_mpl as kmpl
from komorebi_mpl.functions import night_wave_func

plt = kmpl.use("night_wave")
fig, ax = plt.subplots()
ax.plot(x, y)
night_wave_func.make_lines_glow(ax)
Glow and gradient, applied to lines, bars, histograms and scatter:
dapkel — green to blue
daplis — colorblind-accessible, outward ticks
The eight-colour cycle maps onto recurring roles in the daplis plots: rebeccapurple for primary data, darkorange for fits, teal for single-pixel histograms, salmon for the full sensor, and so on.
Examples
-
examples/style_showcase.py— every style rendered across 14 plot types. Run it to produce the full set locally:python examples/style_showcase.py # all styles python examples/style_showcase.py komorebi earth # only these python examples/style_showcase.py --gallery # rebuild docs/gallery/Output lands in
examples/figures/showcase/<style>/, with the same 14 filenames in every folder — so two styles can be compared by opening the same name twice — plus a00_overview.pngcontact sheet per style. The data is regenerated from a fixed seed inside each plot function, so every style shows identical numbers. This output is gitignored;docs/gallery/holds the small committed subset shown above. -
examples/plot_examples.py— short, self-contained snippets per style and pernight_wavehelper.
Style structure
Every sheet declares the same 66 parameters in the same section order — Fonts, Figure, Axes, Ticks, Grid, Legend, Lines & markers, Box plots, Text boxes, Colors. Only the values differ. That makes styles diffable against each other, and it means switching styles never leaves a parameter sitting at a matplotlib default that some other style happened to set.
Three conventions are worth knowing:
- Typography is one scale in every style.
font.size: 30is the base and every other slot is deliberately smaller (axes.titlesize: 28,axes.labelsize: 26, tick labels22,legend.fontsize: 20). Free-floating text has no rcParam of its own, so in your own code use matplotlib relative sizes (fontsize="small","x-small", ...) — they are fractions of that base and therefore follow the style too. - Text boxes mirror the legend.
patch.facecolor/patch.edgecolorare set to the same values aslegend.facecolor/legend.edgecolor, so a text box and a legend are visually the same object.patch.*also colours box plots drawn withpatch_artist=True. - Box plots use the style's ink. Matplotlib defaults
boxplot.boxprops.color,.whiskerprops.color,.capprops.colorand.flierprops.*to literalblack, which disappears on a dark background, so every style sets them to its own tick colour. Medians and means already follow the property cycle (C1/C2) and are left alone.
Text boxes and annotations
ax.text(...) and ax.annotate(...) pick up the style automatically as long as
you don't pass explicit colours — give the bbox only a shape:
ax.text(0.02, 0.97, "Annotation", transform=ax.transAxes, va="top",
        bbox=dict(boxstyle="round,pad=0.4"))   # colours come from patch.*
Where matplotlib ignores the style
Two places hardcode colours that a style ought to own, and neither has an rcParam behind it, so they have to be passed by hand:
-
ax.bar(..., yerr=...)draws its error bars withecolor='k', hardcoded. On the dark styles that is a black error bar on a near-black background:ax.bar(x, y, yerr=err, ecolor=plt.rcParams["text.color"])
-
matplotlib.offsetbox.AnchoredTexthardcodes a white face and a black edge and ignorespatch.*entirely. Undernight_wave, whose text is near-white, that produces a white box with invisible text:import matplotlib as mpl from matplotlib.offsetbox import AnchoredText at = AnchoredText("text", loc="upper right", frameon=True) at.patch.set_facecolor(mpl.rcParams["patch.facecolor"]) at.patch.set_edgecolor(mpl.rcParams["patch.edgecolor"]) ax.add_artist(at)
Adding or editing a style
Copy any existing sheet in src/komorebi_mpl/styles/
and change the values, keeping every parameter and the section order intact —
the test suite enforces this:
pip install pytest
pytest tests/
The tests check that all sheets share one parameter set in one order, apply without matplotlib warnings, keep text boxes and legends in agreement, and draw nothing that vanishes into its own background.
Acknowledgment
Shout-out to Dominik Haitz, who wrote the mindblowing
mplcyberpunk package, and from which
the night_wave helper functions are adapted. Also check out John Garrett's
SciencePlots for
publication-ready plots.
License and contact info
This package is available under the MIT license. See LICENSE for more information. If you'd like to contact me, the author, feel free to write at sergei.kulkov23@gmail.com.
1 maintainer

Metadata
1 maintainer
Release files for komorebi-mpl 0.1.0
For a detailed explanation of source distributions (sdists) and built distributions (wheels), please see the package formats documentation.
Source distribution (sdist)
| File | Size | Uploaded | |
|---|---|---|---|
| komorebi_mpl-0.1.0.tar.gz | 8.3 MB | Details |
Built distribution (wheel)
| File | Interpreter | ABI | Platform | Reset |
|---|---|---|---|---|
| komorebi_mpl-0.1.0-py3-none-any.whl | Python 3 | none | any | Details |
Total release size: 8.3 MB
Release files / komorebi_mpl-0.1.0.tar.gz
| Download URL | komorebi_mpl-0.1.0.tar.gz |
|---|---|
| Size | 8.3 MB |
| Tags | Source |
|
SHA-256 checksum How to use checksums |
43dd46f1ccc58d585793af382322284e046fba3a395b666d94f3d66f210cbcaa
|
|
BLAKE2b-256 checksum How to use checksums |
9020934fbca5c6fbe1bc3cceff8c7c29b399fbad350ffad8fe446d0a48ec0690
|
| Upload date | |
|
Uploaded using Trusted Publishing? What is trusted publishing? |
Yes |
| Uploaded via |
twine/7.0.0 CPython/3.13.14
|
Provenance
Provenance describes where a file came from. On PyPI, provenance is shared via attestations, which provide a verifiable record of the build or publishing details. View details, limitations and caveats.


PyPI Publish Attestation
PyPI verified that this artifact, at this checksum, originated from the publisher listed below.
Signed by GitHub Actions, verified by PyPI on Aug 2, 2026.
Transparency logRelease files / komorebi_mpl-0.1.0-py3-none-any.whl
| Download URL | komorebi_mpl-0.1.0-py3-none-any.whl |
|---|---|
| Size | 33.4 kB |
| Tags | Python 3 |
|
SHA-256 checksum How to use checksums |
bc6fbb38ec3c527334b707ebfb189d77cc2e653cb797b705e19f6849e46bf11e
|
|
BLAKE2b-256 checksum How to use checksums |
1fa67e6b0294f5e67b90d611f2937e788fe2097d1fbeb6f98ef7fd01eb8e63c7
|
| Upload date | |
|
Uploaded using Trusted Publishing? What is trusted publishing? |
Yes |
| Uploaded via |
twine/7.0.0 CPython/3.13.14
|
Provenance
Provenance describes where a file came from. On PyPI, provenance is shared via attestations, which provide a verifiable record of the build or publishing details. View details, limitations and caveats.
PyPI Publish Attestation
PyPI verified that this artifact, at this checksum, originated from the publisher listed below.
Signed by GitHub Actions, verified by PyPI on Aug 2, 2026.
Transparency log













