Access kroki from python

Project description
kroki
Access kroki from python.
To install: pip install kroki
Read the overview below, or view/download/play this demo notebook to see how to use this package.
The kroki python package is a convenience package for you to be able to generate diagrams,
through kroki, getting your images as bytes or as ipython objects via python
functions or doing some "cell magic" in your jupyter notebooks.
I suggest you have a look at the kroki's excellent homepage where you'll be able to try different diagram types out. Don't miss the nice cheatsheet there.
Overview
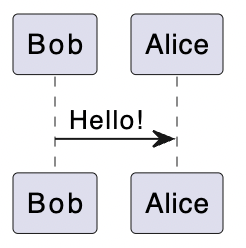
You can get the bytes of an image of a diagram like so:
from kroki import diagram_image_bytes

svn_bytes = diagram_image_bytes('Bob->Alice : Hello!')
# which you can then save in a file...
When in a jupyter notebook though, you have a more convenient function that will put those bytes into an IPython display object, which you can then display (will automatically call display if it's the last command of the cell), amongst other things.
from kroki import diagram_image

diagram_image('Bob->Alice : Hello!')
In both those functions, the default is diagram_type='plantuml' and output_format='svg'.
But you have other choices.
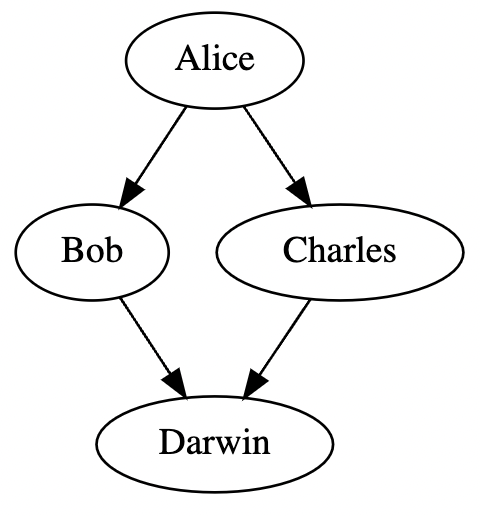
diagram_image('digraph D {Alice -> Bob, Charles -> Darwin}', diagram_type='graphviz')
png_bytes = diagram_image_bytes('Bob->Alice : Hello!', output_format='png')
png_bytes[:7]
b'\x89PNG\r\n\x1a'
And then, there's magic, which will allow you to write your diagram source directly in a notebook's cell.
%load_ext kroki
%%kroki

Bob->Alice : Hello!
The default diagram_type is still plantuml, but you can specify another type if you want.
%%kroki graphviz

digraph D {
    Alice -> Bob, Charles -> Darwin
}
To see what diagram types kroki supports through the diagram_types variable.
from kroki import diagram_types

print(diagram_types)
{'svgbob', 'vega', 'packetdiag', 'mermaid', 'structurizr', 'bytefield', 'vegalite', 'c4plantuml', 'pikchr', 'rackdiag', 'ditaa', 'wavedrom', 'nwdiag', 'graphviz', 'excalidraw', 'plantuml', 'erd', 'umlet', 'actdiag', 'nomnoml', 'bpmn', 'seqdiag', 'blockdiag'}
Not all output_format values are supported for all diagram types. To which are supported for which types, you can have a look at the output_formats dictionary, which which contains both the choices of diagram_type (as keys) and the corresponding output_format each support (as values).
from kroki import output_formats

output_formats['plantuml']
['png', 'svg', 'jpeg', 'base64']
output_formats['mermaid']
['svg']
output_formats['seqdiag']
['png', 'svg', 'pdf']
Misc
The kroki function is just an alias of diagram_image which itself, is the composition of diagram_image_bytes and bytes_to_image to get an iPython image object as your output (which results in displaying the image when it's the last command of your cell).
The default diagram_type of diagram_image is plantuml.
We also made some ready-to-use mermaid_image and graphviz_image by fixing diagram_type with functools.partial.
diagram_image = wrap(diagram_image_bytes, egress=bytes_to_image)
mermaid_image = wrap(
    partial(diagram_image_bytes, diagram_type='mermaid'), egress=bytes_to_image
)
graphviz_image = wrap(
    partial(diagram_image_bytes, diagram_type='graphviz'), egress=bytes_to_image
)
kroki = diagram_image  # alias
You can import these directory from kroki.
Release history Release notifications | RSS feed


Download files
Download the file for your platform. If you're not sure which to choose, learn more about installing packages.
Source Distribution
Built Distribution
Filter files by name, interpreter, ABI, and platform.
If you're not sure about the file name format, learn more about wheel file names.
Copy a direct link to the current filters
File details
Details for the file kroki-0.1.6.tar.gz.
File metadata
- Download URL: kroki-0.1.6.tar.gz
- Upload date:
- Size: 8.6 kB
- Tags: Source
- Uploaded using Trusted Publishing? No
- Uploaded via: twine/6.1.0 CPython/3.10.18
File hashes
| Algorithm | Hash digest | |
|---|---|---|
| SHA256 |
b098720c6cafbbe54dda5a849b04797893b8898f8eebf1c9b9b8d476c1b2da84
|
|
| MD5 |
8aff4d00880a1294eb4a972d5d65e0c6
|
|
| BLAKE2b-256 |
7b7fc72db20f9706fccdc72fe3fd8cfe9952f688cc64286b9a42192bc8191698
|
File details
Details for the file kroki-0.1.6-py3-none-any.whl.
File metadata
- Download URL: kroki-0.1.6-py3-none-any.whl
- Upload date:
- Size: 9.1 kB
- Tags: Python 3
- Uploaded using Trusted Publishing? No
- Uploaded via: twine/6.1.0 CPython/3.10.18
File hashes
| Algorithm | Hash digest | |
|---|---|---|
| SHA256 |
fed59cd101583d10ae85c03dde2afe12bee5a6c0b6b041a74f3b60396fdefbb0
|
|
| MD5 |
c986e2eb9790293db020dcf5d987efa3
|
|
| BLAKE2b-256 |
4a55a39a498ac5aee50677b3997fbbeeea834e7b201b47d685288bf58605f432
|


