
Install
One command, nothing to configure:
uvx labwatch-lite
That is the whole install. uvx fetches LabWatch, starts it, and opens the dashboard.
Prefer a permanent command? Any of these work:
uv tool install labwatch-lite   # then: labwatch
pipx install labwatch-lite      # then: labwatch
pip install labwatch-lite       # then: python -m labwatch
Why the package is called
labwatch-litebut the command islabwatchThe name
labwatchon PyPI belongs to an unrelated project (rbretschneider/labwatch_cli), so this project publishes under the distribution namelabwatch-liteto avoid silently installing someone else's tool. The import package and the console command both remainlabwatch; only the name you type intopip/uvx/pipxdiffers. Installing plainlabwatchfrom PyPI will give you the other project, not this one.
No NVIDIA GPU yet? Explore the UI with synthetic data:
uvx labwatch-lite --demo
Use
labwatch                     # start and open the dashboard
labwatch --port 8124         # a different port
labwatch --demo              # synthetic GPUs, no hardware needed
labwatch doctor              # can this machine run LabWatch?
labwatch start --background  # run it in the background
labwatch status              # is it running, and what are the GPUs doing
labwatch stop                # stop the background instance
labwatch open                # open the dashboard again
labwatch doctor is the answer to "why is it not working":
LabWatch Doctor

✓ Python — 3.12.7
✓ Dependencies — 7 runtime packages importable
✓ NVML — available (driver 580.173.02)
✓ GPUs — 8 detected
  8 × NVIDIA GeForce RTX 4090
✓ Port — 127.0.0.1:8123 available
✓ Database — /home/you/.local/share/labwatch
✓ Dashboard — bundled (640 KB)

✓ Ready — 8 GPUs available.
labwatch status is the one-liner:
LabWatch 1.1.0
  gpu-node-01  ·  http://127.0.0.1:8123

  4 busy / 8 GPUs  ·  4 free  driver 580.173.02

  GPU 0  NVIDIA GeForce RTX 4090    98.4%      33 GB / 48 GB   67°C   448 W  busy
  GPU 1  NVIDIA GeForce RTX 4090     0.0%       1 GB / 48 GB   31°C    16 W  free

  CPU 9%  ·  RAM 9%  ·  8 GPU processes
--json on status and doctor gives machine-readable output, which is what the
VS Code extension consumes.
VS Code
A lightweight extension puts the GPU state where you are already looking.
- Status bar:
GPU 4 busy / 8orGPU 0 98% · 33/48GB, refreshed on an interval. - LabWatch sidebar: one compact card per GPU — utilisation, VRAM, temperature.
- Open Full Dashboard: jumps to the web UI for history, processes and charts.
It works locally and over Remote-SSH: the extension runs in the remote workspace, sees the remote GPUs, and VS Code forwards the dashboard port to your browser automatically. LabWatch is never reimplemented inside the editor — the extension is a view onto the same collector.
See vscode-extension/README.md to build and install
it from source (the Marketplace listing is not published yet).
What it shows
| GPU telemetry | Utilisation, VRAM, temperature, power (with its limit), fan, SM/memory clocks, persistence mode, process count for every NVIDIA device. |
| GPU processes | NVML compute PIDs joined to OS process data: user, full command line, CPU %, resident memory, runtime. Cross-user on a shared server. |
| Host telemetry | CPU (usage, cores, frequency, load average), RAM, every real filesystem, hostname, OS, kernel, uptime. |
| History | CPU, RAM, disk, GPU utilisation, VRAM, temperature and power persisted to SQLite, charted over1H / 6H / 24H. |
| Process table | Sort any numeric column, filter by GPU, search across PID, name, command and user. |
| Graceful degradation | No driver, no GPU, an unsupported sensor or a process that exits mid-query showsN/A — never a broken page. |
| Themes | System / Light / Dark, applied before first paint. |
| Read-only | LabWatch never starts, stops or signals a workload. |
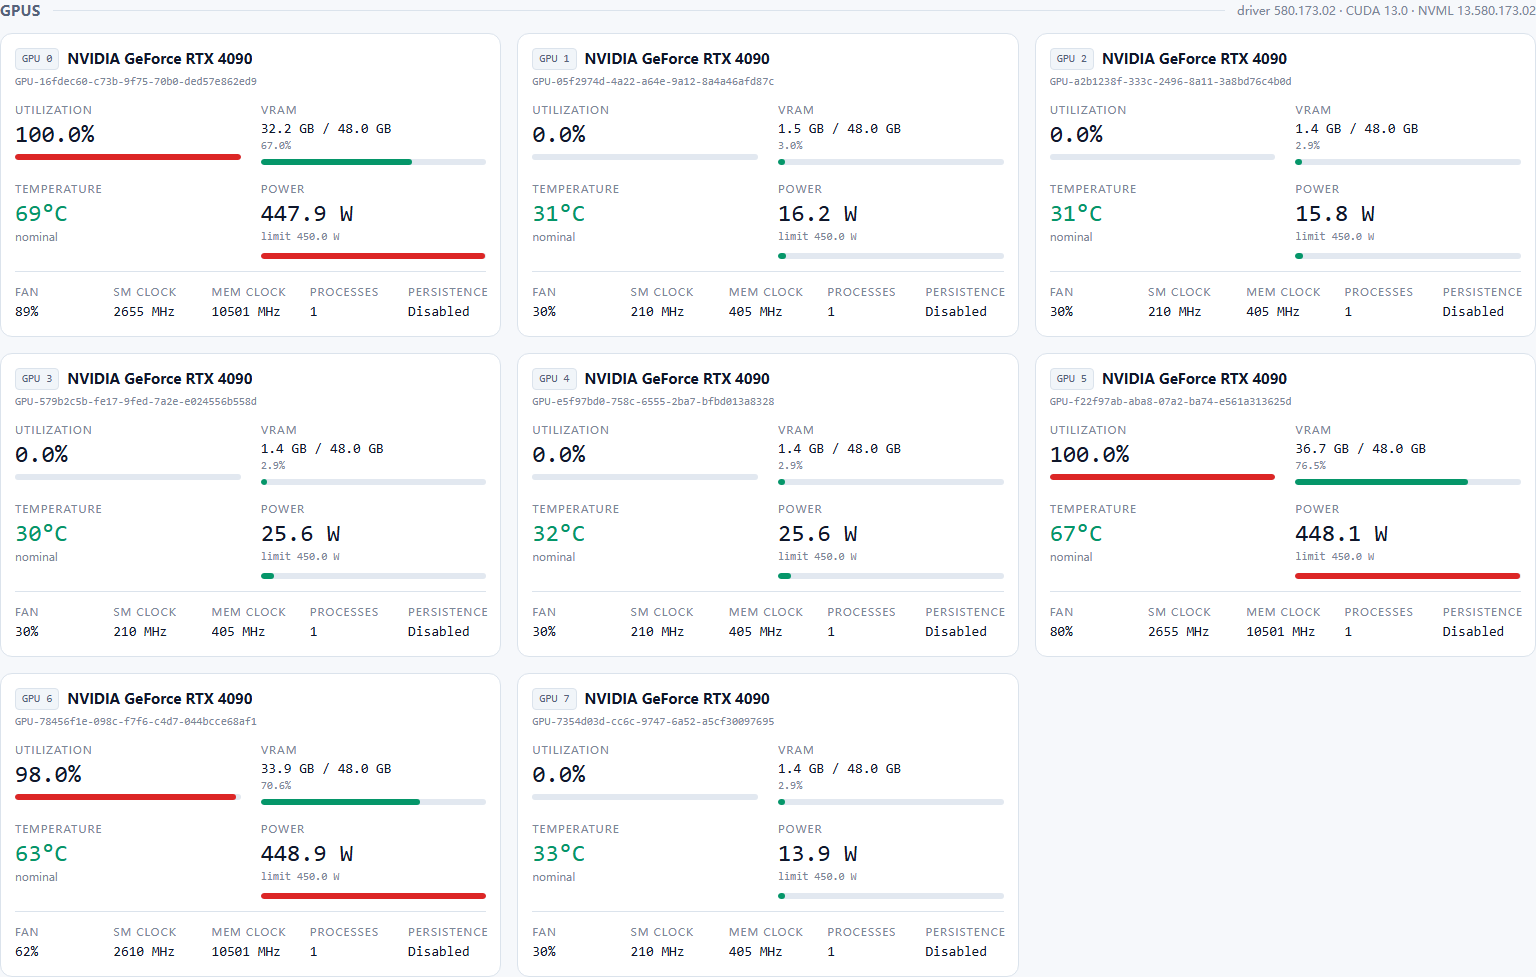 One card per GPU — eight RTX 4090s under live load |
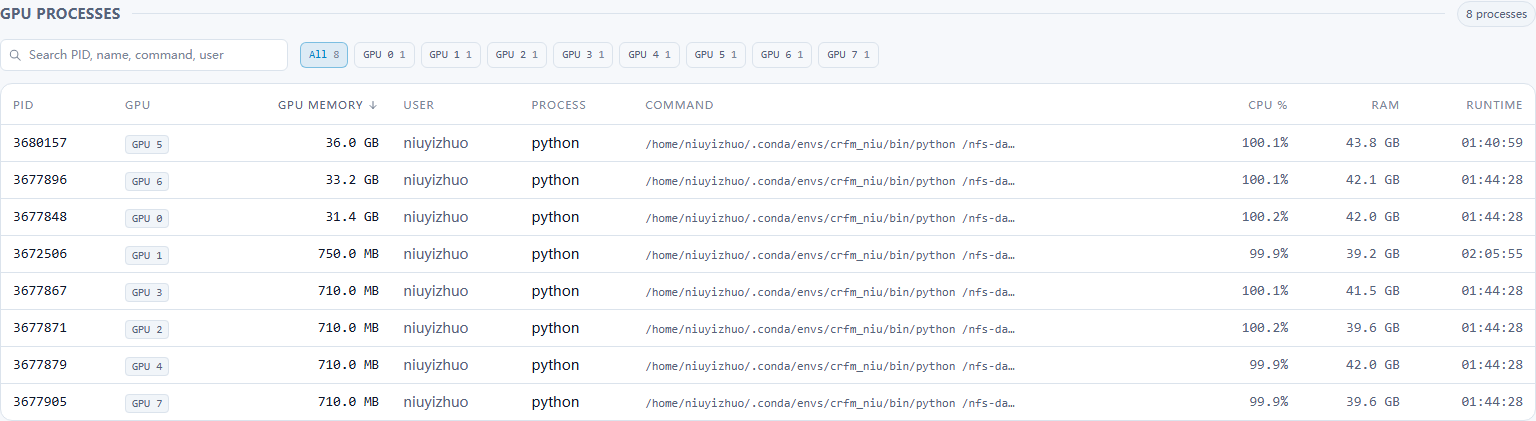 GPU processes — sortable, filterable, searchable |
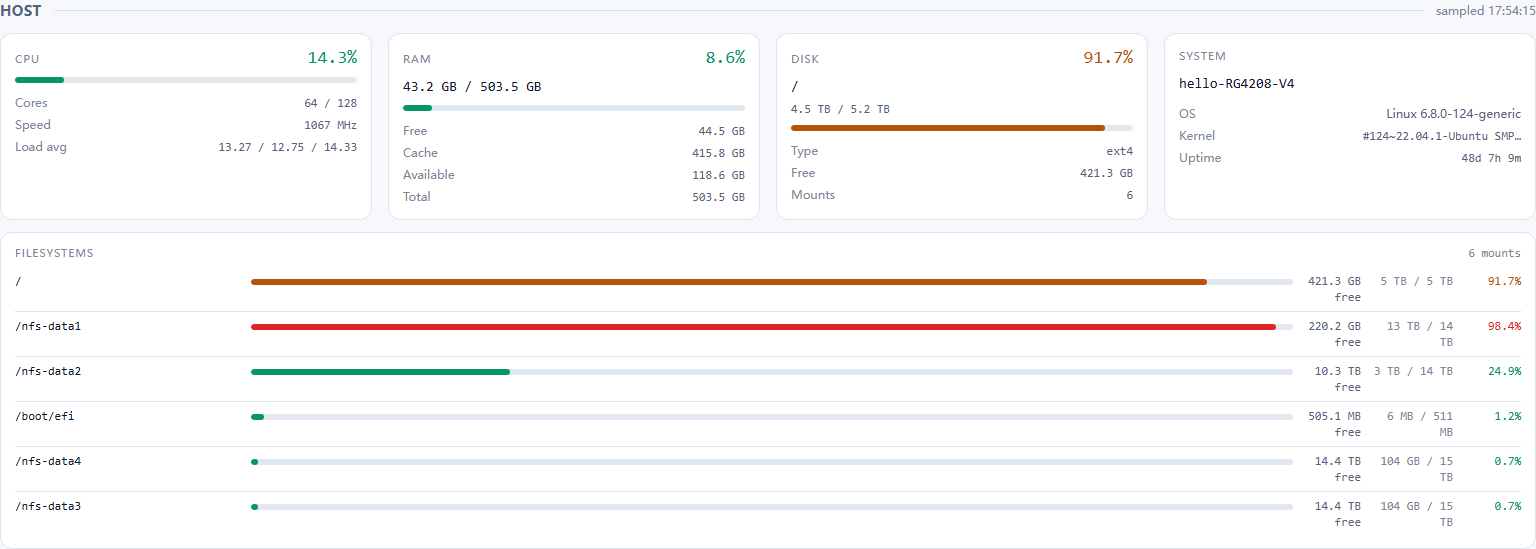 Host overview — CPU, RAM, every filesystem |
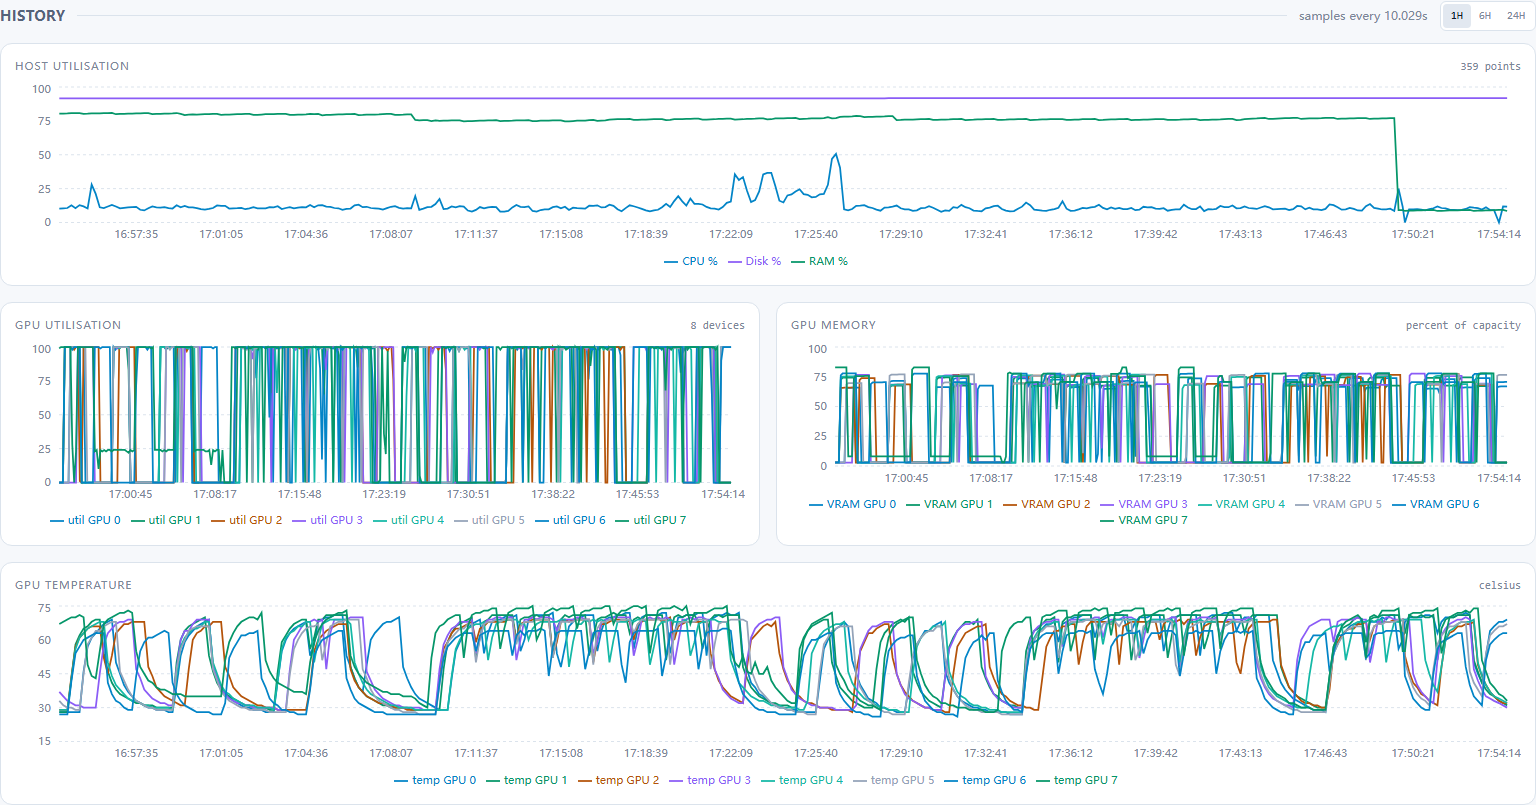 History — 1H / 6H / 24H |
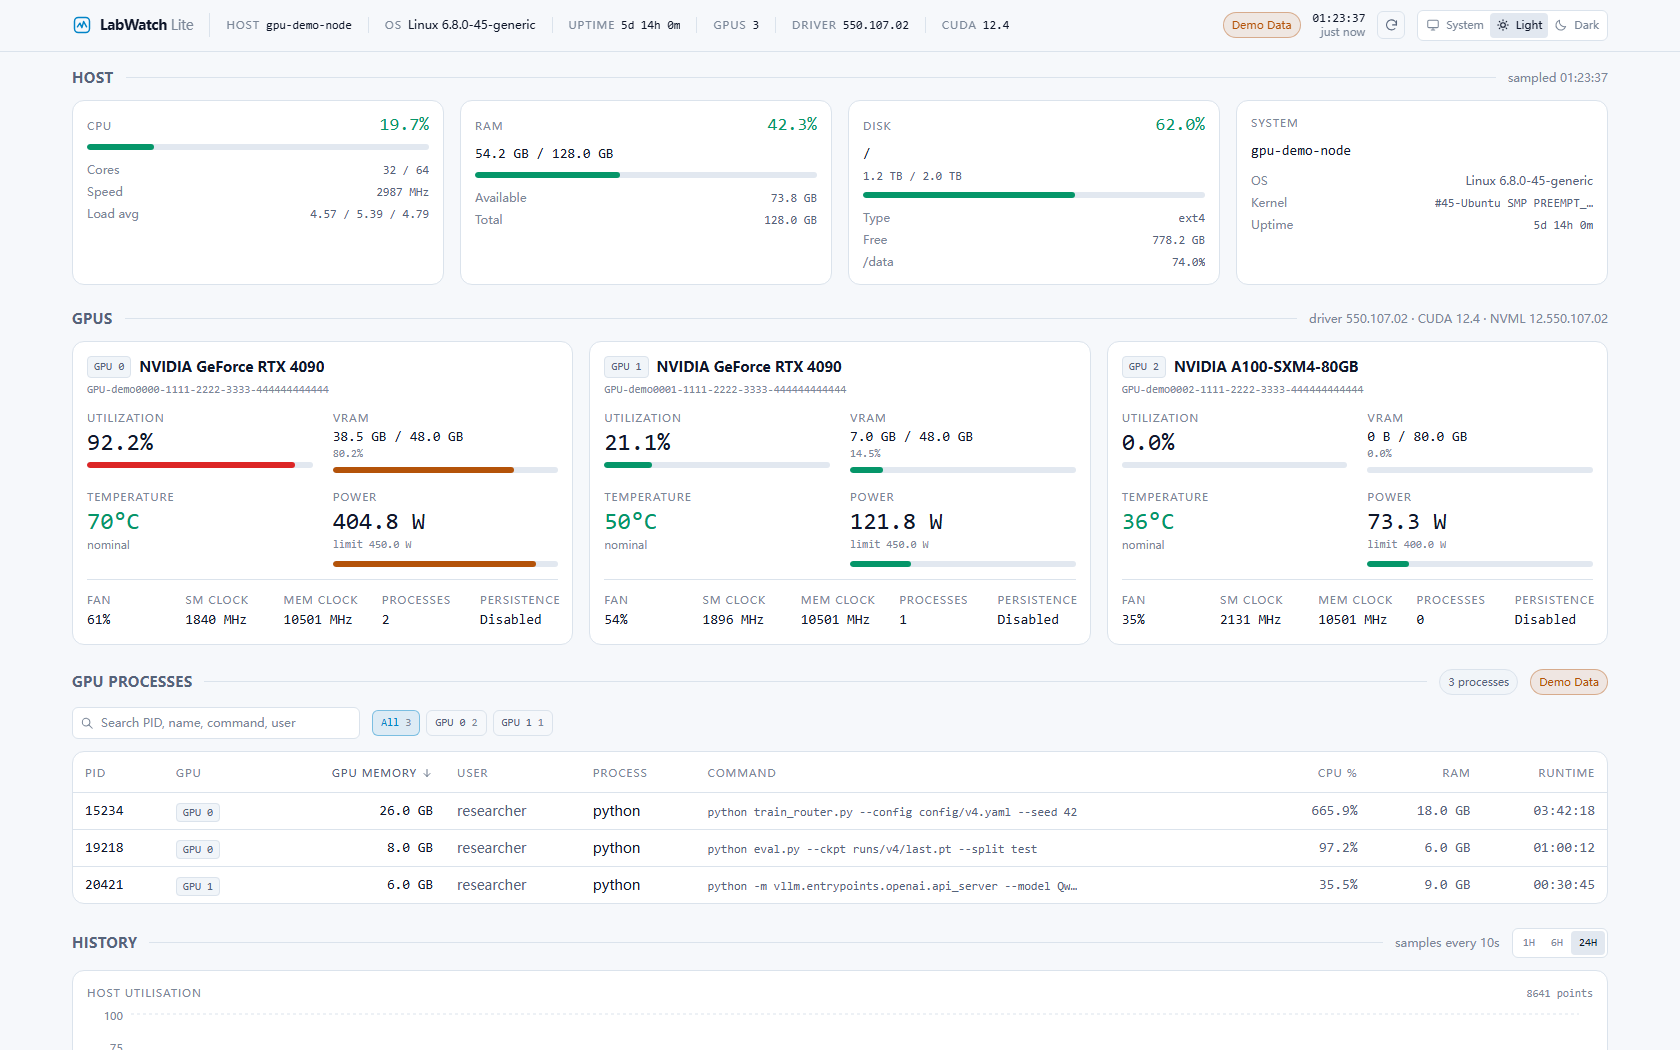 Light theme — same information density |
|
Configuration
Everything is an environment variable with the LABWATCH_ prefix; the full list
is in .env.example.
The common ones:
| Variable | Default | Purpose |
|---|---|---|
LABWATCH_PORT |
8000 |
Port to serve on (8123 through the labwatch CLI). |
LABWATCH_HOST |
0.0.0.0 |
Bind address. Use127.0.0.1 to keep it local. |
LABWATCH_DATA_DIR |
platform data dir | Wherelabwatch.db lives. |
LABWATCH_POLL_INTERVAL |
2 |
Live refresh interval, seconds. |
LABWATCH_HISTORY_INTERVAL |
10 |
History write interval, seconds. |
LABWATCH_RETENTION_HOURS |
24 |
How long history is kept. |
LABWATCH_DEMO_MODE |
false |
Synthetic data, labelledDemo Data. |
LABWATCH_INCLUDE_ALL_MOUNTS |
true |
Report every real filesystem, not just/. |
LABWATCH_COLLECT_COMMANDS |
true |
Resolve full process command lines. |
LABWATCH_PROCESS_LIMIT |
64 |
GPU processes enriched per sample. |
LABWATCH_INCLUDE_GRAPHICS_PROCESSES |
false |
Also list graphics contexts. Noisy on Windows desktops. |
LABWATCH_STATIC_DIR |
(bundled dashboard) | Serve a different pre-built frontend, e.g. in Docker. |
The quick start above uses the CLI's defaults (127.0.0.1:8123). labwatch
sets these variables for the server it starts; running labwatch serve or the
server module directly uses the defaults in the table.
Architecture
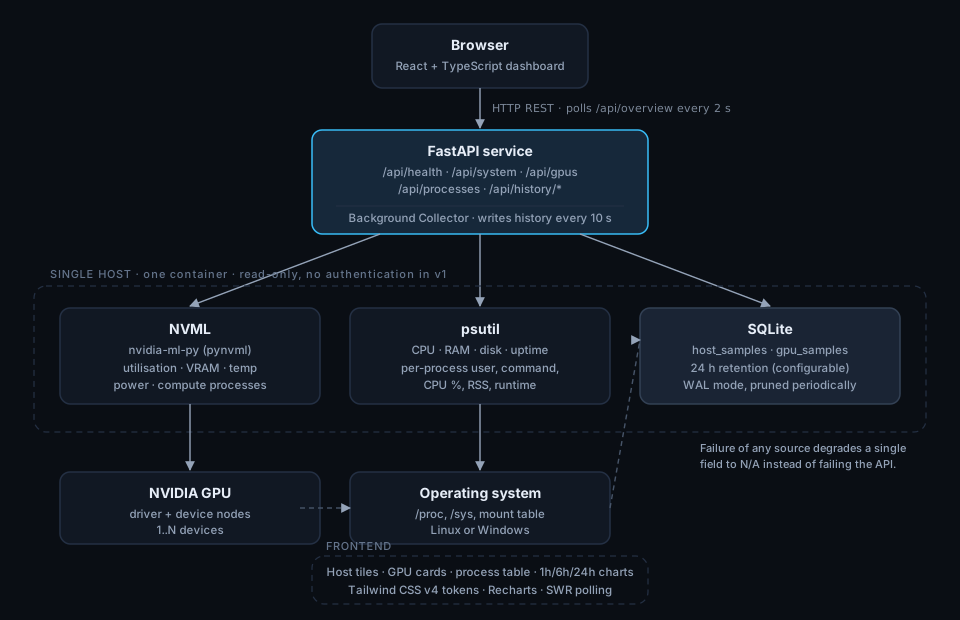
One process, one host, three data sources: NVML for GPU telemetry and compute
process IDs, psutil for host metrics and process enrichment, SQLite for
history. The dashboard polls /api/overview, so a refresh is a single round trip,
and polling pauses while the tab is hidden.
The built dashboard ships inside the Python package, which is why uvx labwatch-lite
needs no Node toolchain. v1 deliberately has no WebSockets, no queue, no cache
layer and no authentication: at a two second refresh they would add operational
surface without changing the experience.
labwatch/
├── labwatch/                 # the Python package
│   ├── cli/                  # labwatch doctor / status / start / stop
│   ├── server/               # FastAPI app, collectors, services
│   └── ui/                   # the built dashboard, shipped in the wheel
├── vscode-extension/         # status bar, sidebar, open-dashboard
├── docker-compose.yml        # server deployment option
└── docs/                     # report, acceptance checklist, screenshots
Advanced deployment
Docker is the right answer for a shared server, not for a laptop:
docker compose up -d
GPU access needs the NVIDIA Container Toolkit on the host. Without a GPU the container still monitors CPU, RAM and disk.
From source
git clone https://github.com/Galaxy-Chjs/LabWatch.git
cd labwatch
pip install -e ".[dev]"
labwatch --demo
The dashboard is committed under labwatch/ui, so a source checkout needs no npm
either. Only rebuild it if you change the frontend:
cd frontend && npm install && npm run build # writes into labwatch/ui
API
Interactive documentation is at /api/docs.
| Endpoint | Returns |
|---|---|
GET /api/health |
Service, database, NVML and collector state. |
GET /api/overview |
System + GPUs + processes in one payload. |
GET /api/system |
Host CPU, memory, filesystems, uptime. |
GET /api/gpus |
Every GPU, includingavailable/error when NVML is unusable. |
GET /api/processes |
GPU processes;?gpu_index=1 filters to one device. |
GET /api/history/system?range=1h |
Host history;range is 1h, 6h or 24h. |
GET /api/history/gpus |
GPU history for all devices. |
curl -s localhost:8123/api/overview | jq '.gpus.gpus[] | {index, utilization_percent, temperature_c}'
Testing
pip install -e ".[dev]"
pytest              # 179 backend tests
ruff check labwatch tests

cd frontend
npm run test        # 77 frontend tests
npm run e2e         # 8 Playwright tests, starts its own demo backend

cd ../vscode-extension
npm install && npm run compile && npm test   # 13 extension tests
CI additionally verifies that labwatch/ui matches the frontend sources, that the
wheel contains and serves the dashboard, and that the Docker image comes up
healthy.
Tech stack
Package hatchling · console-script entry point · standard-library-only CLI Backend Python 3.10+ · FastAPI · pydantic-settings · psutil · nvidia-ml-py · SQLAlchemy 2 · SQLite · pytest Frontend React 19 · TypeScript (strict) · Vite · Tailwind CSS v4 · Recharts · SWR · Vitest · Testing Library Editor VS Code extension (TypeScript) Deployment Docker (multi-stage) · Docker Compose · GitHub Actions
Limitations
- Single host. LabWatch monitors the machine it runs on.
- No authentication. Intended for trusted private networks; process command lines can be sensitive. Use a reverse proxy if you must expose it.
- NVIDIA only. AMD and Intel GPUs are not read.
- Graphics contexts on Windows are noisy; compute processes are the default.
- Load average is
N/Aon Windows, which does not expose it. uvx labwatch-liteneeds a published release. Packaging and verification are in place and tested against the built wheel; the PyPI publication itself has not been done, so for now useuvx --from <path-or-wheel> labwatch.
Roadmap
- Publish to PyPI so
uvx labwatch-literesolves without--from - VS Code extension on the Marketplace
- Prometheus
/metricsexport - Threshold alerts (VRAM, temperature, disk) with webhook delivery
- Multi-host aggregation
Documentation
docs/PROJECT_REPORT.html— consolidated report (English + 中文): features, architecture, test results, every bug found and fixed, release readiness.docs/ACCEPTANCE.md— acceptance checklist with measured results, including the 8-GPU server validation.- docs/RELEASING.md — what a human has to do: GitHub, PyPI (so
uvx labwatch-liteworks) and the VS Code Marketplace.
License
LabWatch is intended for trusted private networks by default. It performs no authentication and may reveal process command lines.
1 maintainer

Download files
Download the file for your platform. If you're not sure which to choose, learn more about installing packages.
Source Distribution
Built Distribution
Filter files by name, interpreter, ABI, and platform.
If you're not sure about the file name format, learn more about wheel file names.
Copy a direct link to the current filters
File details
Details for the file labwatch_lite-1.1.0.tar.gz.
File metadata
- Download URL: labwatch_lite-1.1.0.tar.gz
- Upload date:
- Size: 3.2 MB
- Tags: Source
- Uploaded using Trusted Publishing? Yes
- Uploaded via:
twine/7.0.0 CPython/3.13.14
File hashes
| Algorithm | Hash digest | |
|---|---|---|
| SHA256 |
629757d6d7e5e197574378788cf1580e91db18ab38b555e713c98267a1ba2a19
|
|
| MD5 |
daf9b4770882bde2a1a1c1078d9bd40b
|
|
| BLAKE2b-256 |
4d4957aed9414ebea38359e5e8582bf93744712312f05567694fb369a9547432
|
Provenance
The following attestation bundles were made for labwatch_lite-1.1.0.tar.gz:
Publisher:
release.yml on Galaxy-Chjs/LabWatch
-
Statement:
-
Statement type:
https://in-toto.io/Statement/v1 -
Predicate type:
https://docs.pypi.org/attestations/publish/v1 -
Subject name:
labwatch_lite-1.1.0.tar.gz -
Subject digest:
629757d6d7e5e197574378788cf1580e91db18ab38b555e713c98267a1ba2a19 - Sigstore transparency entry: 2793907888
- Sigstore integration time:
-
Permalink:
Galaxy-Chjs/LabWatch@0e649080d2b328f984665c58d4ec45f3ed3c0804 -
Branch / Tag:
refs/tags/v1.1.0 - Owner: https://github.com/Galaxy-Chjs
-
Access:
public
-
Token Issuer:
https://token.actions.githubusercontent.com -
Runner Environment:
github-hosted -
Publication workflow:
release.yml@0e649080d2b328f984665c58d4ec45f3ed3c0804 -
Trigger Event:
push
-
Statement type:
File details
Details for the file labwatch_lite-1.1.0-py3-none-any.whl.
File metadata
- Download URL: labwatch_lite-1.1.0-py3-none-any.whl
- Upload date:
- Size: 256.0 kB
- Tags: Python 3
- Uploaded using Trusted Publishing? Yes
- Uploaded via:
twine/7.0.0 CPython/3.13.14
File hashes
| Algorithm | Hash digest | |
|---|---|---|
| SHA256 |
a19c196425997f0313e2216a35b5705605836ab441b8aa8506ccd05617fb5f7a
|
|
| MD5 |
24a859843f0428843061dd0862003d11
|
|
| BLAKE2b-256 |
19e5988a1a1bd80b2ec18260eadfc302a335c1335b1a24ea8532608e157e0c0d
|
Provenance
The following attestation bundles were made for labwatch_lite-1.1.0-py3-none-any.whl:
Publisher:
release.yml on Galaxy-Chjs/LabWatch
-
Statement:
-
Statement type:
https://in-toto.io/Statement/v1 -
Predicate type:
https://docs.pypi.org/attestations/publish/v1 -
Subject name:
labwatch_lite-1.1.0-py3-none-any.whl -
Subject digest:
a19c196425997f0313e2216a35b5705605836ab441b8aa8506ccd05617fb5f7a - Sigstore transparency entry: 2793907936
- Sigstore integration time:
-
Permalink:
Galaxy-Chjs/LabWatch@0e649080d2b328f984665c58d4ec45f3ed3c0804 -
Branch / Tag:
refs/tags/v1.1.0 - Owner: https://github.com/Galaxy-Chjs
-
Access:
public
-
Token Issuer:
https://token.actions.githubusercontent.com -
Runner Environment:
github-hosted -
Publication workflow:
release.yml@0e649080d2b328f984665c58d4ec45f3ed3c0804 -
Trigger Event:
push
-
Statement type:













