




landau.py
A library to calculate thermodynamic equilibria and plot phase diagrams of binary alloys in the (semi-)grand ensemble.
You supply a free energy model for each phase — analytic toy models, CALPHAD-style parametrizations, or interpolations of computed free energy data — and landau finds the stable phases, refines the phase boundaries and draws the diagram.
Installation
pip install landau
Quickstart
Phases are defined by their free energies. Two ideal solutions — a solid and a liquid — already give a full binary phase diagram:
import numpy as np
from landau import LinePhase, IdealSolution, plot_phase_diagram
from landau.calculate import calc_phase_diagram
from landau.phases import kB

solid = IdealSolution("solid",
    LinePhase("A",    fixed_concentration=0, line_energy=-2.0, line_entropy=1.0 * kB),
    LinePhase("B",    fixed_concentration=1, line_energy=-3.0, line_entropy=1.5 * kB))
liquid = IdealSolution("liquid",
    LinePhase("A(l)", fixed_concentration=0, line_energy=-1.9, line_entropy=2.5 * kB),
    LinePhase("B(l)", fixed_concentration=1, line_energy=-2.9, line_entropy=2.2 * kB))

df = calc_phase_diagram([solid, liquid], Ts=np.linspace(400, 1800, 100), mu=100)
plot_phase_diagram(df)
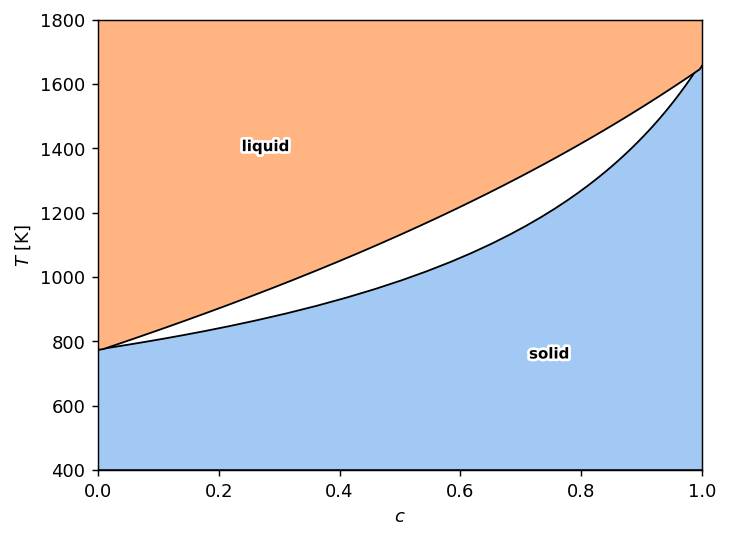
calc_phase_diagram returns a plain pandas dataframe of (T, mu, phase, c, phi)
samples that the plotting functions consume, so intermediate results stay easy
to inspect and post-process.
Real Systems
The same interface works with computed free energies. This Mg–Ca phase diagram is calculated from free energies of an Atomic Cluster Expansion potential, obtained by thermodynamic integration with calphy:
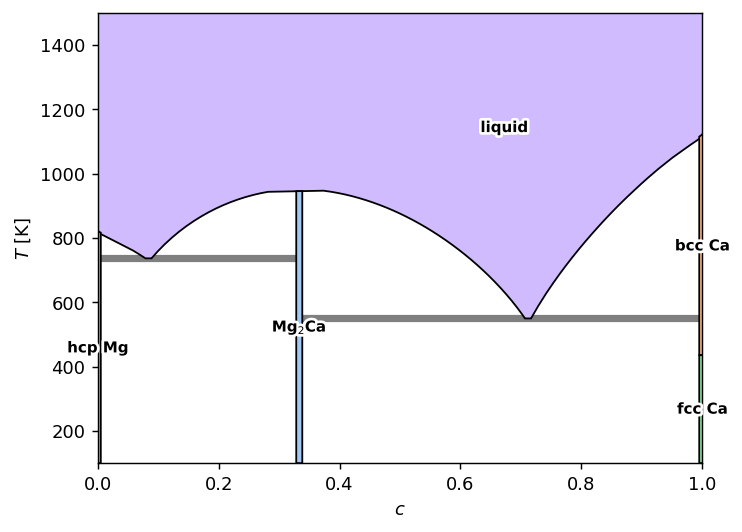
The Mg–Ca worked example goes from raw free energy samples to this diagram.
Looking Under the Hood
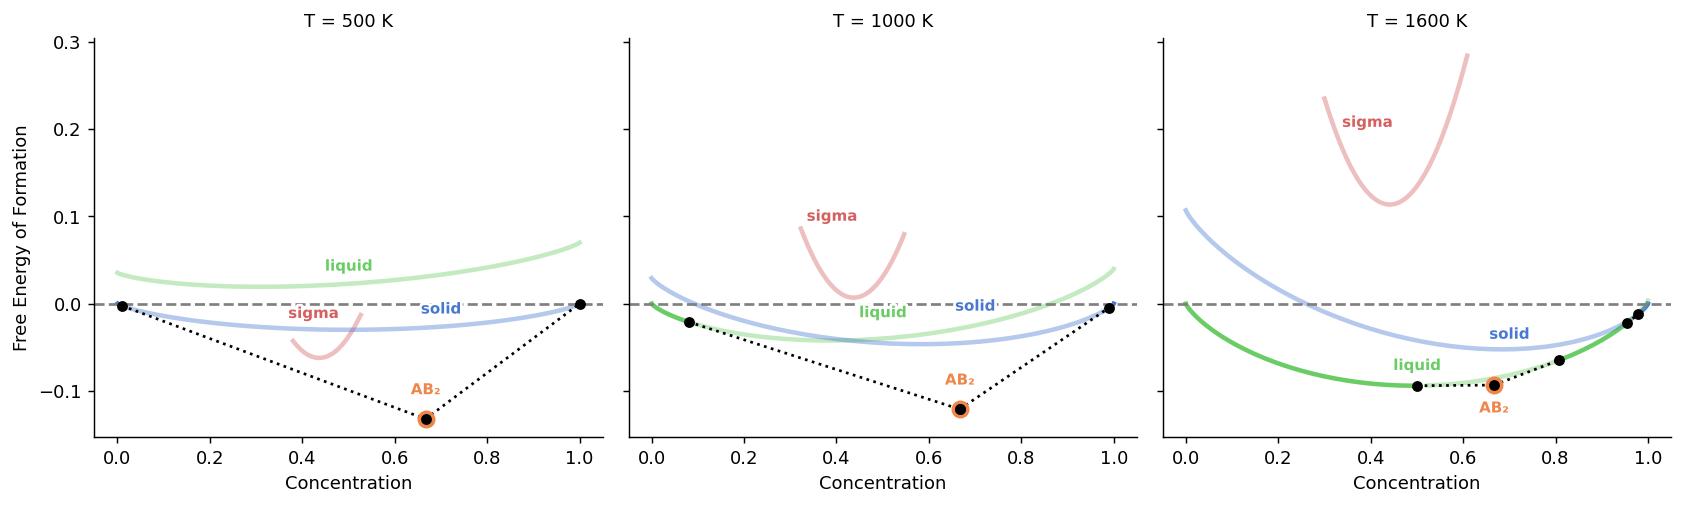
plot_excess_free_energy shows the free energy curves behind a diagram,
including metastable phases and the common tangent constructions that
determine the stable regions:
More Examples
The documentation walks through the full API, including the basic concepts, congruent and non-congruent melting, stoichiometric line compounds and point defects.
Citation
This code is part of a publication, please cite it accordingly if you use this package in your work
@article{poul2025automated,
    title = {Automated generation of structure datasets for machine learning potentials and alloys},
    journal = {npj Computational Materials},
    author = {Poul, Marvin and Huber, Liam and Neugebauer, J{\"o}rg},
    volume = {11},
    number = {1},
    pages = {174},
    year = {2025},
    doi = {10.1038/s41524-025-01669-4},
}
1 maintainer

Release files for landau 1.14.1
For a detailed explanation of source distributions (sdists) and built distributions (wheels), please see the package formats documentation.
Source distribution (sdist)
| File | Size | Uploaded | |
|---|---|---|---|
| landau-1.14.1.tar.gz | 23.9 MB | Details |
Release files / landau-1.14.1.tar.gz
| Download URL | landau-1.14.1.tar.gz |
|---|---|
| Size | 23.9 MB |
| Tags | Source |
|
SHA-256 checksum How to use checksums |
de9d28d43993090b8bc08960383feb4ee04c287fc18c659c1962e8db01364720
|
|
BLAKE2b-256 checksum How to use checksums |
fb661849a8fd159af20ec5939ca4f111ec2c20b8c139ca89cc0d139a4e9fbd0d
|
| Upload date | |
|
Uploaded using Trusted Publishing? What is trusted publishing? |
Yes |
| Uploaded via |
twine/6.1.0 CPython/3.13.7
|
Provenance
Provenance describes where a file came from. On PyPI, provenance is shared via attestations, which provide a verifiable record of the build or publishing details. View details, limitations and caveats.


PyPI Publish Attestation
PyPI verified that this artifact, at this checksum, originated from the publisher listed below.
Signed by GitHub Actions, verified by PyPI on Sep 15, 2026.
Transparency log













