

A terminal UI for monitoring Slurm HPC jobs — like htop for your cluster.








LazySlurm gives you a live overview of your running and past jobs, lets you read
stdout/stderr logs, inspect resource usage, monitor CPU and GPU activity on compute
nodes, cancel, edit or resubmit jobs, and watch how busy each partition is — all from a
single terminal. It runs against the local cluster or, with --remote, over a single
background SSH connection that handles two-factor authentication once at startup.
Jump to: Installation · Quick Start · Layout · Key Bindings · Detail Tabs · Metadata Tabs · Features · Job Cache · Remote Mode · Configuration · CLI Reference · Requirements
Every section below folds open — the headings are the menu.
Installation
Requires Python 3.10+ and access to Slurm CLI tools (squeue, sacct, scontrol).
# Install from PyPI (the distribution is named lazyslurm-py, the command is lazyslurm)
pip install lazyslurm-py

# Or with uv
uv tool install lazyslurm-py
From source:
# Clone the repository
git clone https://github.com/RobinU434/LazySlurm.git
cd LazySlurm

# Install with uv (recommended)
uv pip install -e .

# Or with pip
pip install -e .
You can also install the repository directly from remote via:
# Install with uv (recommended)
uv tool install git+ssh://git@github.com/RobinU434/LazySlurm.git

# Or via pip into the local python environment
pip install git+ssh://git@github.com/RobinU434/LazySlurm.git
Quick Start
# Run on a cluster login node
lazyslurm

# Run from your local machine, monitoring a remote cluster
lazyslurm --remote user@login.hpc.edu

# Customize refresh rate and time window
lazyslurm --refresh 3 --days 14

# Disable auto-refresh (manual refresh only with 'r')
lazyslurm --refresh off
Layout
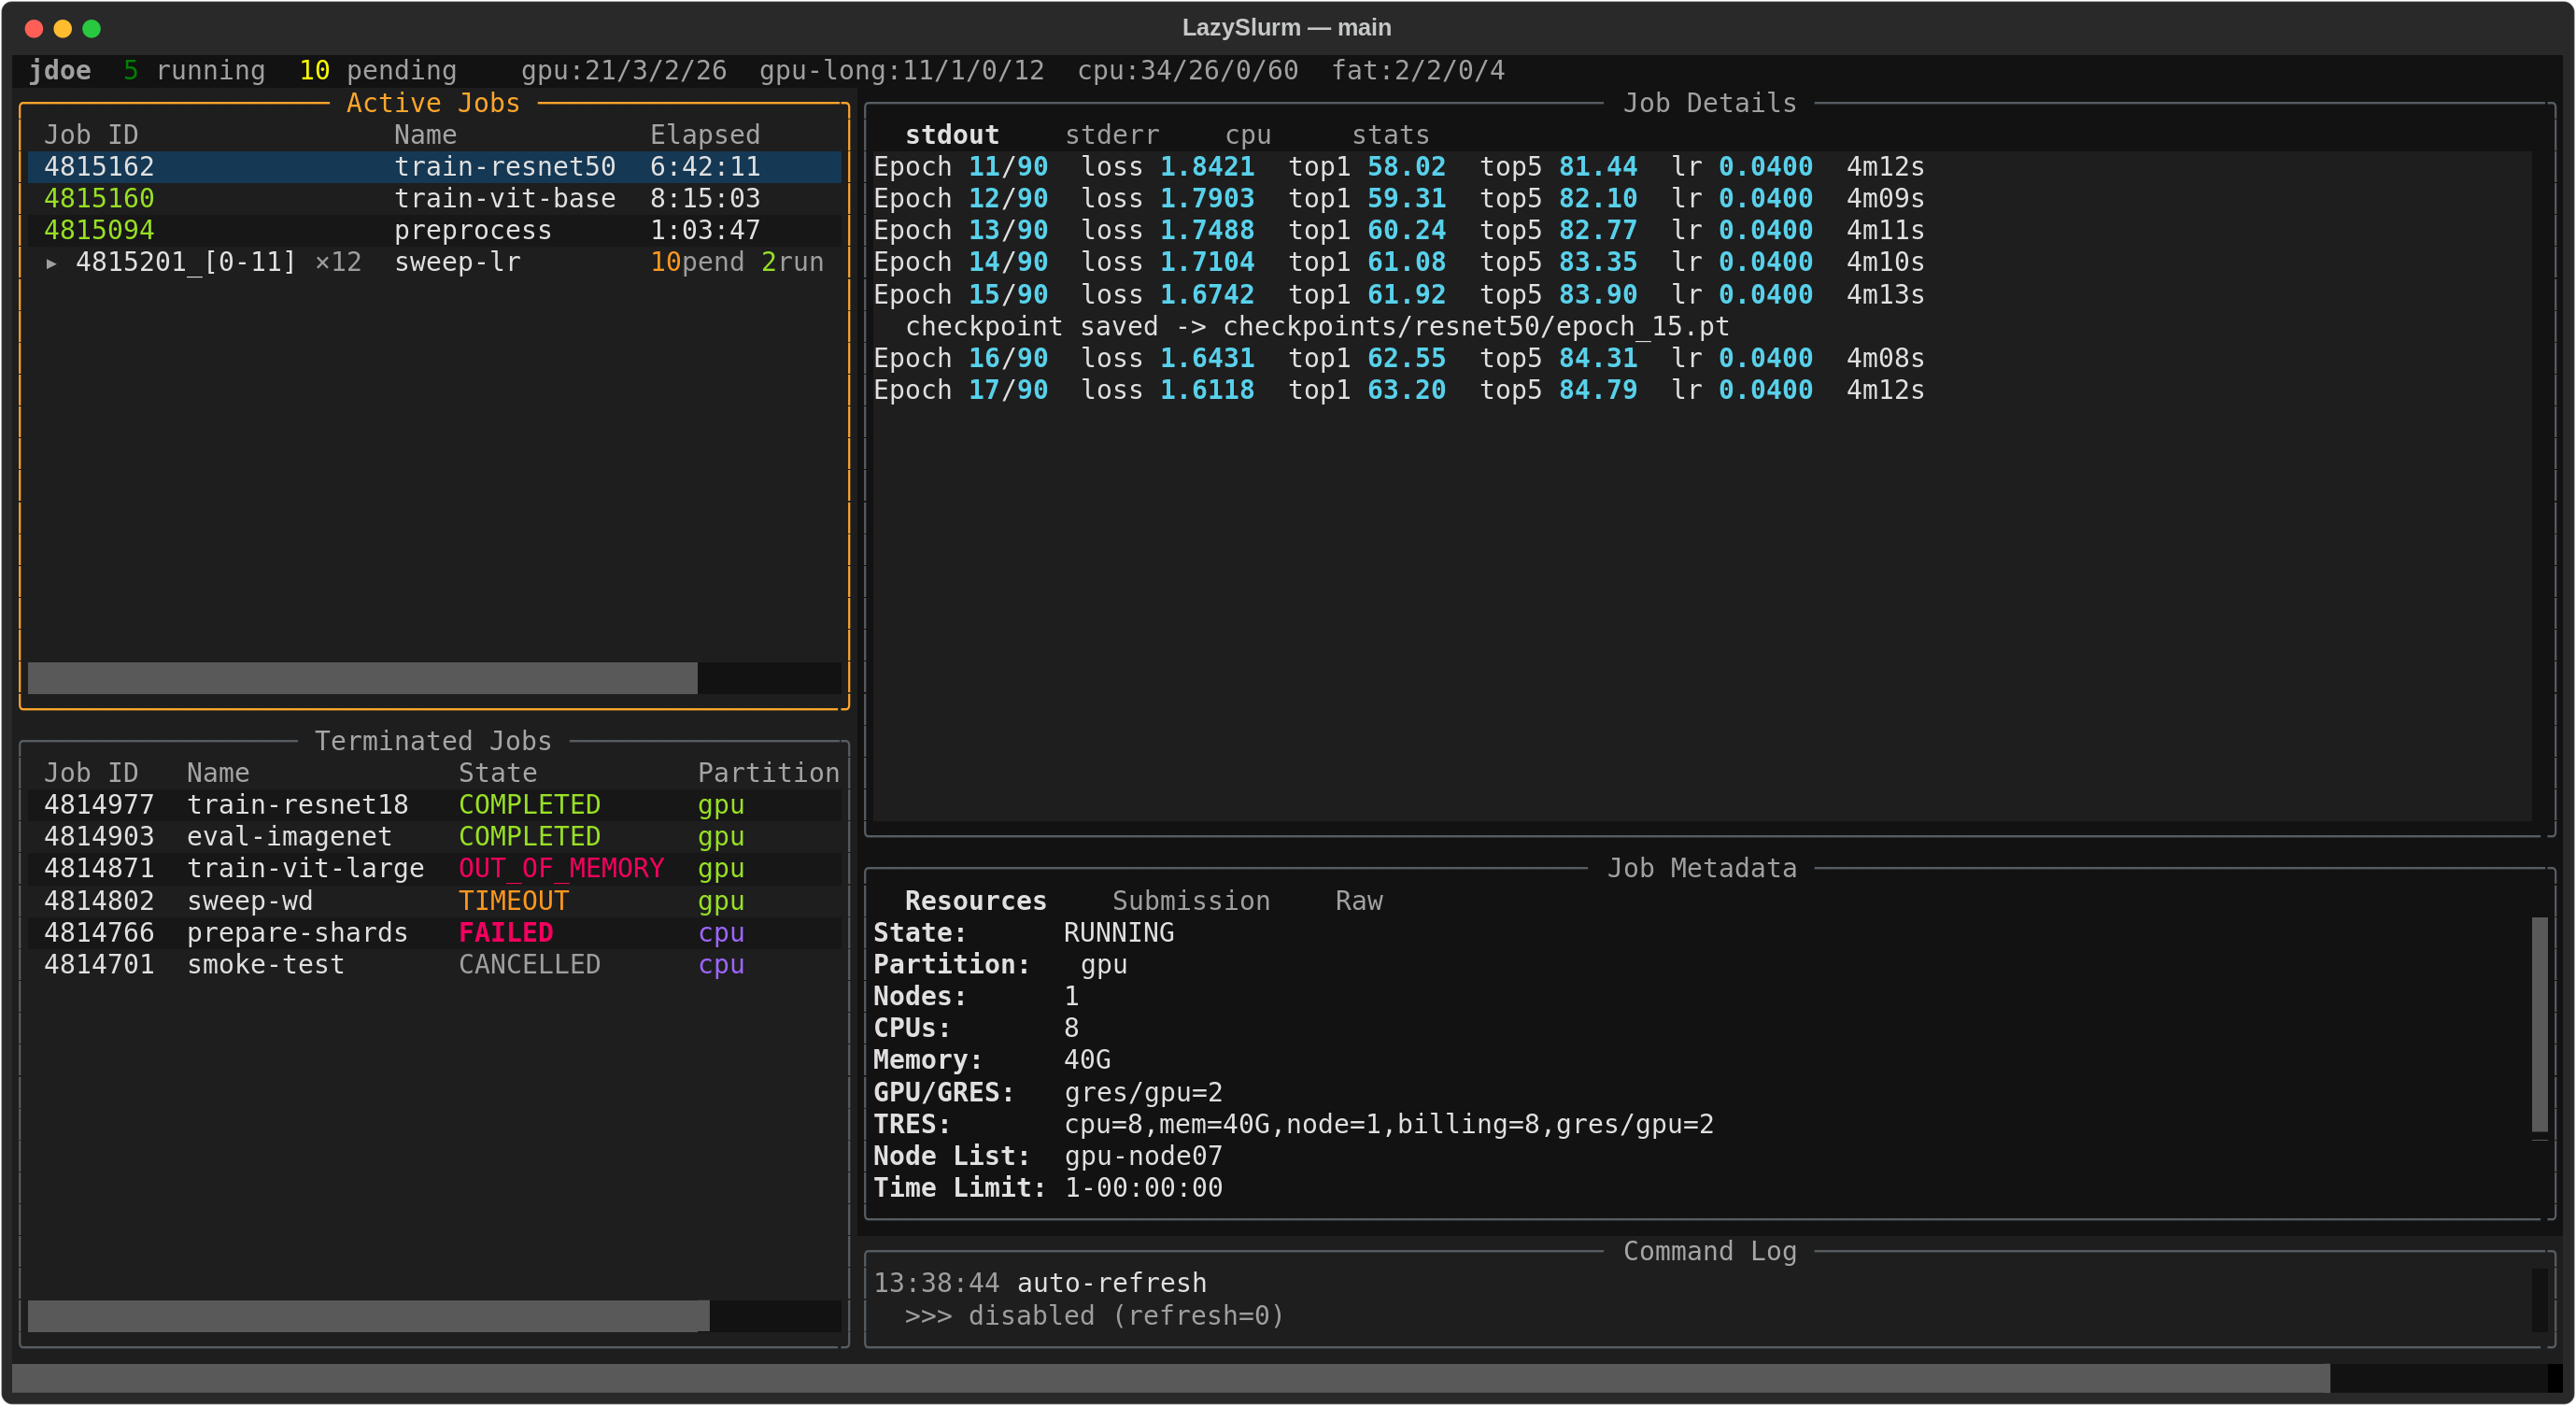
LazySlurm has a five-panel main view:
| Panel | Position | Content |
|---|---|---|
| Active Jobs | Top-left | Running and pending jobs from squeue |
| Terminated Jobs | Bottom-left | Completed, failed, timed-out, and cancelled jobs from sacct |
| Job Details | Top-right (2/3) | Tabbed view: stdout, stderr, live CPU, live GPU, resource stats |
| Job Metadata | Middle-right | Tabbed view: Resources, Submission info, Raw scontrol output |
| Command Log | Bottom-right | Timestamped log of actions and responses |
A cluster overview bar at the top shows your running/pending counts and partition
availability. Press p for the separate full-screen partition monitor,
and / to reveal the search bar above the job tables.
Key Bindings
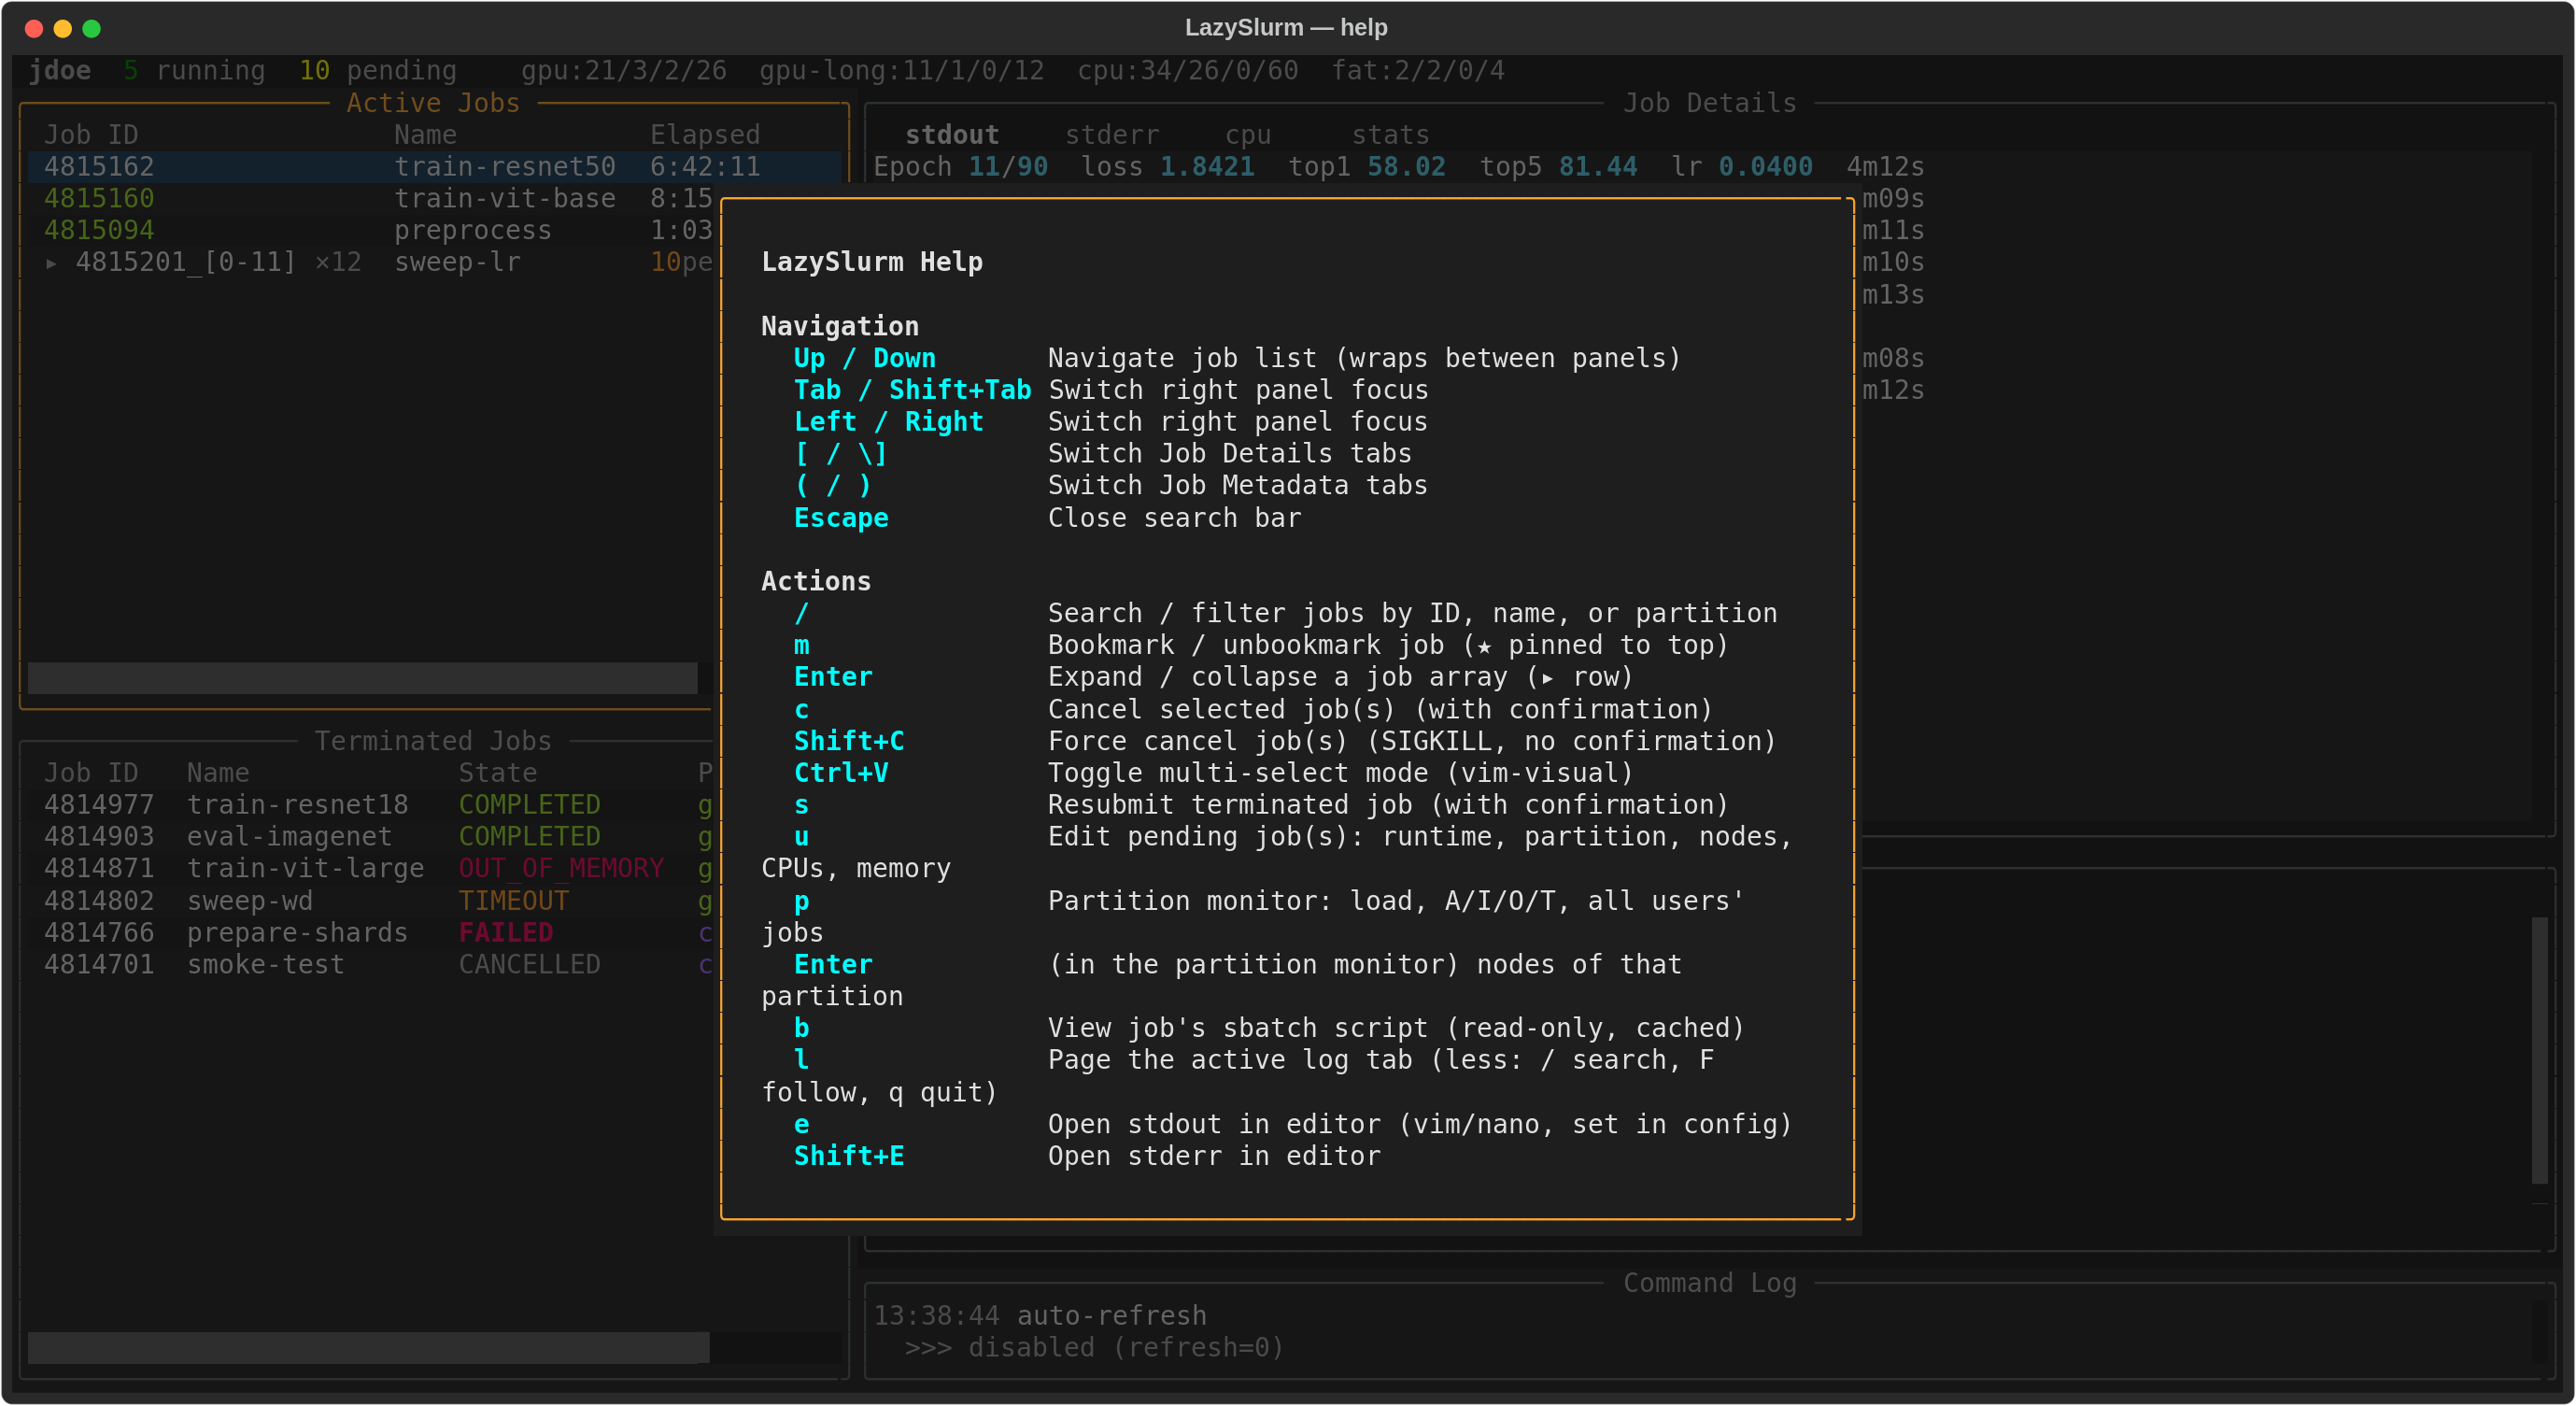
Press ? at any time for this list inside the app:
Navigation
Moving between panels, tabs and rows
| Key | Action |
|---|---|
Up / Down |
Navigate job list (wraps between Active and Terminated). The selected job's details update immediately. |
Tab / Shift+Tab |
Cycle focus: job tables → Job Details → Job Metadata → job tables |
Left / Right |
The same cycle, in the other direction |
[ / ] |
Switch tabs in the Job Details panel (stdout, stderr, cpu, gpu, stats) |
( / ) |
Switch tabs in the Job Metadata panel (Resources, Submission, Raw) |
Enter |
In the filter bar: accept the filter and move the cursor onto the matches (the filter stays in force) |
Escape |
In the filter bar: abandon the filter and close the bar |
Actions
Every key that does something to a job
| Key | Action |
|---|---|
/ |
Open the filter bar — plain text or state:/part:/name:/id:/gpu: terms. Enter accepts, Escape abandons |
Enter |
Expand / collapse a job array row |
m |
Bookmark / unbookmark the selected job. Bookmarked jobs show a ★ prefix and are pinned to the top of their table |
c |
Cancel the selected job (with confirmation prompt) |
Shift+C |
Force cancel — sends SIGKILL immediately, no confirmation |
Ctrl+V |
Toggle multi-select mode (vim-visual style). Use Up/Down to extend the selection range from an anchor row, then press c or Shift+C to cancel all selected jobs. Press Ctrl+V again to exit. Detail panels freeze on the last single-selected job. |
s |
Resubmit a terminated job using its original sbatch script (with confirmation) |
Shift+S |
Resubmit with different resources — opens the editor prefilled from the job, suggesting 2x after a TIMEOUT or OOM |
u |
Edit a pending job's properties: runtime, partition, nodes, CPUs, memory. Works on a multi-selection too |
Shift+U |
Open the account usage panel — CPU-hours and your fairshare |
p |
Open the partition monitor — per-partition load and every user's jobs. Escape or p returns |
b |
View the job's sbatch script, read-only, in your editor |
l |
Open the active log tab (stdout or stderr) in a pager — the way to read a huge log |
e |
Open the job's stdout log in an external editor (suspends TUI) |
Shift+E |
Open the job's stderr log in an external editor |
o |
Open a shell on the selected job's compute node. Suspends the TUI; type exit to return. The mechanism is configurable — SSH by default |
Shift+O |
The same, using the other access method (ssh ↔ srun) for this one shell |
, |
Edit config file (~/.config/lazyslurm/config.toml) in your editor |
r |
Force refresh all job data |
? |
Help for the panel you are in — job tables, Job Details, Job Metadata, partition monitor, node view or account usage. Other panels are listed at the bottom (also closes with Escape) |
q |
Quit |
Detail Tabs
Select a job in either table (Up/Down) and use [ / ] to switch between these tabs:
stdout / stderr
How the log files are found, including for old jobs
Displays the tail of the job's standard output and error log files. LazySlurm finds log
files by reading StdOut / StdErr from scontrol show job. For older jobs no longer
in Slurm's memory, it checks the log path cache first (see
Log Path Cache), then falls back to searching the working directory
for common patterns (slurm-JOBID.out, JOBNAME-JOBID.out, logs/ subdirectory, etc).
cpu
Live process listing from the job's node
Live process listing from the job's compute node, similar to top. Shows PID, %CPU,
%MEM, RSS, VSZ, elapsed time, and command name. Auto-refreshes while the tab is active.
gpu
nvidia-smi for the job's own GPUs only
Live nvidia-smi output showing only the GPUs allocated to the selected job. Uses
srun --overlap --jobid to run nvidia-smi inside the job's cgroup, so GPU visibility
is automatically restricted to the job's allocation. The header shows
CUDA_VISIBLE_DEVICES for confirmation. Auto-refreshes while the tab is active.
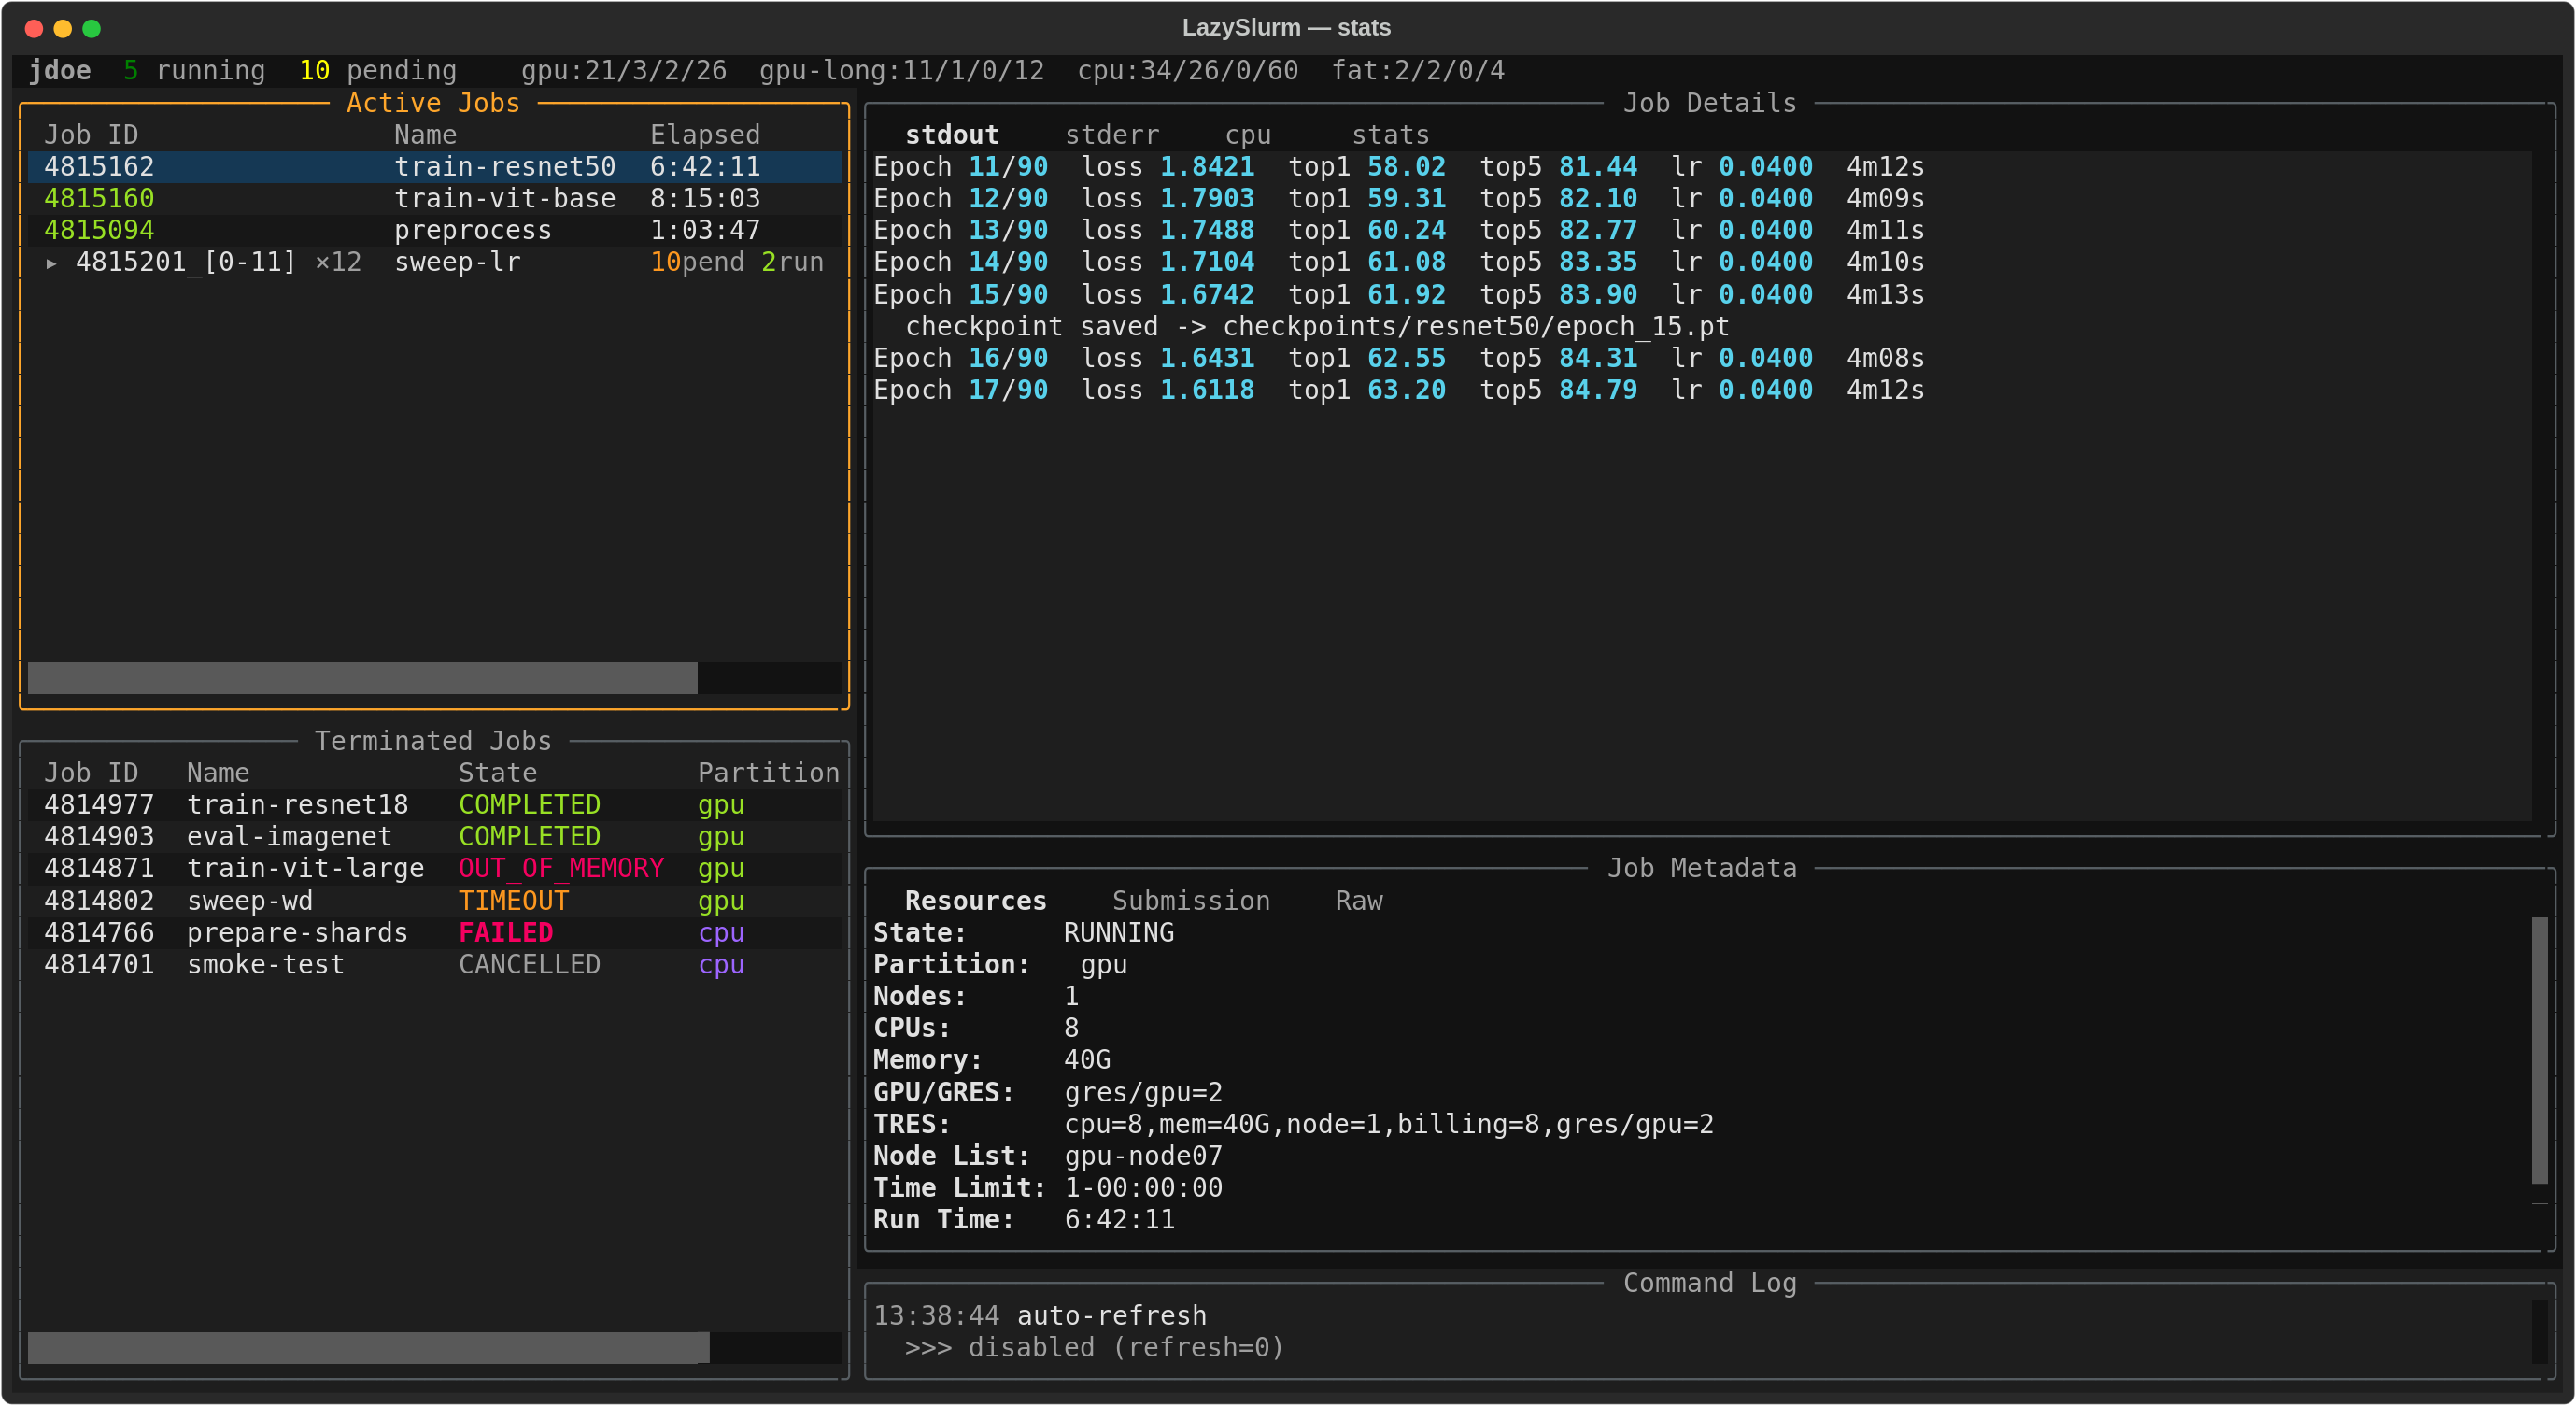
stats
Efficiency, sizing hints and the resource sparklines
Accounting statistics from sstat (running jobs) and sacct, starting with what the job
used against what it reserved:
Efficiency
  CPU            <0.1 / 8 cores    <1% ▁▁▁▁▁▁▁▁  ← over-requested
  Memory         2.6G / 64G         4% ▁▁▁▁▁▁▁▁  ← over-requested
  GPU               1 / 1 allocated      — utilisation is not recorded by Slurm
  Walltime      17:02 / 12:00:00    2% ▁▁▁▁▁▁▁▁
  next time try --mem=4G --cpus-per-task=1 --time=00:25:00
- CPU is
TotalCPU / (cores × elapsed), the same definitionseffuses - Memory compares the peak RSS of one task against the request per node, so a multi-node job is not credited with memory it never touched on any single node. At 100% or above the row turns red — the next run risks being killed for exceeding its request
- Walltime is
elapsed / time limit - Green above 60%, yellow 25-60%, red below. A fraction of a percent shows as
<1%rather than rounding up to 1% - The last line suggests a request about a third larger than what was actually used, and only appears when something was clearly over-provisioned
- Array tasks are measured per task; a job too old for
sacctreadsunavailable
Then the raw accounting fields:
- CPU — average CPU time, total CPU, frequency, wall time
- Memory — requested, max/average RSS, max/average VM size, peak node/task
- GPU — allocated GPU count and type from TRES
- Disk I/O — average and max read/write
Metadata Tabs
Use ( / ) to switch between these tabs:
Resources
What the job asked for and what it got
Partition, node count, CPUs, memory, GPU/GRES allocation, TRES, time limit, runtime, account, and QoS.
Submission
Working directory, script and submit line
Submit time, start/end times, working directory, stdout/stderr paths, and the original submit command.
Raw
The unparsed scontrol output
All key-value pairs from scontrol show job or sacct, displayed verbatim.
Features
One heading per feature — open the ones you want.
Column Width Limits
Keep long job names from eating the table
Job names and partition names are truncated to 16 characters by default (with … when
truncated). This keeps the tables compact. Configure via config.toml:
max_name_width = 20       # wider name column
max_partition_width = 10  # narrower partition column
Set to 0 for unlimited width.
State Abbreviations
COMPLETED -> COMP, and the full mapping
For compact displays, enable abbreviated state names in the Terminated Jobs table:
abbreviate_states = true
| Full State | Abbreviation |
|---|---|
| COMPLETED | COMP |
| FAILED | FAIL |
| TIMEOUT | TIME |
| CANCELLED | CAN |
| OUT_OF_MEMORY | OOM |
| NODE_FAIL | NFAIL |
| PREEMPTED | PREEMPT |
Color-Coded Partitions
Automatic colors, and how to override them
Each partition is assigned a consistent color across both job tables. Colors are deterministic (based on the partition name) so they stay stable across sessions. You can override colors in the config file (see Configuration).
Color-Coded Job States
What each color means, in both tables
Active Jobs (Job ID column):
| State | Color |
|---|---|
| RUNNING | Green |
| PENDING | Yellow |
| COMPLETING | Orange |
| SUSPENDED, REQUEUED | Dim |
Terminated Jobs (State column):
| State | Color |
|---|---|
| COMPLETED | Green |
| FAILED, OUT_OF_MEMORY, NODE_FAIL | Red |
| TIMEOUT | Yellow |
| CANCELLED | Dim grey |
| PREEMPTED | Dim yellow |
Cluster Overview Bar
The one-line summary at the top
The top line shows a summary of your jobs and cluster partitions:
jdoe 5 running 2 pending gpu:10/5/1/16 cpu:42/58/0/100
Partition format is name:A/I/O/T:
| Field | Meaning |
|---|---|
| A | Allocated — nodes currently running jobs |
| I | Idle — nodes available for new jobs |
| O | Other — nodes that are down, drained, or in maintenance |
| T | Total — total nodes in the partition |
Filtering
Filter syntax: fields, comparisons and aliases
/ opens the filter bar. Plain words search the job id, name and partition (and state,
in the Terminated table) as before, and key:value terms narrow by field. Terms are
ANDed.
Enter accepts the filter: the bar closes, the query stays in force, and the cursor
lands back on the matching rows so you can cancel, edit or inspect them. Escape
abandons it, clearing the query and showing every job again. While a filter is active
the table's border title says so — Active Jobs — 2/4 match.
state:pend part:gpu        pending jobs on the gpu partition
train state:run            running jobs whose row mentions "train"
gpu:>0                     jobs that asked for at least one GPU
name:sweep id:4815         both must match
| Term | Matches | Aliases |
|---|---|---|
state:pend |
job state, prefix match, case-insensitive (fail finds FAILED, out finds OUT_OF_MEMORY) |
st:, s: |
part:gpu |
partition, substring | partition:, p: |
name:train |
job name, substring | n: |
id:4815 |
job id, substring | job: |
gpu:>0 |
GPUs requested; >, >=, <, <=, =, != |
gpus:, gres: |
Quote values containing spaces: name:"my long job". An unknown key is treated as plain
text — foo:bar just searches for the string foo:bar, so nothing you type can break the
filter. The panel border shows how much matched (Active Jobs — 2/4 match), and a filter
that matches nothing says no jobs match instead of showing an empty table.
gpu: only applies to the Active table: sacct rows carry no GRES, so the term matches
nothing among terminated jobs.
Job Arrays
A 40-task array as one expandable row
A 40-task array would otherwise fill the table with 40 near-identical rows, so tasks of one array are folded into a single row:
▸ 4815201_[0-11] ×12 sweep-lr 2run 10pend gpu
The Job ID cell shows the task-index range and the total task count; ×12 counts tasks,
not rows, so a pending 4815201_[3-11] block counts as the nine tasks it stands for. The
Elapsed column carries a state tally instead of a time, which means little across a dozen
tasks that started at different moments. In the Terminated table the tally sits in the
State column and Elapsed shows the longest run of the array.
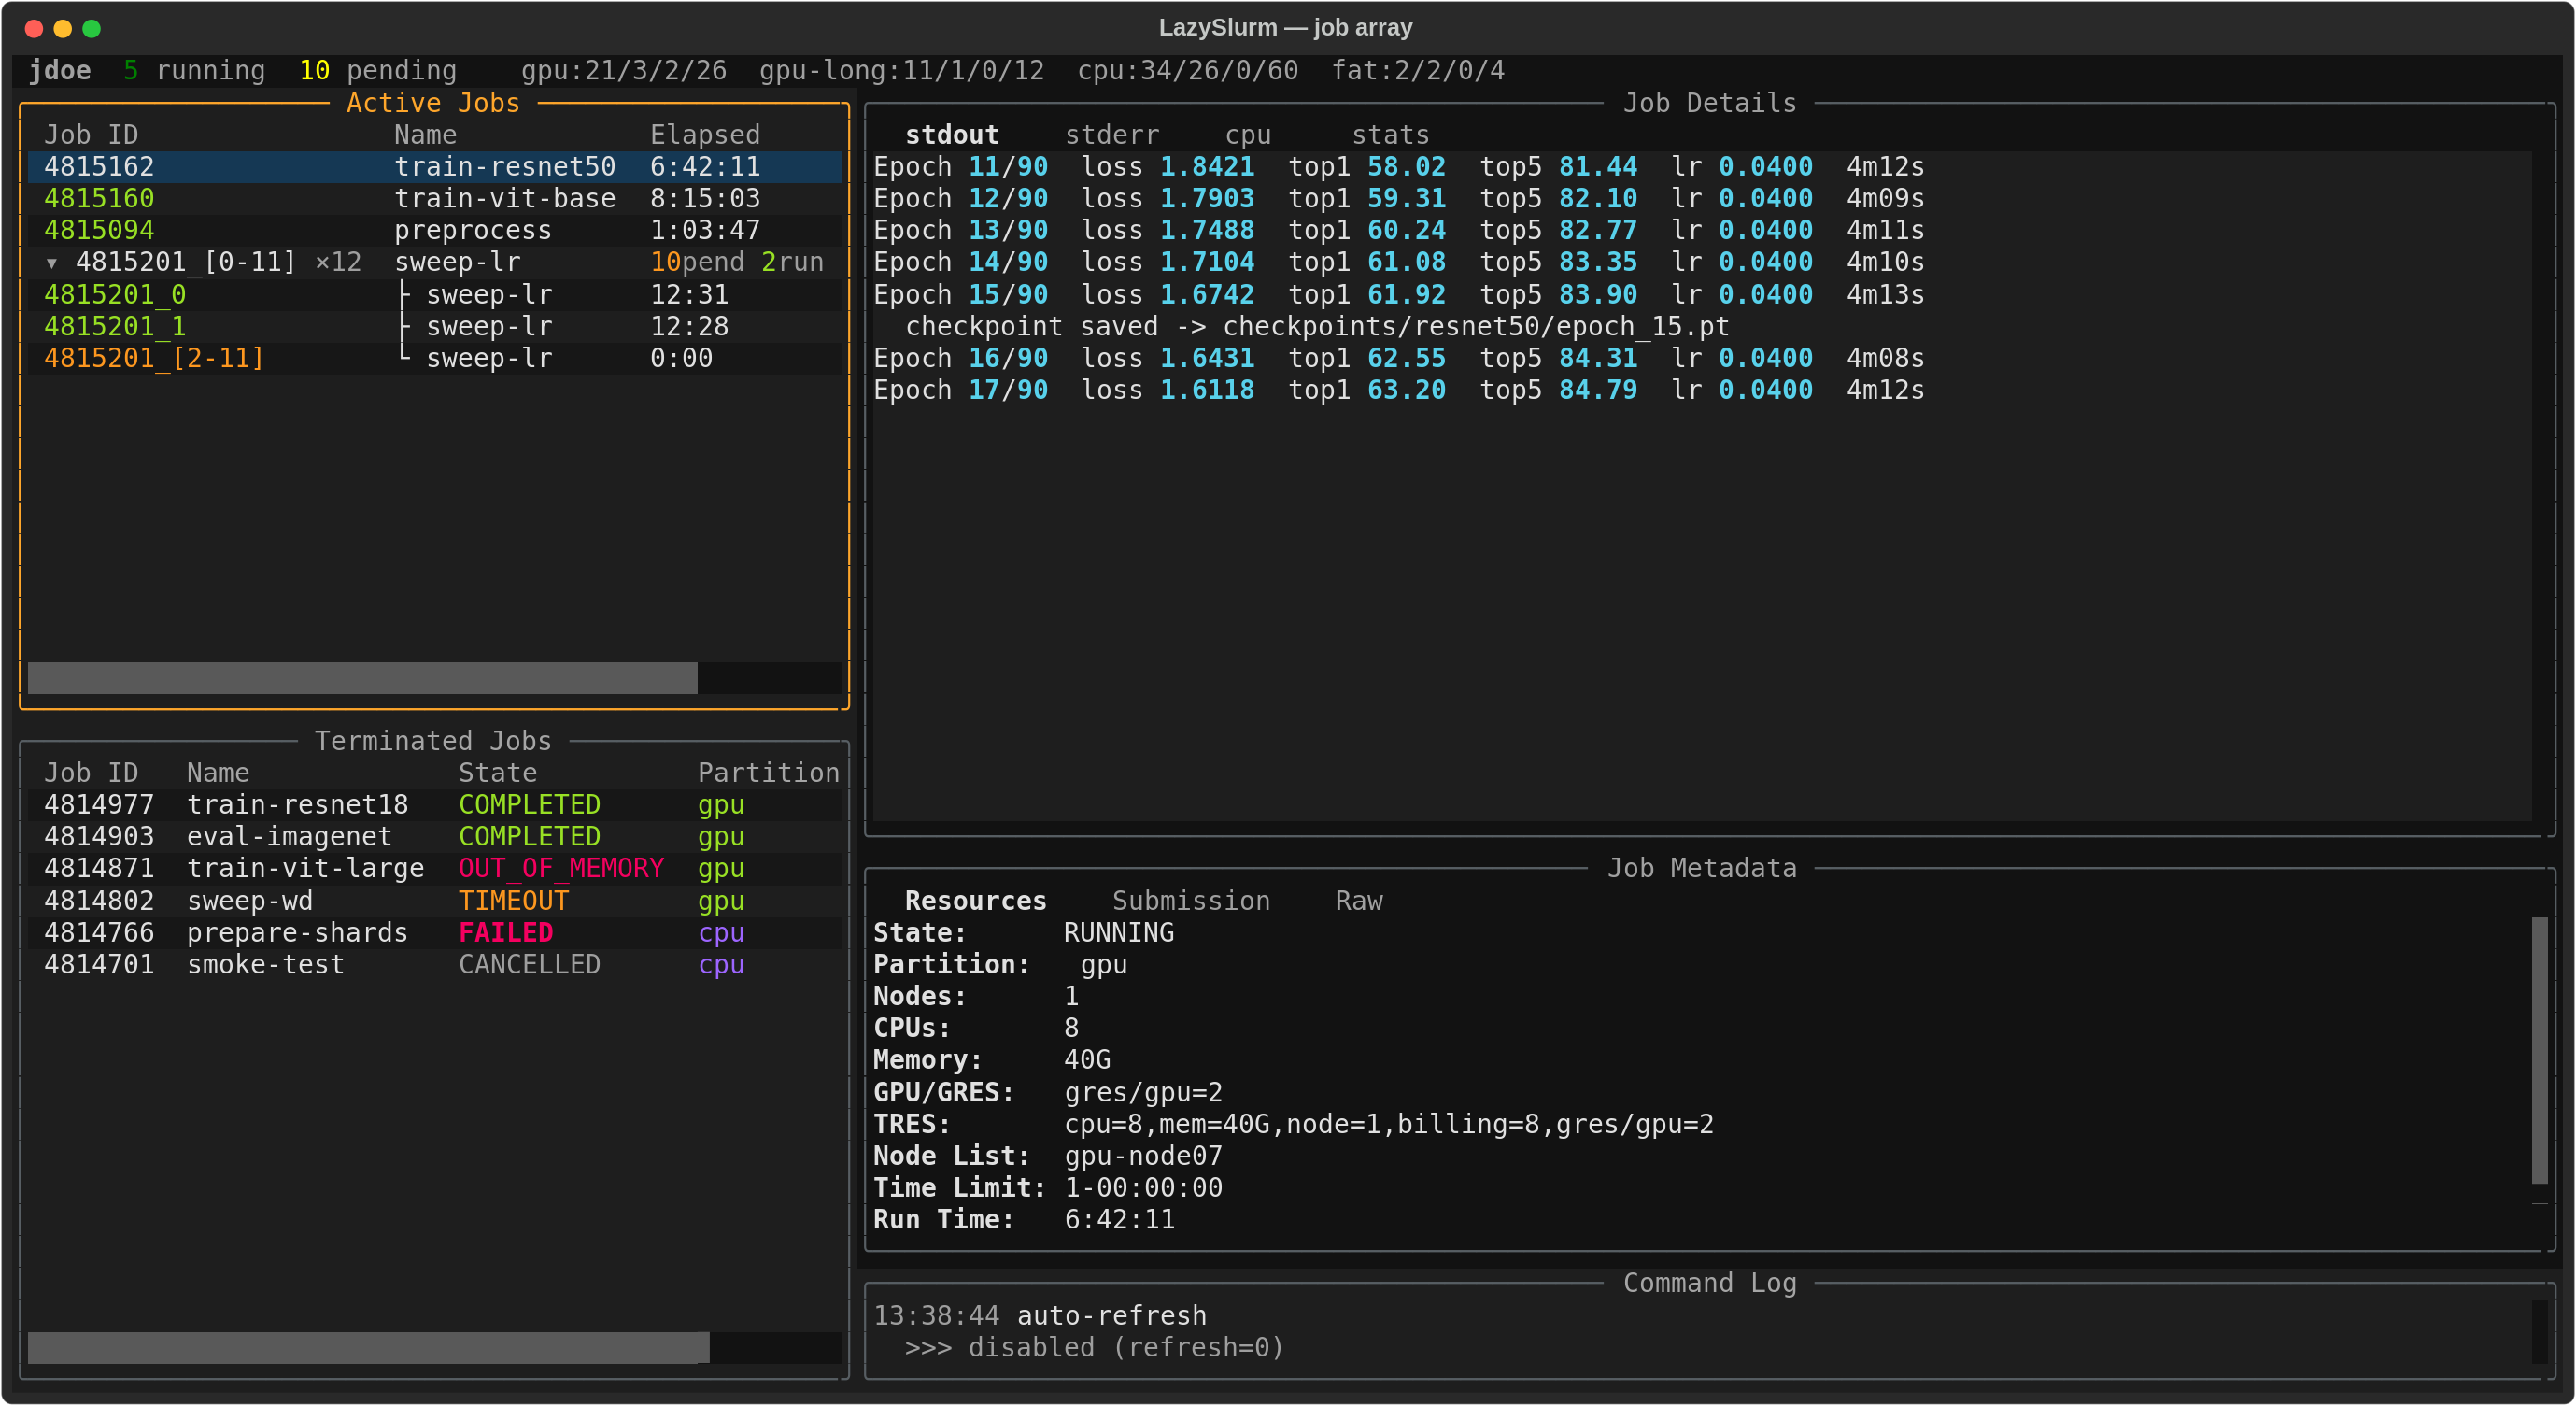
Enter expands the row into its tasks (├/└ prefixed) and collapses it again.
Expansion survives refreshes and filter changes, so a group you opened stays open.
Actions on a collapsed row act on the whole array: c cancels it with a single
scancel <base id>, u edits every pending task in it, m bookmarks the group so it
pins to the top as a unit. On an expanded task, everything behaves per task as usual.
The detail panels always show a real task (the first one) — Slurm cannot describe a bare
base id.
Turn it off with collapse_arrays = false in config.toml to get one row per task again.
Bookmarks
Pin the jobs you keep coming back to
Press m to bookmark any job. Bookmarked jobs are pinned to the top of their table with
a ★ prefix. Bookmarks persist for the duration of the session.
Account Usage
CPU-hours per user and your fair-share factor
Press Shift+U for what the allocation has cost so far and what it is doing to your
priority:
this month   8 200 CPU-hours used by you   account total 12 500  66% of it yours   (w cycles window)
+------------------------------- Fair share -------------------------------+
| physics  factor 0.437  entitled 1.68%  used 5.64%                        |
|   over your share — your jobs get reduced priority (using 3.3x your share)|
+------------------------------ Account usage -----------------------------+
| User      Name        CPU hours  Share              %                    |
| ▸ jdoe    Jane Doe        8 200  ████████████░░░░  66.1%                 |
|   asmith  A Smith        3 100   ████░░░░░░░░░░░░  25.0%                 |
|   bpatel  B Patel        1 200   ██░░░░░░░░░░░░░░   9.7%                 |
+--------------------------------------------------------------------------+
- Hours come from
sreport cluster AccountUtilizationByUser, per user in your account, biggest consumer first, your own row marked▸. - Fair share comes from
sshare— this is what actually drives queue priority.entitledis your slice of the cluster,usedis the slice you have consumed, and the factor is Slurm's verdict: above 0.5 you are under-consuming and get boosted, below it you are over-consuming and get pushed back. The sentence underneath says which. wcycles the window: this month → last 30 days → this year.rrefetches,Escape/Shift+U/qreturns.
sreport can take seconds on a busy accounting database, so the screen opens immediately
with loading usage... and fills in when the data arrives. Nothing here runs in the poll
loop — it is fetched on open, on r, and when the window changes. On a cluster without
Slurm accounting the panel says so rather than showing an empty table.
Partition Monitor
Cluster-wide load and every user's jobs
Press p for a full-screen view of the cluster's partitions. The main job tables only
ever show your jobs — this screen shows everyone's, so you can see what a partition is
actually busy with before you queue into it.
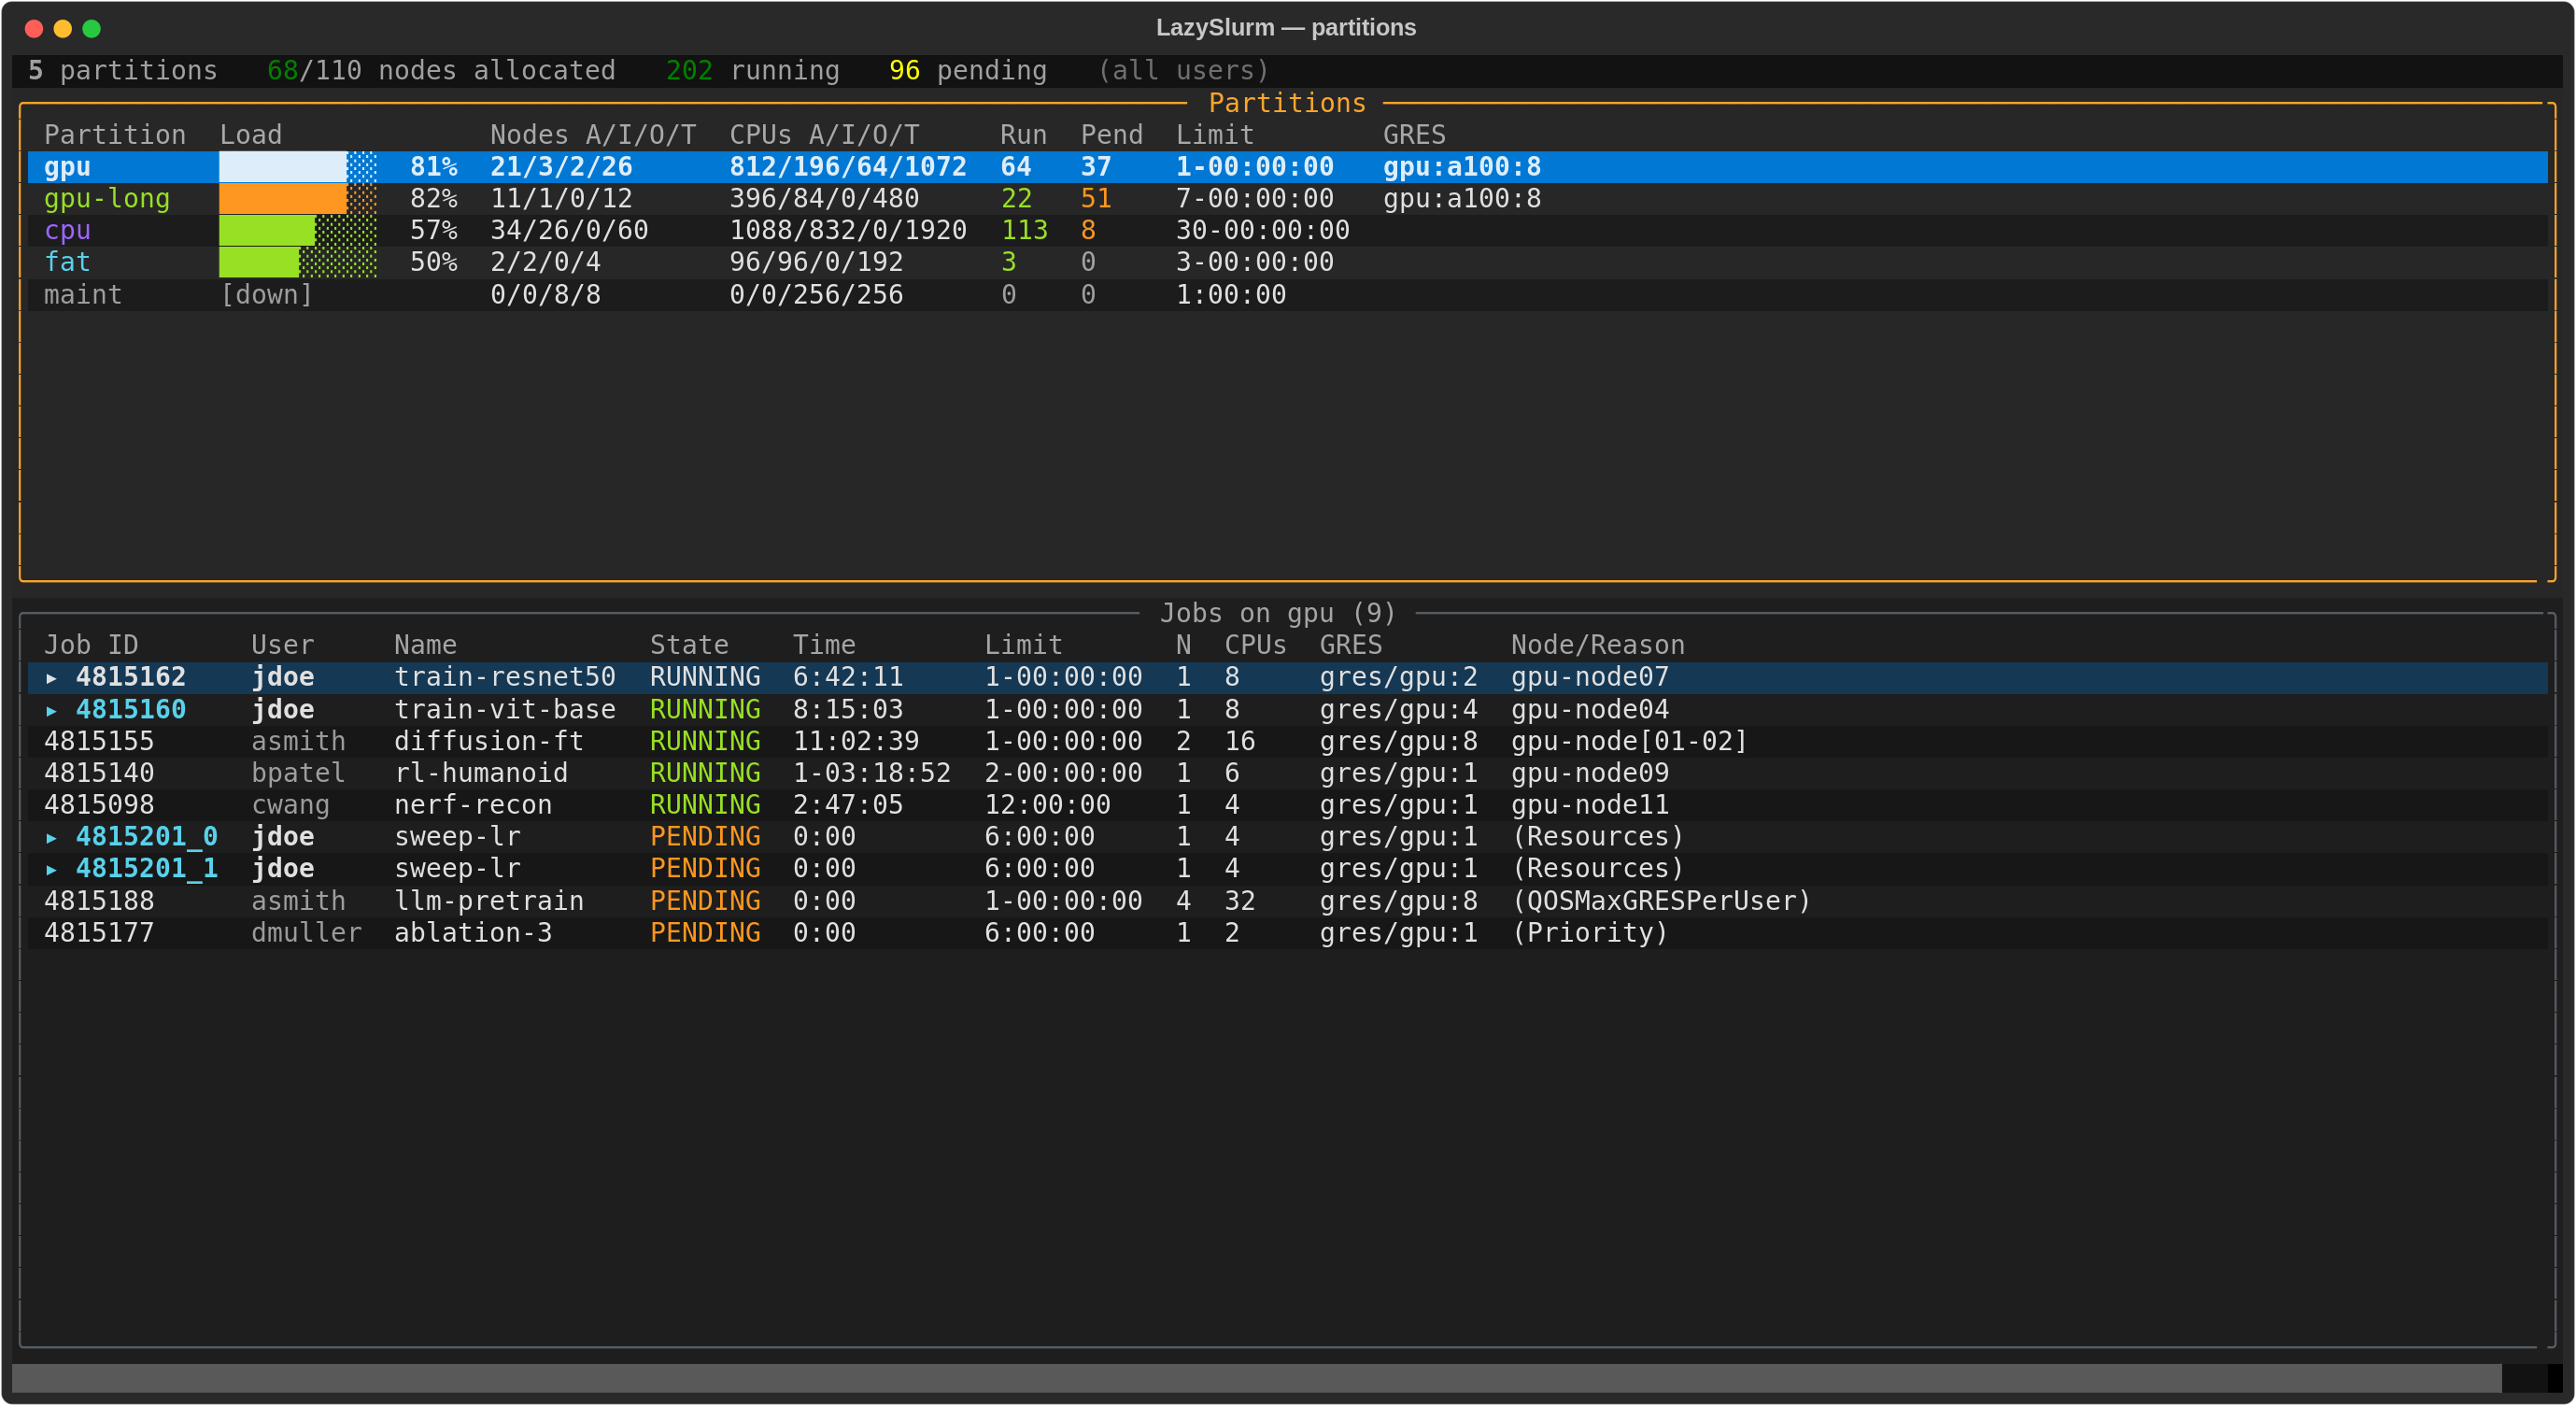
Partition table — A/I/O/T is Slurm's allocated / idle / other / total counter, given
for both nodes and CPUs. "Other" is down, drained, or reserved capacity. The Load bar
is allocated CPUs over usable CPUs (allocated + idle), so drained nodes don't make a
saturated partition look half empty; it turns yellow past 60% and red past 90%. Run and
Pend are job counts across all users, and a pending job that names several partitions
counts in each. Partitions that are down are shown struck-through instead of with a bar,
rather than hidden.
Job table — every user's jobs on the highlighted partition, running first then pending,
newest first. Your own jobs are marked ▸ and highlighted. For pending jobs the last
column shows Slurm's reason ((Resources), (QOSMaxGRESPerUser), (Dependency), …)
instead of a node list.
| Key | Action |
|---|---|
Enter |
Open the node view for the highlighted partition |
Up/Down |
Move between partitions; the job table follows the highlighted one |
Tab |
Switch focus between the partition and job tables (to scroll a long job list) |
r |
Refresh now |
Escape / p / q |
Back to the main view |
The screen re-polls on your --refresh interval while it is open, and stops when you
leave. --partition-order also orders this table. Note that sinfo --summarize reports
one row per node configuration, so partitions with mixed hardware are summed into a
single row here.
Node View
Per-node state, load, memory and GPU occupancy
Press Enter on a partition to see its individual nodes:
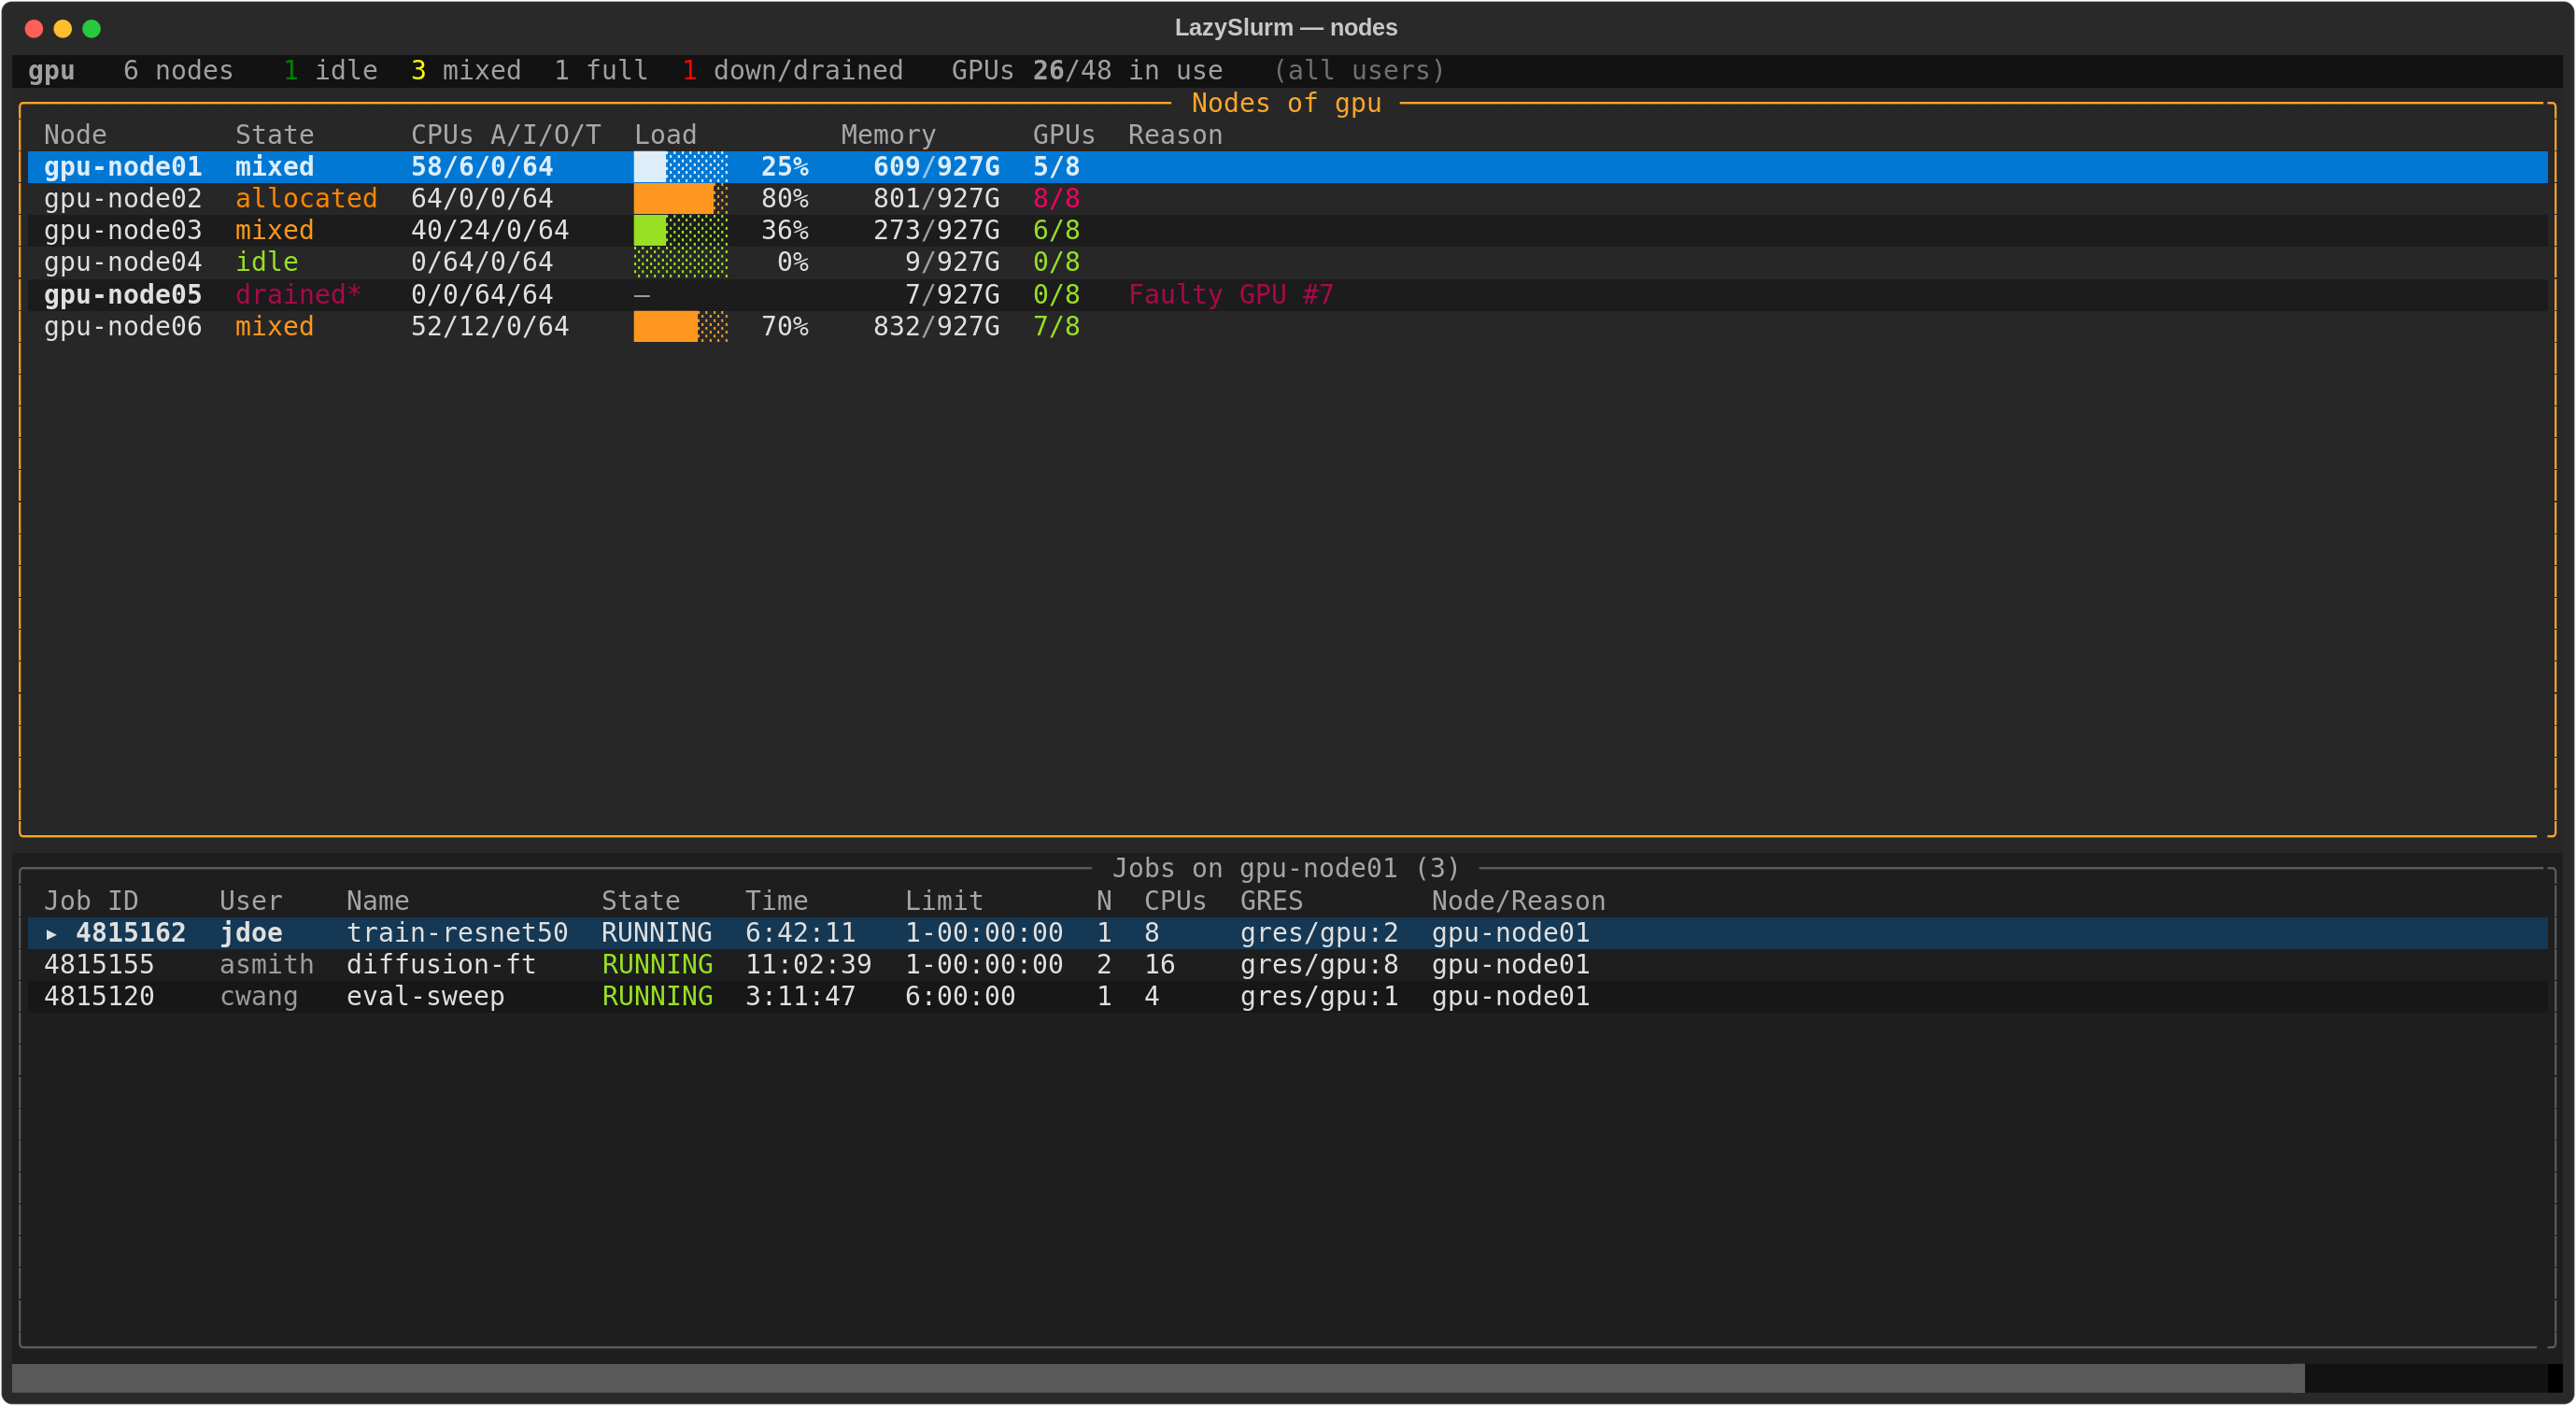
| Column | Meaning |
|---|---|
| State | Slurm's node state — idle, mixed, allocated, drained, down, … A trailing * means the node is not responding, and the node name is bolded |
| CPUs A/I/O/T | allocated / idle / other / total cores on that node |
| Load | the node's load average over its core count — this is actual CPU usage, unlike the allocation counters next to it |
| Memory | in use (configured minus free) over configured, red past 90% |
| GPUs | GRES in use over GRES configured, from GresUsed; green while any are free, red when the node is full |
| Reason | why Slurm drained or downed the node (kernel patch, Faulty GPU #7, …) |
Nodes without GRES show — in the GPU column, and a drained node's load is shown as —
because its counters say nothing useful — the reason does.
The bar at the top counts the partition's nodes by state and totals GPUs in use.
The lower panel lists all users' jobs running on the highlighted node, so you can see
who you would be sharing it with. Up/Down moves between nodes and the job list follows,
Tab switches panels, r refreshes, Escape or q goes back to the partition list.
Older Slurm versions that do not support the GresUsed output field fall back
automatically to a shorter query; everything except the GPU column still works.
Edit Pending Jobs
Retune runtime, partition and resources before a job starts
Press u on a pending job to open the property editor:
| Field | scontrol key |
Notes |
|---|---|---|
| Runtime | TimeLimit |
Slurm time formats: 4:00:00, 2-00:00:00, 30 (minutes) |
| Partition | Partition |
Comma-separated list is allowed, e.g. gpu,gpu-long |
| Nodes | NumNodes |
|
| CPUs | NumCPUs |
|
| Memory/node | MinMemoryNode |
Accepts 40G, 4000M, or plain MB — converted to the MB integer Slurm expects |
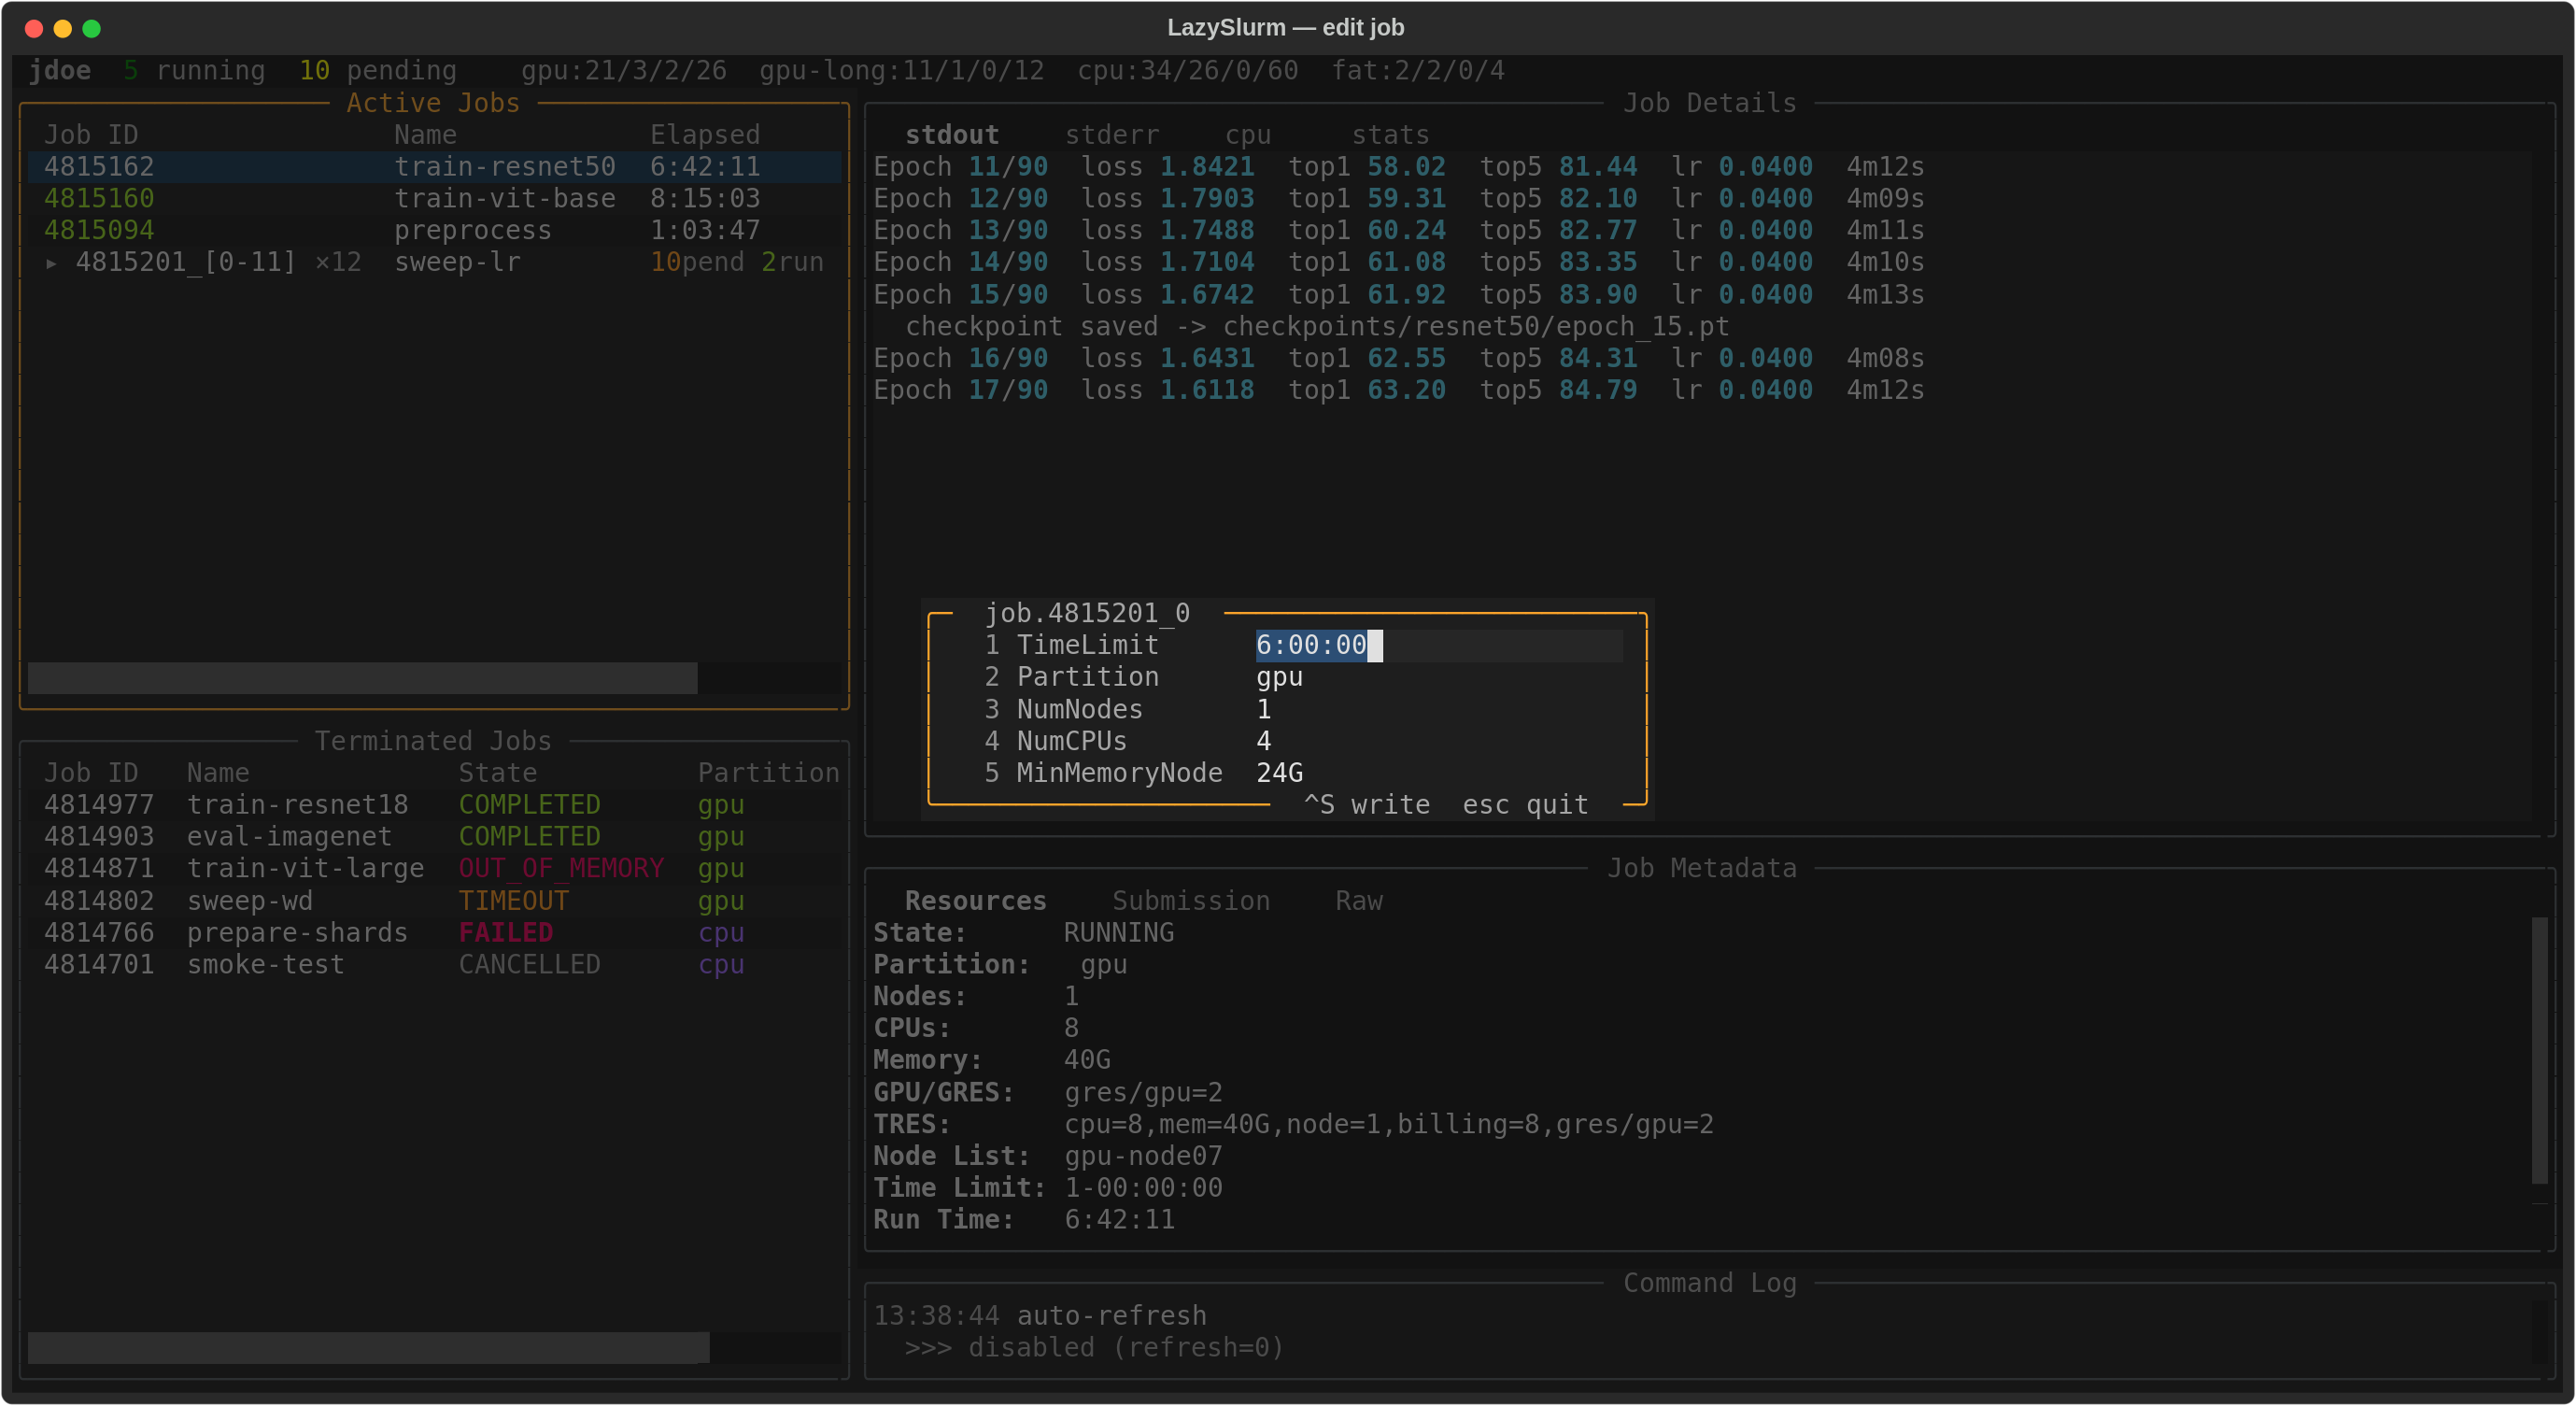
The modal reads like a small file you edit: numbered lines, the scontrol key as the
label, the job id as the "filename" in the border. The values are prefilled from the job.
Up/Down and Tab/Shift+Tab move between lines (wrapping at either end), Left/Right,
Home/End and Backspace edit within a line, Ctrl+S writes, Escape quits.
Only fields you actually changed are sent, as a single
scontrol update jobid=<id> Key=Value ... per job, and every command plus Slurm's reply is
written to the Command Log.
Pending jobs only. Once a job starts, Slurm fixes its runtime, partition, and resource allocation, so the editor refuses to open for running jobs and says so in the status line.
With a Ctrl+V multi-selection active, u edits all selected pending jobs at once. Then
the fields start blank and only the ones you fill in are applied to every job —
non-pending jobs in the selection are skipped and listed in the Command Log.
View sbatch Script
Read the script back, even after Slurm forgets it
Press b to open the selected job's sbatch script in your editor, read-only. Works on
pending, running, and terminated jobs. The TUI suspends while the editor is open.
With vim the file opens via -R, so you can still :w /some/other/path to keep a copy
— useful when the original script has been changed since the job was submitted. Editors
without a known read-only flag open writable, and the Command Log says so.
The script text is archived, not just its path, so your copy stays readable even if you
later edit, move, or delete the original file. Archiving happens automatically whenever you
select a job that Slurm still knows about, and on demand when you press b. Array tasks
share one script: 123_11, 123_[1-40], and 123 all resolve to the same file.
Slurm only keeps a job's script until MinJobAge seconds after it ends — often just
300. A job that finished before LazySlurm ever saw it has no archived copy and Slurm can no
longer produce one; pressing b reports that the script is unavailable. See
Job Cache for the cache location and script_cache_dir.
Reading Big Logs
Open a multi-gigabyte log instantly, and search it
The stdout/stderr tabs show the last 500 lines, read by seeking backwards from the end of the file — a 200 MB log tails as fast as an empty one, and the panel never blocks the UI while a job floods its log.
To read more than the tail, press l to open the active tab's log in a pager (less by
default). This is the right tool for a multi-gigabyte log: it seeks instead of loading, so
it opens instantly at the end of the file, and inside it you get
In less |
|
|---|---|
/pattern, n / N |
search forwards and back |
G / g |
jump to end / start |
F |
follow the file as the job writes to it (like tail -f); Ctrl+C stops |
q |
back to LazySlurm |
The TUI suspends while the pager is open. In remote mode the pager runs on the cluster over the existing SSH connection, so nothing is copied to your machine and you are not asked for a 2FA code again.
Set your pager in config.toml:
pager = "less" # or "more", "bat", "most"
less is opened with -R +G (keep the log's colors, start at the end); other known pagers
get their equivalent end-of-file flag. An unknown pager is run with no flags.
If a log has no line break in its last 4 MB — a progress bar writing \r forever — the
tail is cut there and the panel says so; press l to see the file properly.
Open Logs in Editor
Your editor, local or remote
Press e to open the selected job's stdout log in an external text editor, or
Shift+E for stderr. The TUI suspends while the editor is open and resumes when you
close it.
The default editor is vim. To change it, set editor in your config file:
editor = "nano" # or "vim", "less", "code", etc.
In remote mode, the log file is first copied to a local temp file via scp, opened
in the editor, and cleaned up when the editor closes.
If the configured editor is not found on your system, an error is shown in the Command
Log (e.g., editor 'code' not found — set 'editor' in config.toml).
Interactive shell: ssh vs srun
Why nvidia-smi may show more GPUs than you allocated
Press o to get a shell on the compute node running the selected job. There are two
ways to do that, and they land you in genuinely different places:
interactive_shell = "ssh" # "ssh" (default) | "srun"
ssh — the machine. You get a normal login shell on the node, outside the job's
cgroup. CUDA_VISIBLE_DEVICES is unset, nvidia-smi shows every GPU on the node
rather than the one you allocated, and anything you start there is not capped by the
job's CPU or memory limits — so a heavy process competes with your job instead of being
contained by it. In exchange it adds no job step, so it cannot skew the
efficiency report, and it either connects or fails fast.
srun — the allocation. LazySlurm runs srun --overlap --jobid=<id> --pty bash, so
the shell lands inside the job's cgroup: correct CUDA_VISIBLE_DEVICES, correct
resource limits, the same environment the job sees. The costs are real, though: the
shell appears in sacct as a job step, and an idle debugging shell drags the job's
reported CPU efficiency down. It also needs Slurm ≥ 20.11 for --overlap, and can block
while negotiating the step launch.
So: use ssh to poke at the machine, srun to debug inside your allocation. If
nvidia-smi shows you more GPUs than you asked for, that is the ssh path working as
designed — switch to srun for that shell.
You do not have to choose once and live with it: o uses the configured method and
Shift+O uses the other one, for a single shell.
Two cases where you may have to use srun:
- Your cluster runs
pam_slurm_adm, which refuses SSH to a compute node without an allocation there. - You are reproducing something that depends on the job's environment or limits.
srun needs a live allocation, so it only applies to a running job. On anything
else LazySlurm falls back to ssh and says so in the Command Log. If the step launch
fails, it reports the exit status rather than silently connecting you somewhere else.
Job Completion Notifications
Bell, desktop notification, log line
When a running job finishes (completes, fails, times out, etc.), LazySlurm:
- Rings the terminal bell
- Attempts a desktop notification via
notify-send(Linux) - Logs the event in the Command Log panel
Command Log
What LazySlurm ran, and what came back
The bottom-right panel shows a timestamped log of all actions and their results:
14:23:05 refresh
  >>> complete
14:23:12 scancel 2465400
  >>> Job 2465400 cancelled.
14:23:30 ssh galvani-cn109
  >>> session to galvani-cn109 closed
14:24:01 job completed
  >>> 2465485 COMPLETED
Job Cache
Slurm forgets a job shortly after it ends — MinJobAge seconds, often just 300. Until
then, scontrol can tell you the job's exact StdOut/StdErr paths and hand you its
sbatch script; afterwards both are gone and only sacct remains, which knows neither.
LazySlurm caches both while a job is still live, so they survive the job.
Check your cluster's window with:
scontrol show config | grep MinJobAge
Batch scripts
Archived so an old job's script is still readable
Archived as text under the base job ID, so all tasks of an array share one file. See
View sbatch Script for the b keybinding and its limitations.
Log paths
Remembered, so logs outlive scontrol
Log paths are cached the same way, into log_cache.json, whenever you select a job that
Slurm still knows about. For older jobs LazySlurm falls back to guessing from filename
patterns (slurm-JOBID.out, JOBNAME-JOBID.out, logs/ subdirectories), which can fail
if you use custom --output/--error names.
Resubmit fallback
What happens when the original script is gone
Resubmit (s) runs the job's original sbatch command. If the script file it names no
longer exists, LazySlurm substitutes the archived copy and says so in the Command Log. Not
available in remote mode, where the archive is local but sbatch runs on the login node.
Resubmit with more resources
Run it again, but bigger
The loop after a failure is usually "run it again, but bigger" — more time after a
TIMEOUT, more memory after an OOM kill. u cannot help there: Slurm fixes a job's
allocation once it starts, so the property editor only works on jobs still queued.
Shift+S opens that same editor for a terminated job, prefilled with what the job
actually had, and submits with the changed fields as sbatch flags:
sbatch --chdir /work --time=4:00:00 --mem=16G job.sh
- Fields map to
--time,--partition,--nodes,--cpus-per-taskand--mem. - An override replaces the same option in the original submit line rather than being appended next to it, so the command log shows exactly what was requested.
- A field left blank keeps whatever the original line had. Options after the script name belong to the script and are never touched.
- After a TIMEOUT the runtime field is prefilled with double the old limit, and after OUT_OF_MEMORY the memory field with double the old request. They are suggestions — overwrite or clear them.
- The full
sbatchline is written to the Command Log before it runs.
The archived-script fallback applies here too.
Cache files
Where the cache lives and when it is pruned
| File | Purpose |
|---|---|
~/.config/lazyslurm/log_cache.json |
Cached StdOut/StdErr paths, work dir, and submit command per job ID |
~/.config/lazyslurm/scripts/<job_id>.sh |
Archived sbatch scripts, mode 600 (they often contain tokens and private paths) |
Both are pruned on startup using cache_max_age_days (default 30, 0 to never prune).
Set script_cache_dir in config.toml to archive scripts somewhere else.
Earlier versions shipped a
lazyslurm-daemonthat polled for log paths in the background. It has been removed — caching now happens inline. A leftover~/.config/lazyslurm/daemon.pidis inert and can be deleted.
Remote Mode
Run LazySlurm on your local machine while monitoring a remote cluster:
lazyslurm --remote user@login.hpc.edu
One connection, opened once
One SSH session for the whole run
LazySlurm opens a single SSH session in the background at startup and runs everything
through it. It does not spawn ssh per Slurm call:
- An SSH master connection is started on a pty and authenticated once.
- A shell channel (
/bin/sh -s) is opened over that master and kept alive for the whole session. - Each
squeue,sacct,scontrol,sstat,scancel,sbatch— and every log-file read — is written into that shell and its output read back. No new connection, no new process, no re-authentication.
Commands are serialized on the channel, so they queue rather than interleave. If the channel dies (network drop, remote logout), the next command reopens it automatically, and only re-authenticates if the master itself is gone. The session is closed when you quit.
Two-factor authentication
Answered once, at startup
Because the master owns a pty, whatever the cluster asks at login is captured and shown to you in a modal instead of being lost:
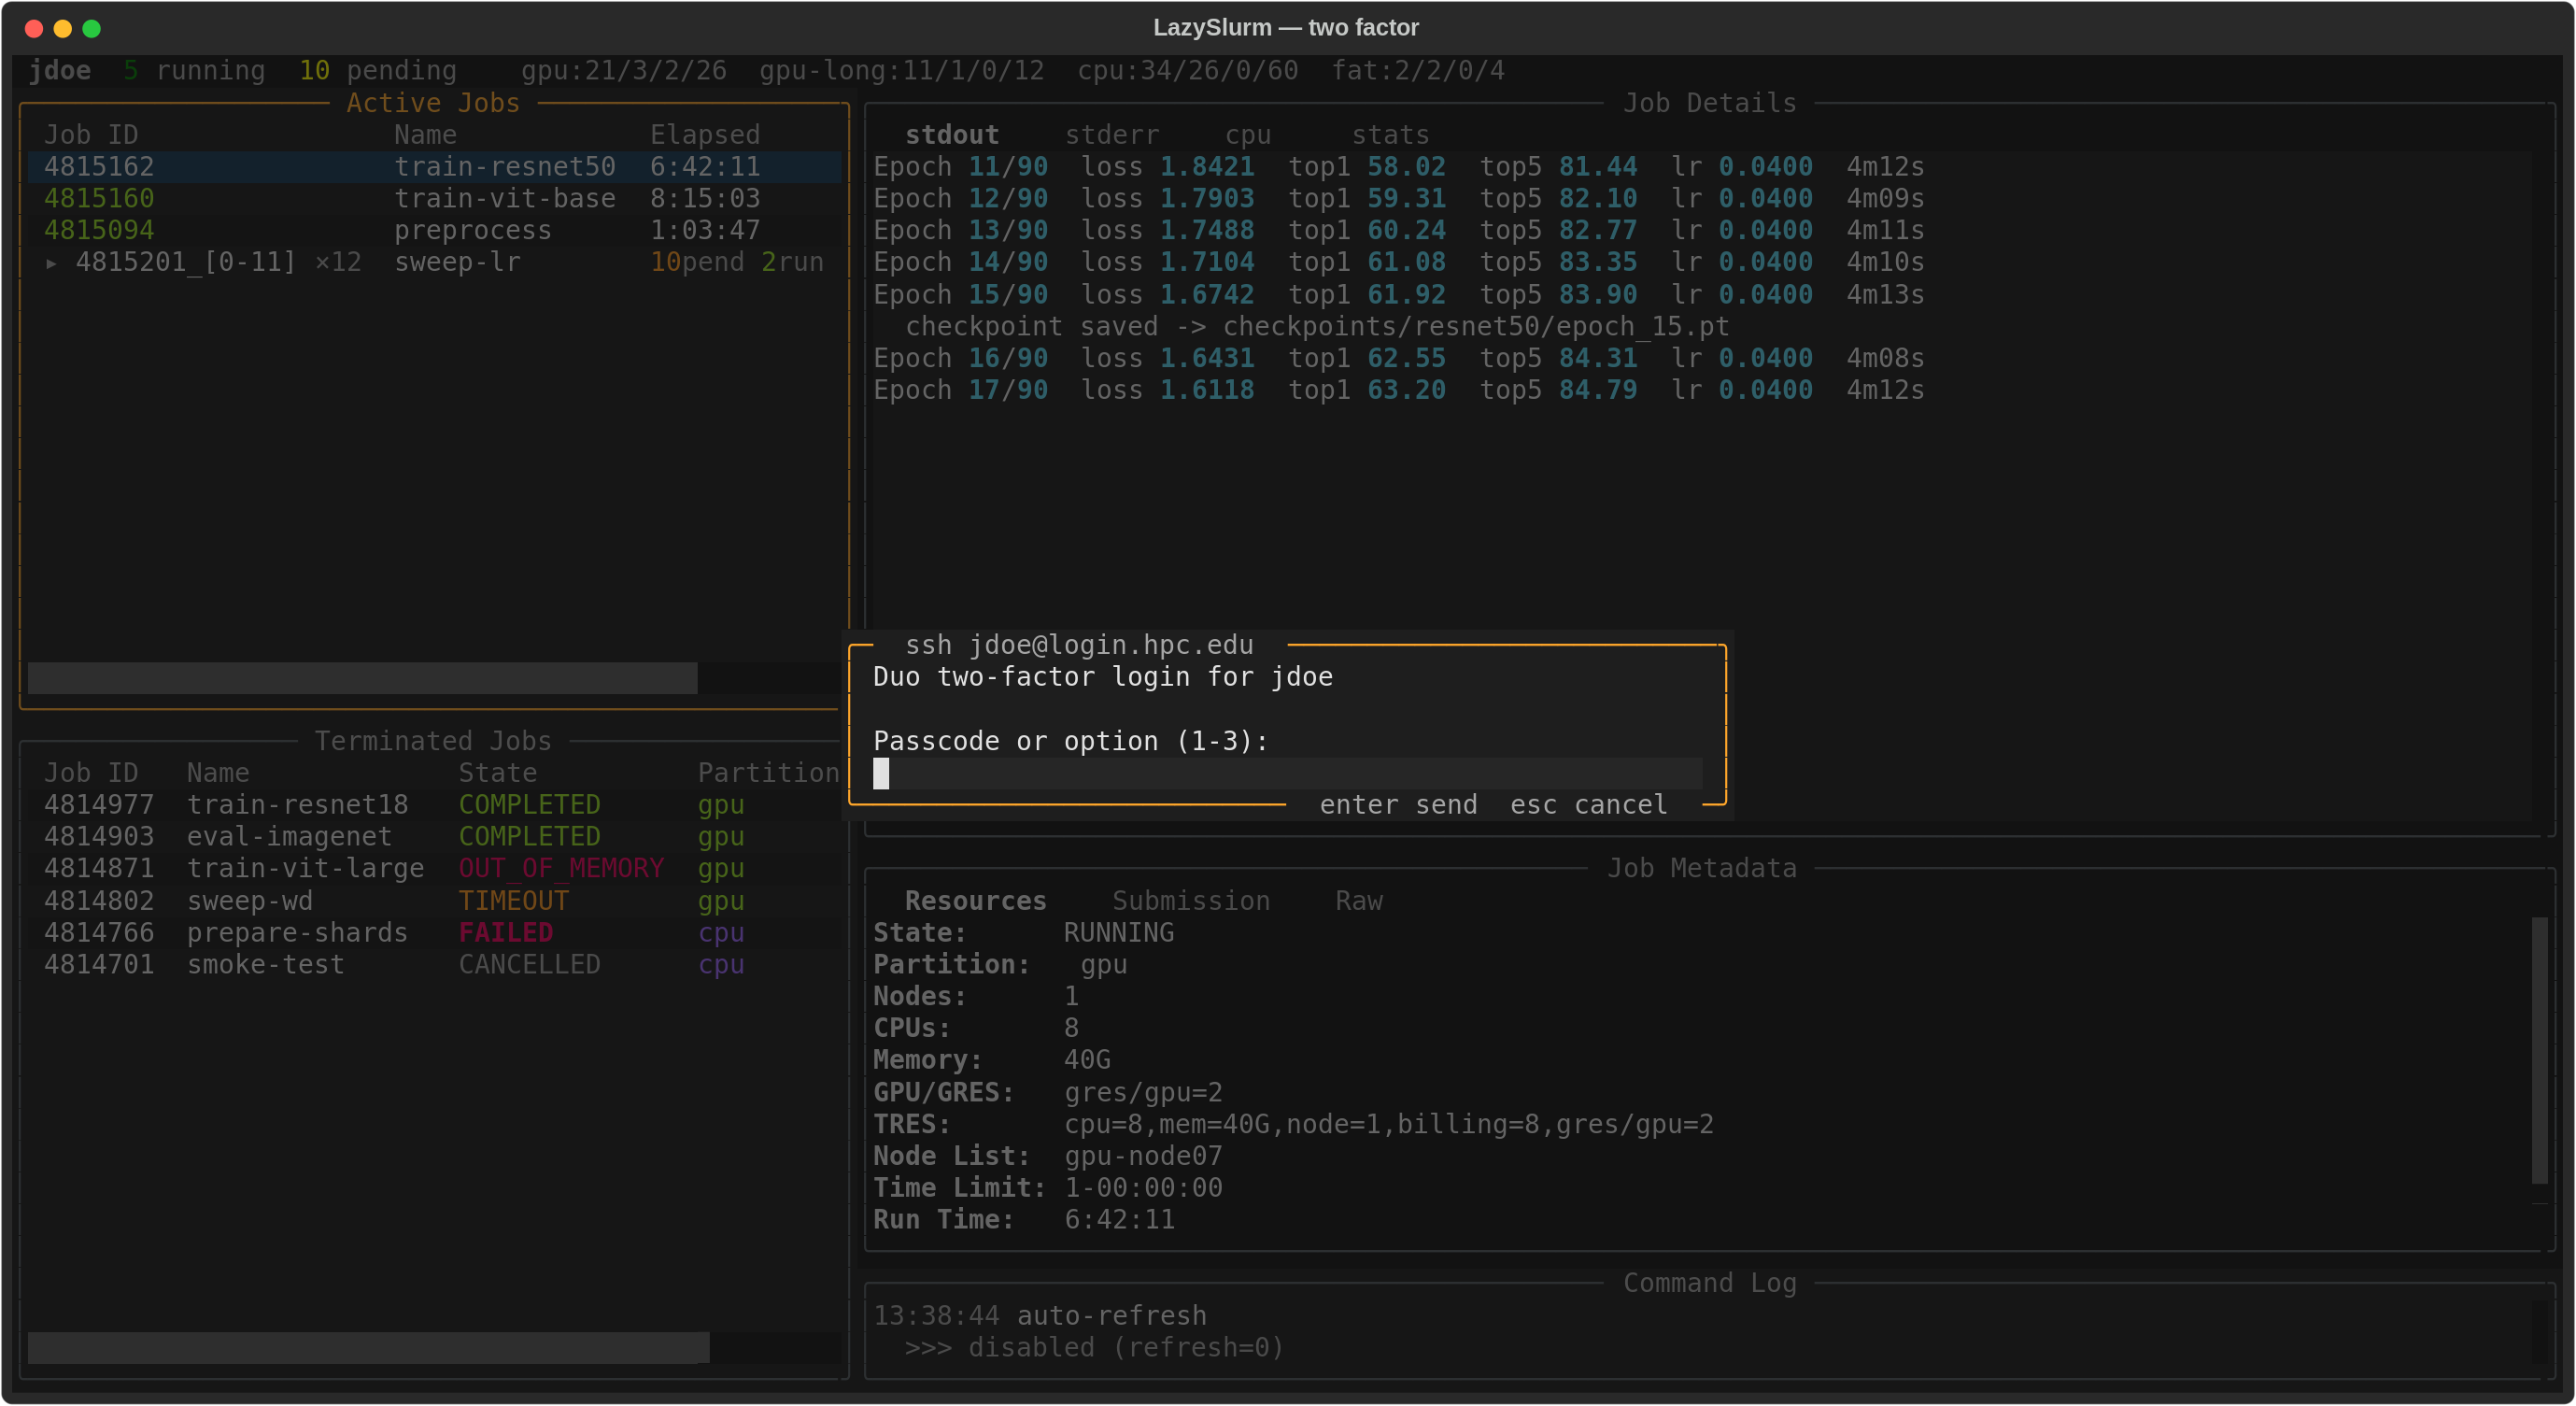
The label is the server's own prompt text, so it reads exactly as it would in a terminal —
Password:, Verification code:, Passcode or option (1-3):, Token_Response: and so
on. Input is masked (host-key (yes/no) questions are not). You are asked once, at
startup, because every later command reuses that connection.
If you mistype a code or press Escape, the Command Log says so and nothing is polled;
press r to retry the connection. Failures report the server's own message (for example
Permission denied (keyboard-interactive)) rather than a generic timeout.
Everything else that shells out reuses the same authenticated connection, so 2FA is never requested twice:
| Feature | How it reaches the cluster |
|---|---|
| Slurm commands, log reads | Written into the shared shell channel |
| Live CPU/GPU tabs | The hop to the compute node is made from the login node, inside the session |
Shell on a node (o), interactive_shell = "ssh" |
A ProxyCommand over the session's control socket (not -J) |
Shell on a node (o), interactive_shell = "srun" |
srun --pty run on the login node, inside the session |
Fetching a log for the editor (e) |
scp over the session's control socket |
The control socket lives in ~/.ssh/cm-lazyslurm/. If you already have a master
connection to that host, it is reused and you are not prompted at all — passwordless keys
therefore still connect with no interaction.
Other remote notes
Defaults and limits worth knowing
When using --remote user@host, the username is automatically used as the default
--user for Slurm queries (no need to specify both).
The archived-script fallback for resubmission is local-only: the archive lives on your
machine while sbatch runs on the login node.
Login node warning: If the local or remote hostname contains "login", LazySlurm shows a warning popup reminding you to be mindful of resource usage on shared login nodes.
Configuration
LazySlurm stores persistent settings in ~/.config/lazyslurm/config.toml (respects
$XDG_CONFIG_HOME). The file is created automatically when you use --partition-order,
or you can create it by hand.
Example config file
Every setting, with its default
# All CLI arguments can be set here as defaults.
# CLI arguments always override config file values.
# When a CLI arg overrides a config value, it is shown in the Command Log.

refresh = 3.0            # -r/--refresh: auto-refresh interval in seconds (0 = off)
days = 14                # -d/--days: how many days back for terminated jobs
user = "myuser"          # -u/--user: Slurm user to monitor
partition = ""           # -p/--partition: filter by partition (empty = all)
no_gpu = false           # --no-gpu: disable GPU monitoring tab
no_live = false          # --no-live: disable live CPU/GPU monitoring
remote = ""              # -H/--remote: SSH target for remote mode
editor = "vim"           # text editor for viewing logs ("vim", "nano", "less", etc.)
pager = "less"           # pager for browsing whole logs with 'l' ("less", "more", "bat")

# Column display settings
max_name_width = 16      # max characters for job name column (0 = unlimited)
max_partition_width = 16 # max characters for partition column (0 = unlimited)
abbreviate_states = false # use short state names: COMP, FAIL, TIME, CAN, OOM, ...
collapse_arrays = true   # fold a job array into one row; Enter expands it

# Cache settings
# cache_max_age_days = 30  # auto-delete cached job info older than N days
                           # set to null to never delete (keep forever)
# script_cache_dir = ""    # where archived sbatch scripts live
                           # (default: ~/.config/lazyslurm/scripts)

# Partition display order in the cluster bar.
# Partitions not listed appear after these in their default order.
# Set via CLI: lazyslurm --partition-order gpu,cpu,fat
partition_order = ["gpu", "cpu", "fat"]

# Custom partition colors in the job tables.
# Overrides the automatic hash-based coloring.
# Valid color names: cyan, magenta, yellow, green, blue, red,
# bright_cyan, bright_magenta, bright_green, white, dim, bold,
# or any Rich color (e.g. "dark_orange", "grey50").
[partition_colors]
gpu = "green"
cpu = "cyan"
fat = "magenta"
debug = "dim"
CLI vs config file
Which wins, and what gets logged
All CLI arguments can be set in the config file. The precedence is:
CLI argument > config file > built-in default
When a CLI argument overrides a config file value that differs, the override is logged in the Command Log panel at startup.
Partition order
Pin the partitions you care about first
To set a custom partition order for the cluster bar:
# Set once — automatically saved for future sessions
lazyslurm --partition-order gpu,cpu,fat
CLI Reference
lazyslurm
Every flag, with defaults
lazyslurm [-h] [-r SEC] [-d N] [-u USER] [-p PARTITION]
         [--no-gpu] [--no-live] [--partition-order P1,P2,...] [-H HOST]
| Flag | Description | Default |
|---|---|---|
-r, --refresh |
Auto-refresh interval in seconds. Set to 0 or off to disable. |
5 |
-d, --days |
How many days back to show terminated jobs | 7 |
-u, --user |
Slurm user to monitor. When --remote user@host is used, defaults to the remote username. |
$USER |
-p, --partition |
Filter jobs by partition | (all) |
--no-gpu |
Disable the GPU monitoring tab | off |
--no-live |
Disable live CPU and GPU monitoring (no SSH/srun to nodes) | off |
--partition-order |
Comma-separated partition display order for cluster bar | (sinfo order) |
-H, --remote |
SSH target for remote mode (e.g. user@login.hpc.edu) |
(local) |
Requirements
- Python 3.10+
- Slurm CLI tools:
squeue,sacct,sinfo,scontrol,sstat,scancel,sbatch - Optional:
spriofor the pending-job priority breakdown,sreport/ssharefor the account usage panel — each degrades to a message where it is unavailable - Textual (installed automatically)
- For GPU monitoring:
nvidia-smion compute nodes,srun --overlapsupport - For remote mode: SSH access to the cluster login node
License
1 maintainer

Download files
Download the file for your platform. If you're not sure which to choose, learn more about installing packages.
Source Distribution
Built Distribution
Filter files by name, interpreter, ABI, and platform.
If you're not sure about the file name format, learn more about wheel file names.
Copy a direct link to the current filters
File details
Details for the file lazyslurm_py-0.3.0.tar.gz.
File metadata
- Download URL: lazyslurm_py-0.3.0.tar.gz
- Upload date:
- Size: 2.7 MB
- Tags: Source
- Uploaded using Trusted Publishing? No
- Uploaded via:
uv/0.9.5
File hashes
| Algorithm | Hash digest | |
|---|---|---|
| SHA256 |
7f3514b37f3170f95528362fd23c583a3d8eecc0d700bce32116d3e16380d87b
|
|
| MD5 |
9b04a955c40776043073f7bc53ecd74e
|
|
| BLAKE2b-256 |
25b74b15049306761867e246e36128fd26f985e8a9fb7c980fdbf16b5f479869
|
File details
Details for the file lazyslurm_py-0.3.0-py3-none-any.whl.
File metadata
- Download URL: lazyslurm_py-0.3.0-py3-none-any.whl
- Upload date:
- Size: 106.6 kB
- Tags: Python 3
- Uploaded using Trusted Publishing? No
- Uploaded via:
uv/0.9.5
File hashes
| Algorithm | Hash digest | |
|---|---|---|
| SHA256 |
822467fbb265820e4b0f1785f67b35343725121a8f406fae3a02c9d949abb8e3
|
|
| MD5 |
7728a332510f9484d22c0314bcb84836
|
|
| BLAKE2b-256 |
b8ceaa151a363f646a8a3e885690e8927f7599723fdd1b9a0f5ac4e9c17d7874
|














