An interactive high-performance data visualization library

Project description
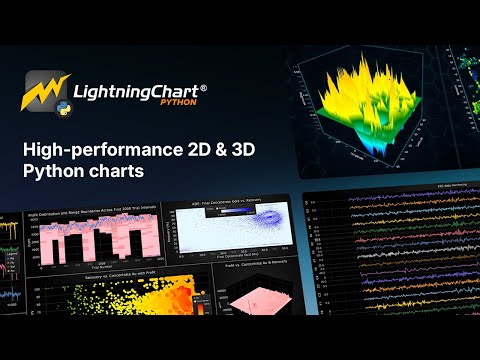
LightningChart Python - Ultra-High-Performance Python Charts
LightningChart Python is a GPU-accelerated, WebGL-powered data visualization library for Python, designed to deliver exceptional performance and real-time responsiveness when creating charts using massive static or streaming datasets.
Watch the showcase video below:
Key Features
- High-performance rendering: Leverages GPU acceleration and WebGL rendering for smooth interactivity and high refresh rates, even with millions of data points.
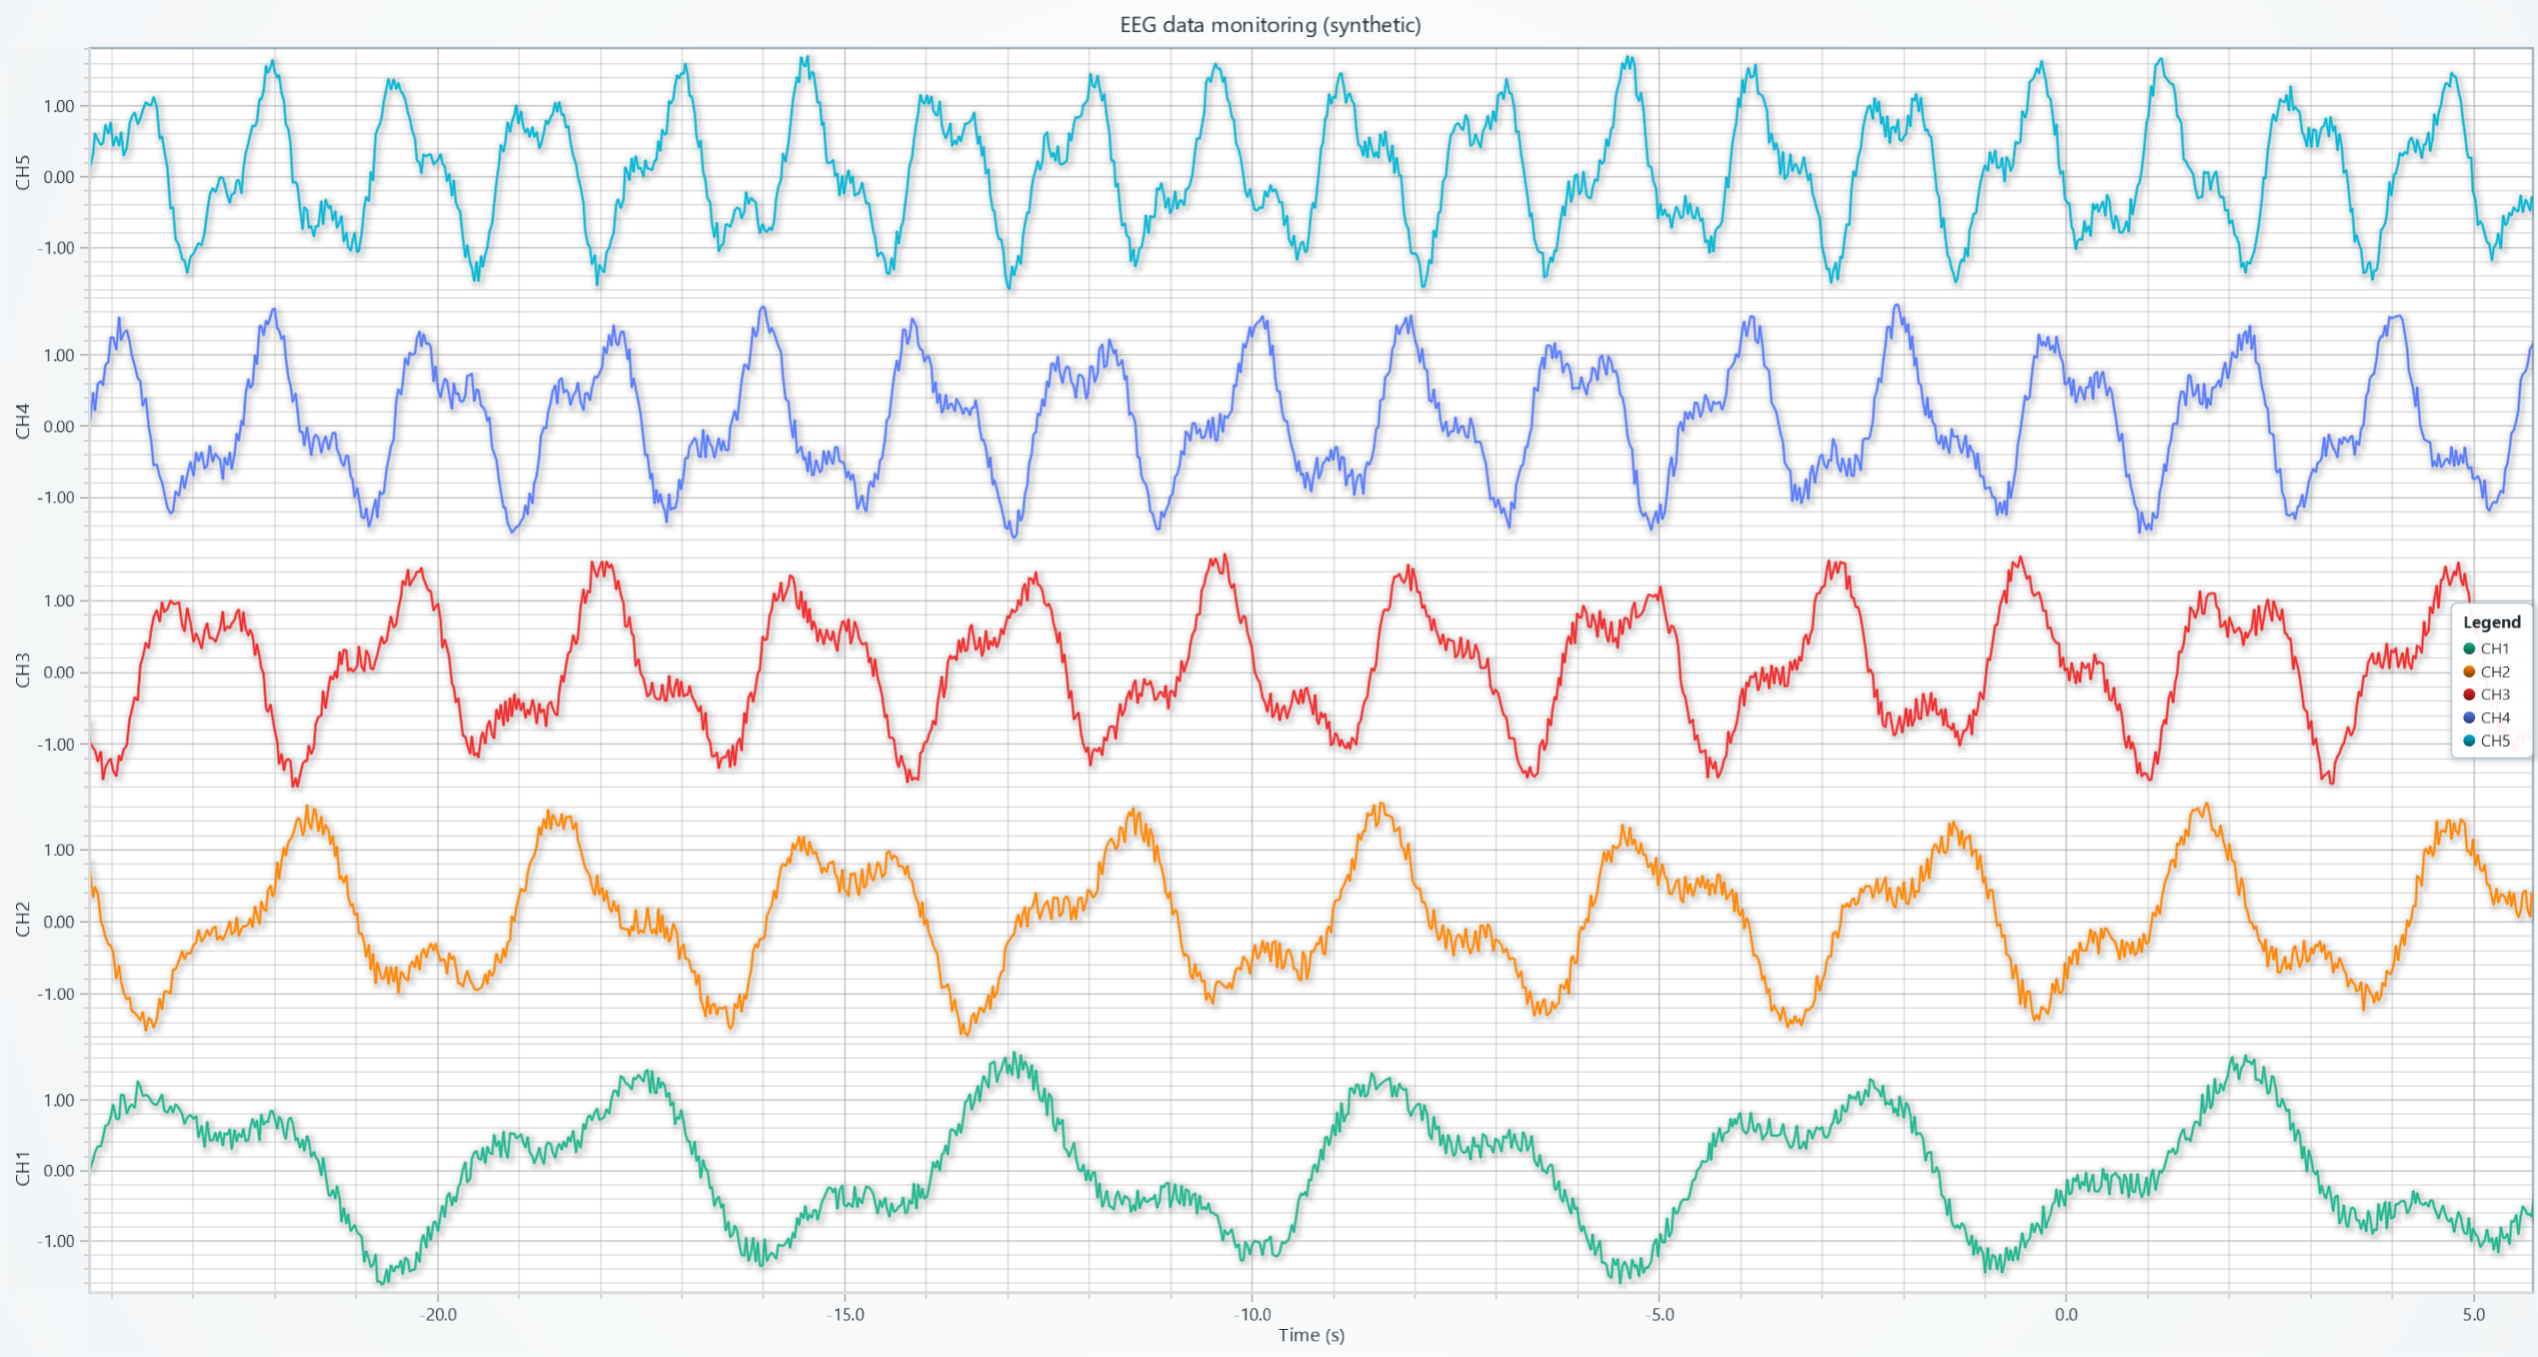
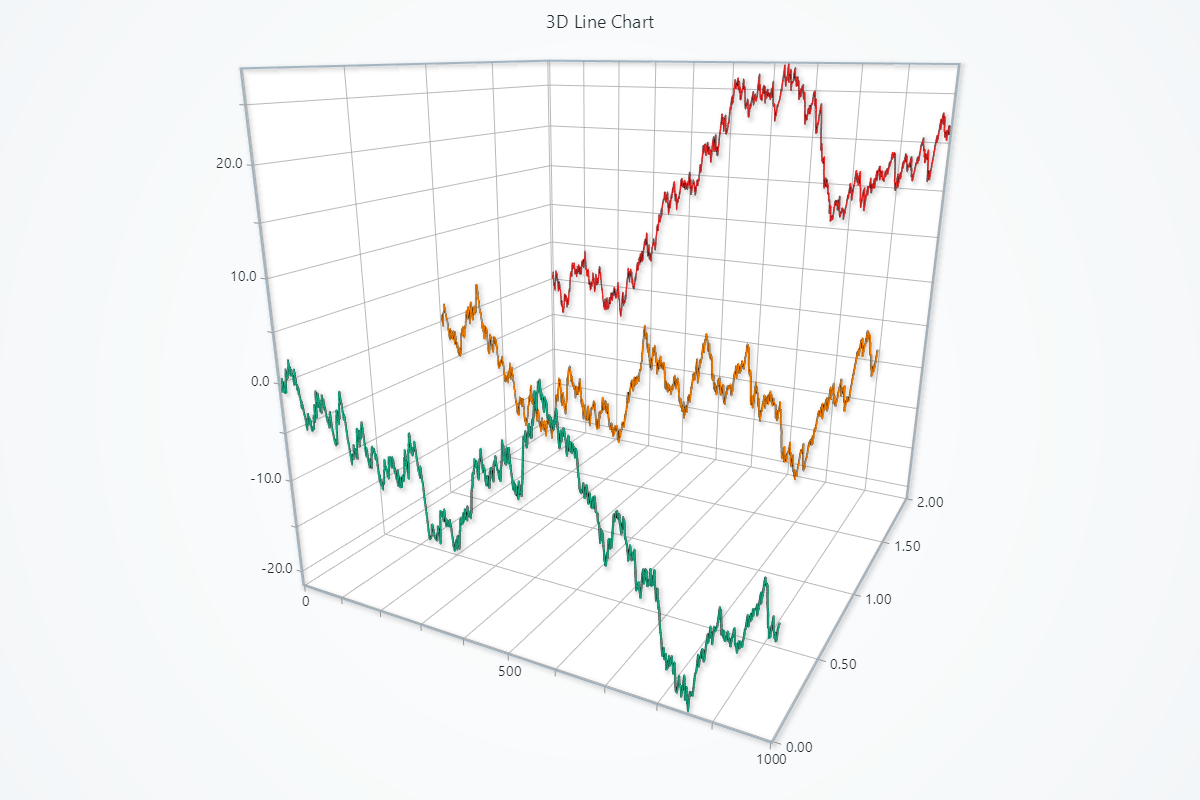
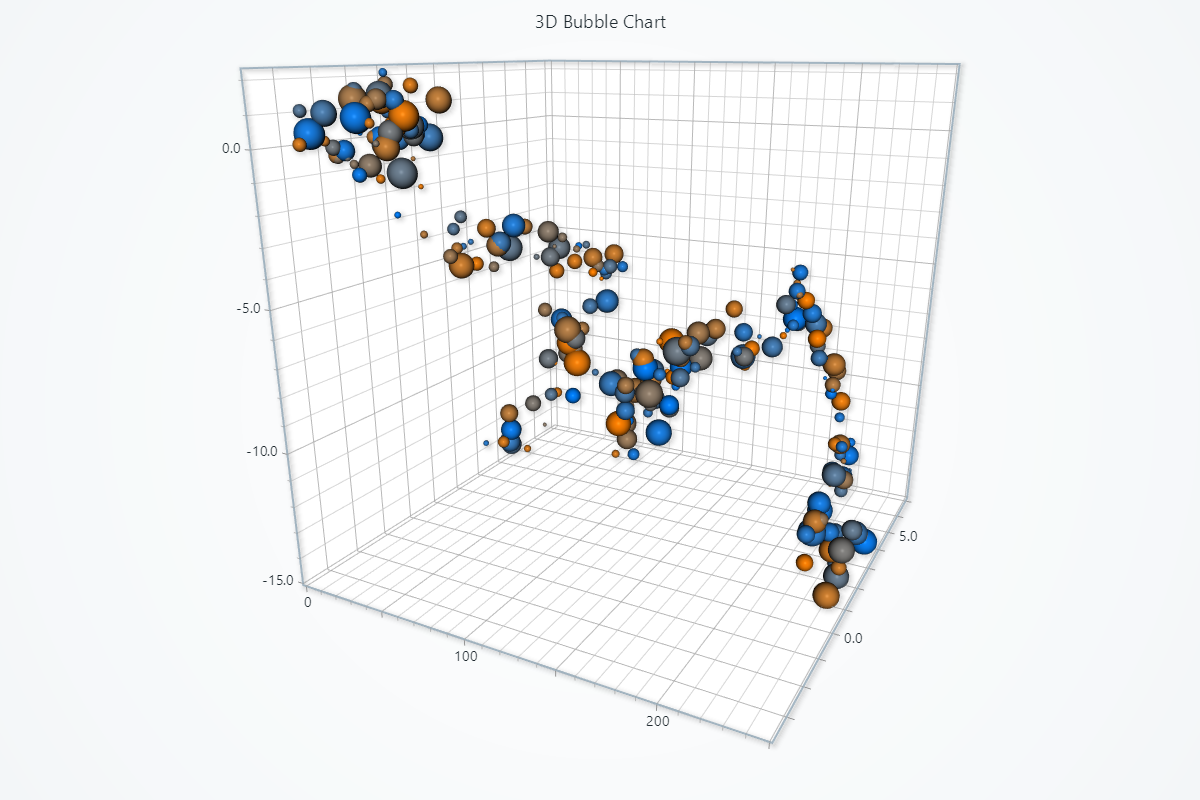
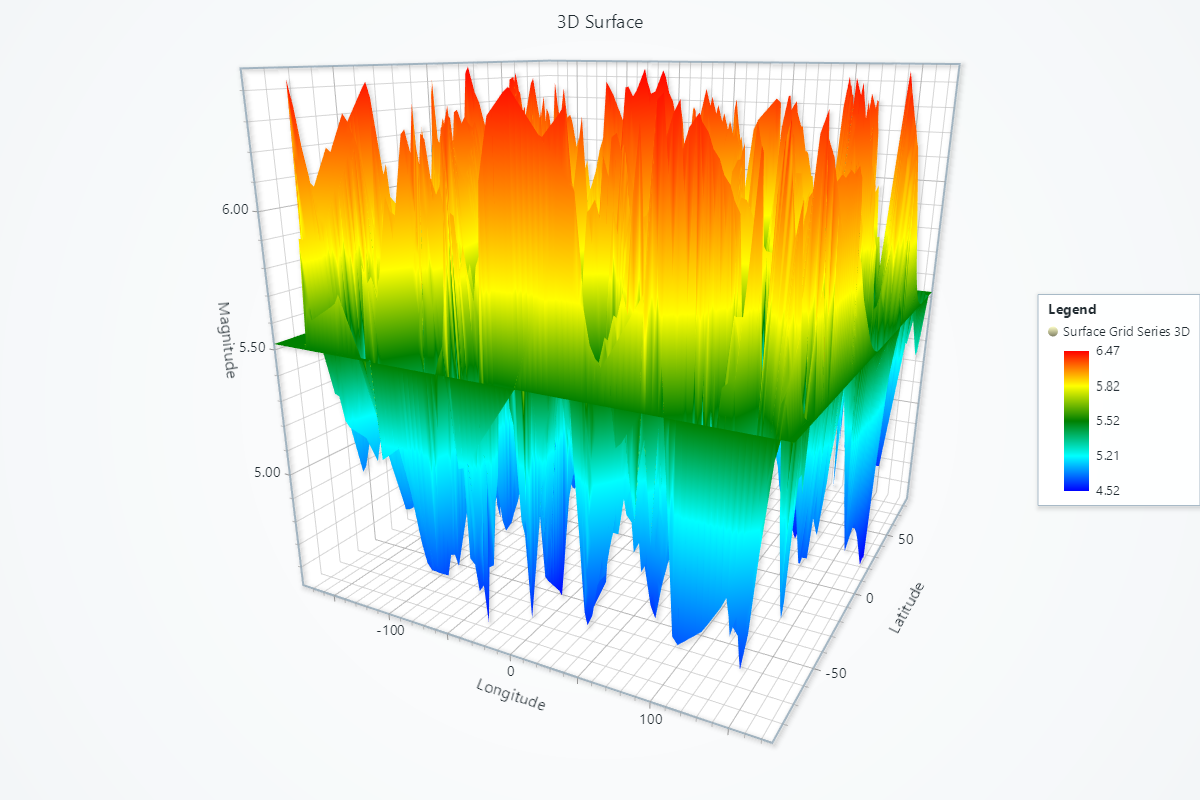
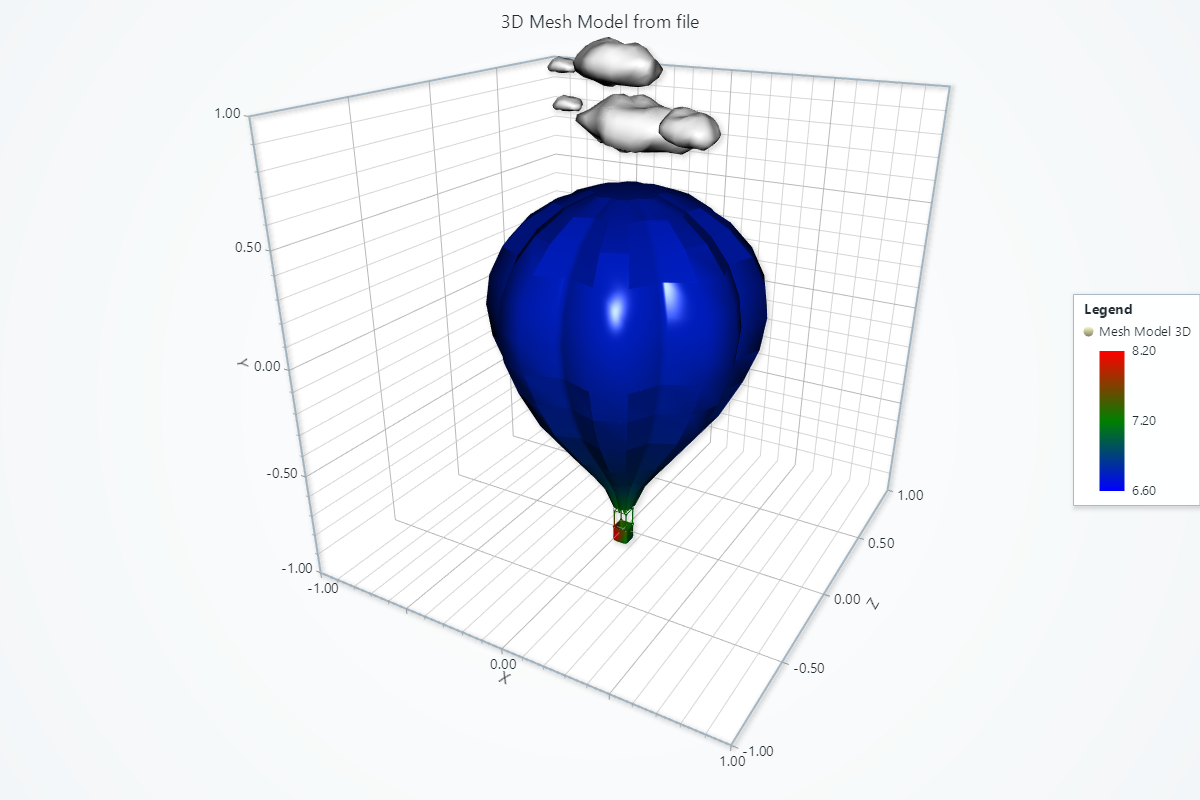
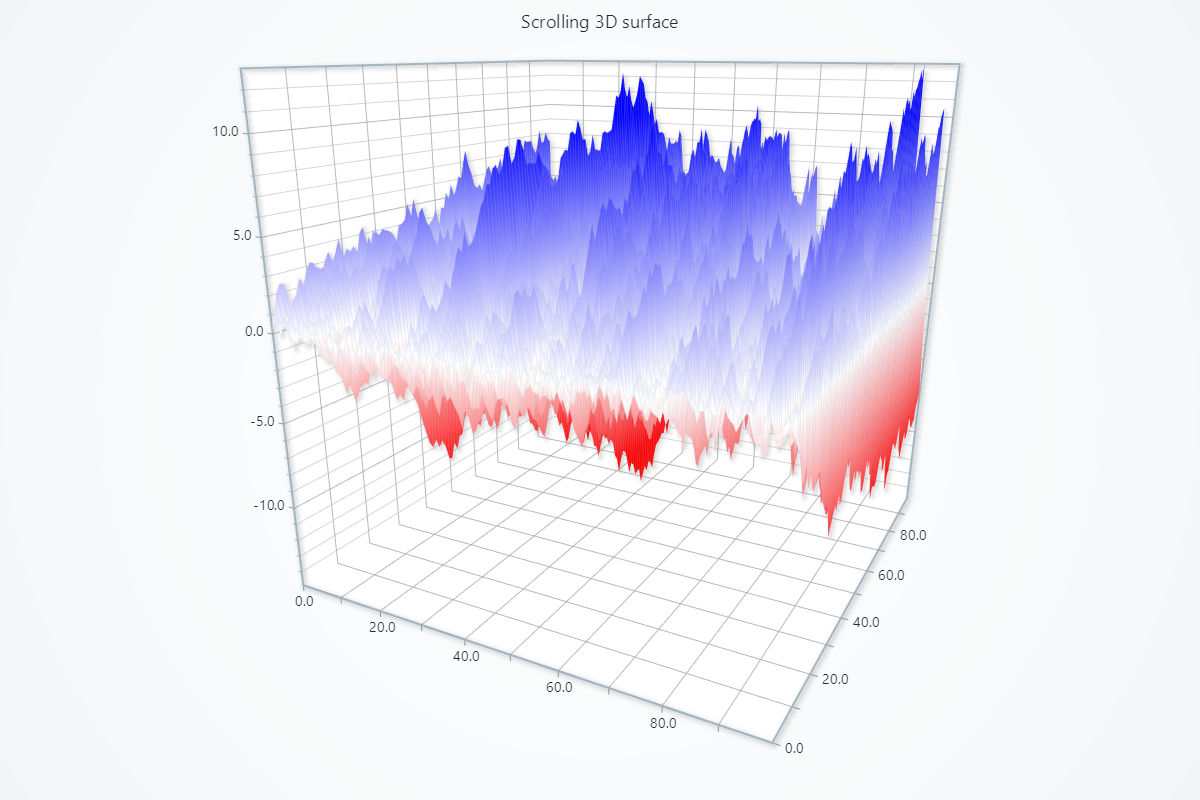
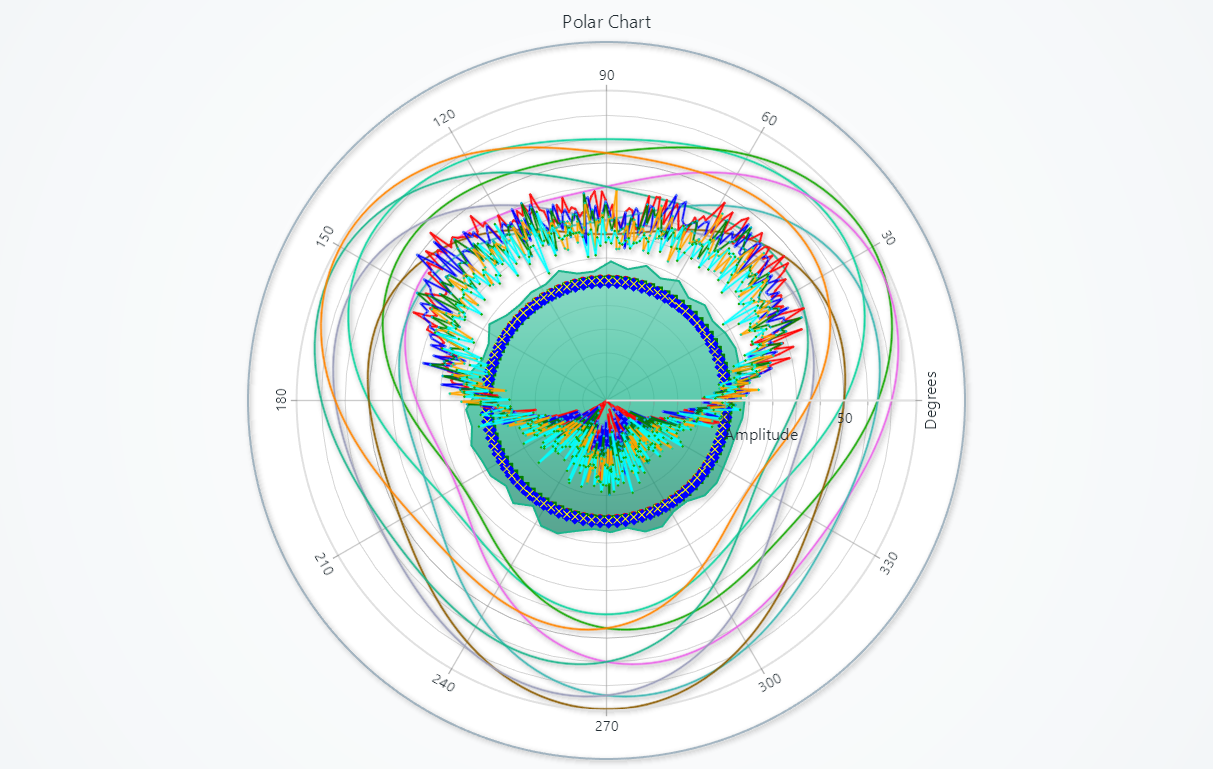
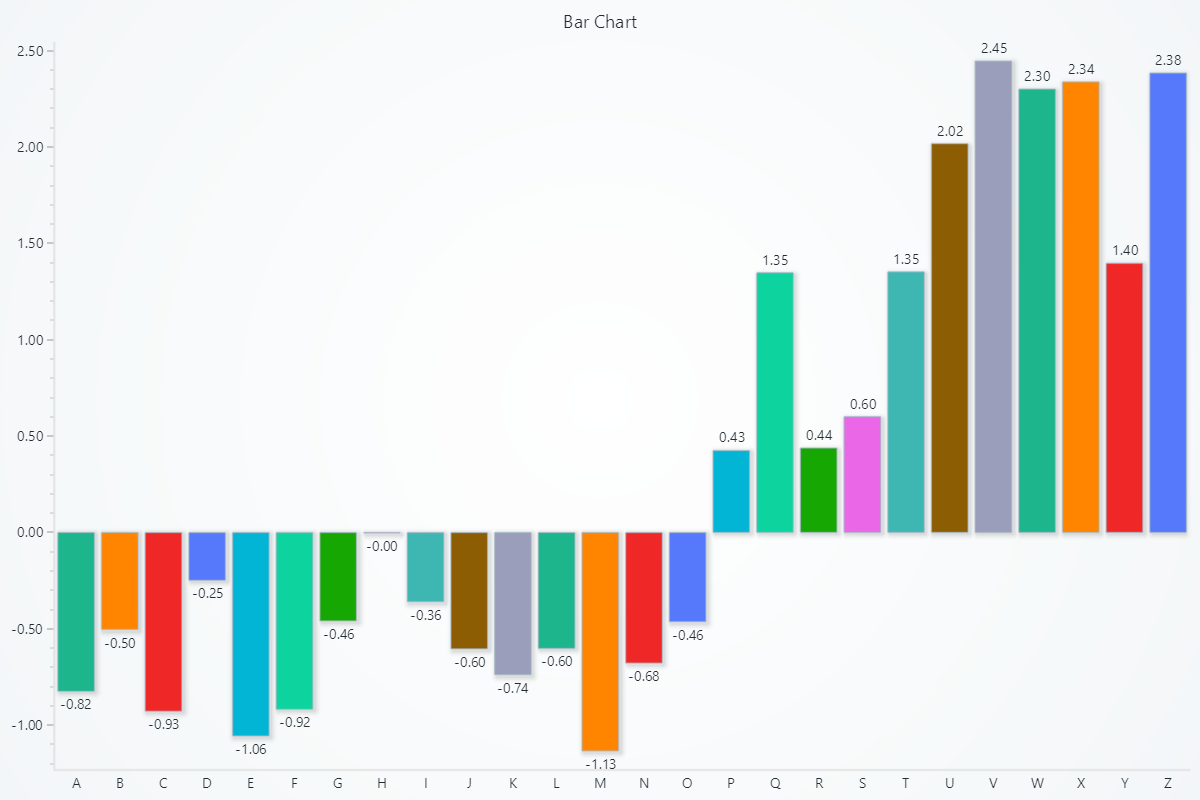
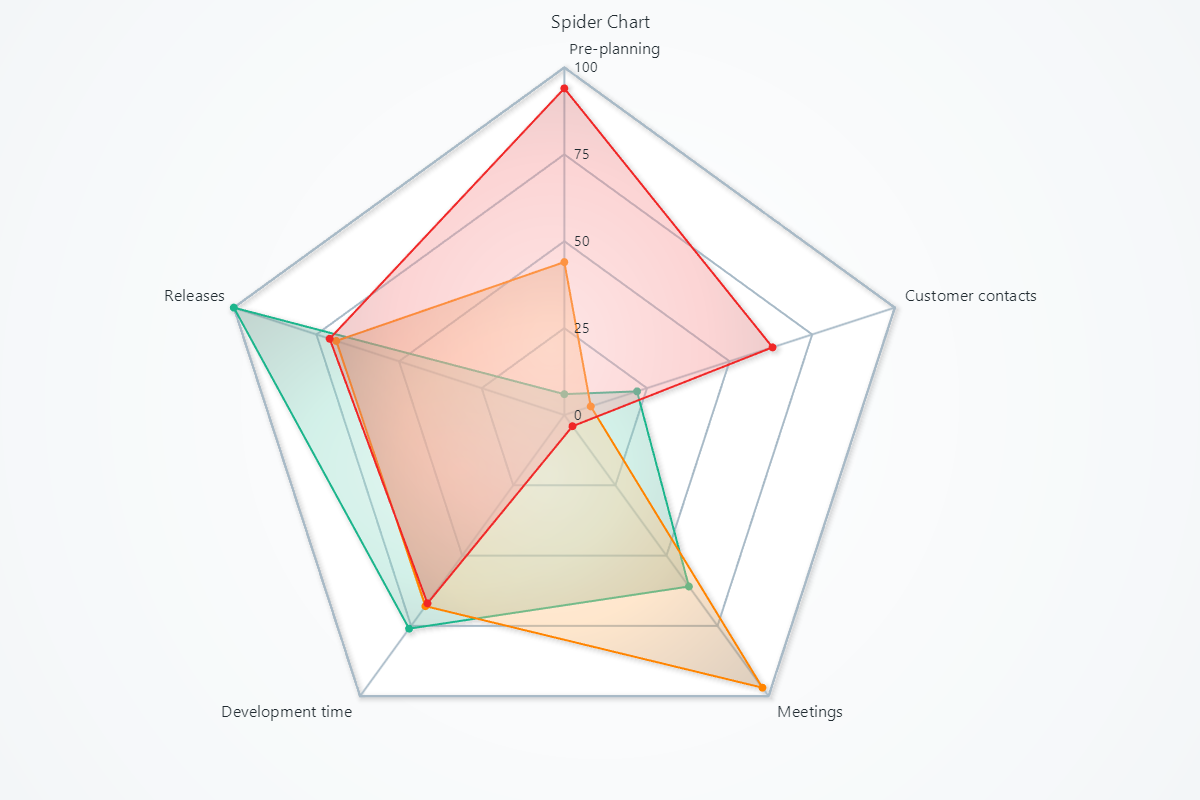
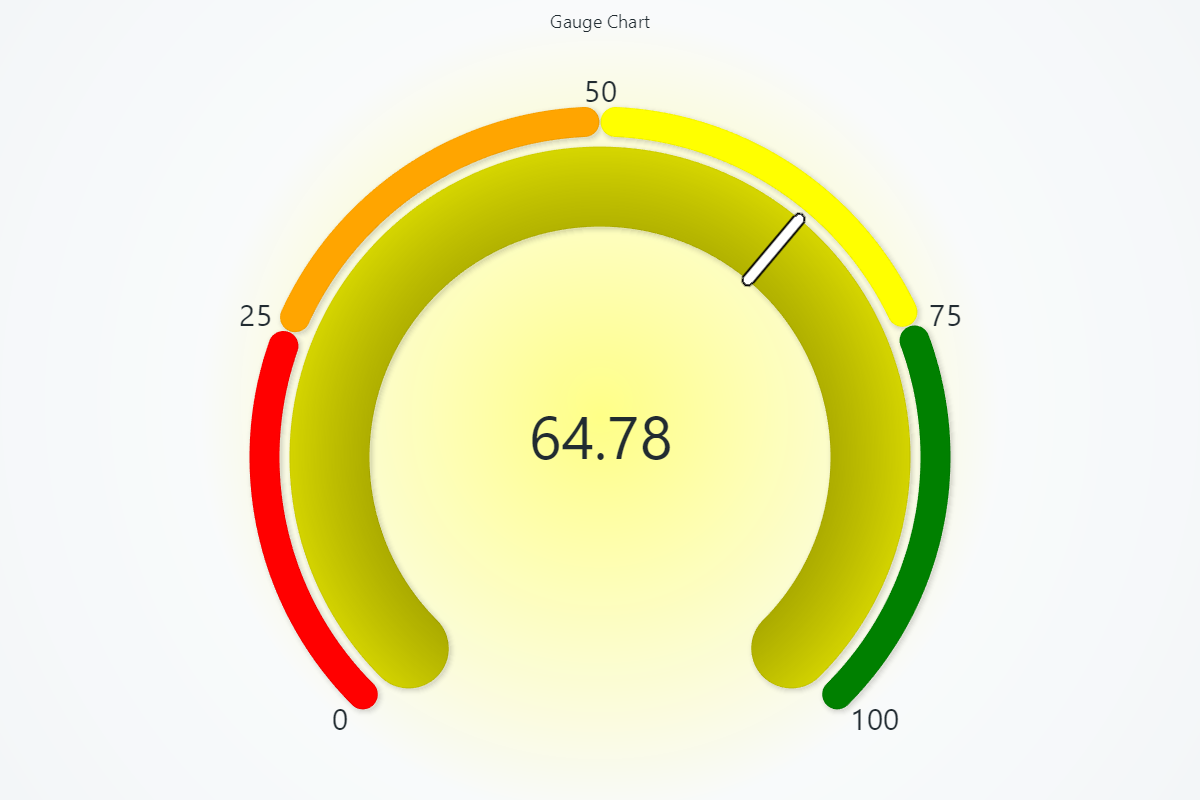
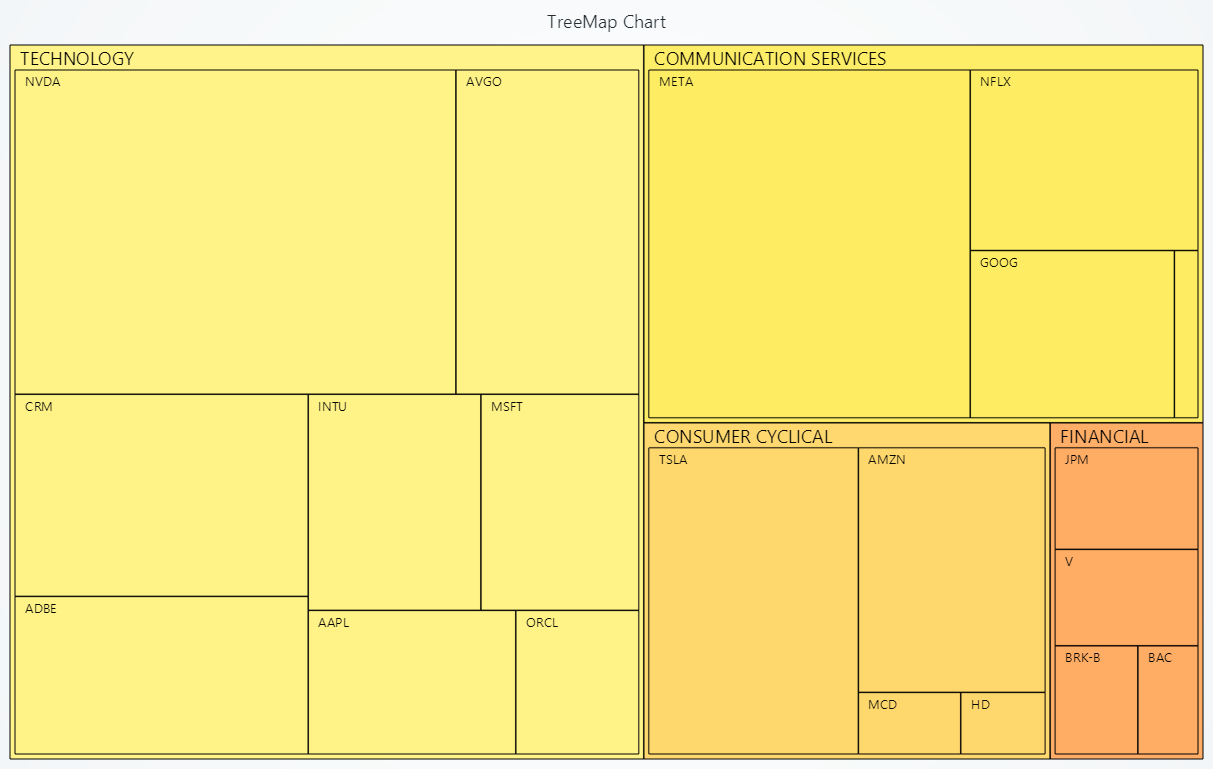
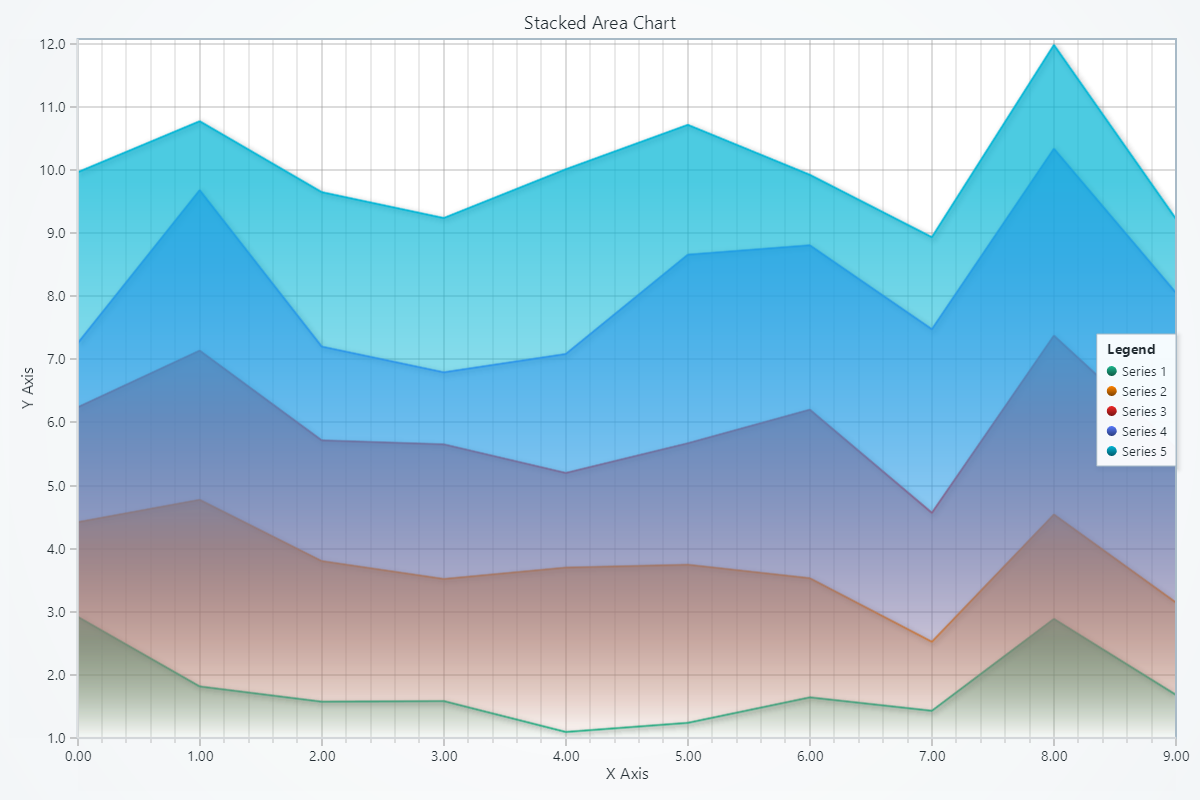
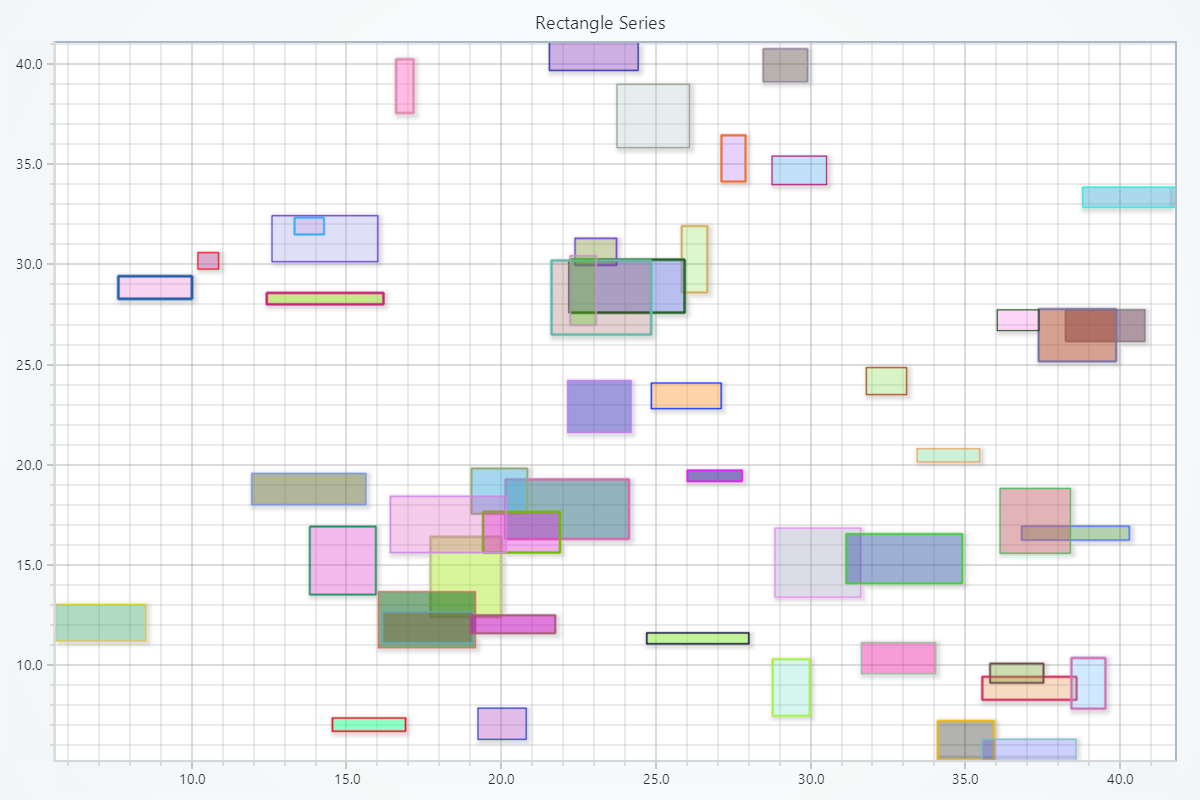
- 2D & 3D charts: Support for an extensive range of visualization types, including line, scatter, heatmap, area, box, figure, spline, step, point-line, polar, bar, pre, funnel, pyramid, map, treemap, parallel coordinate, gauge and 3D charts including line, scatter, surface, scrolling surface, mesh model and box.
- Real-time streaming: Built to handle real-time updates efficiently for dynamic dashboards and monitoring solutions.
- Seamless integration: Works with familiar Python tools: NumPy, Pandas, and GUI frameworks like PyQt, as well as Jupyter notebooks and standalone scripts.
- Licensing options:
- Data Scientist (free/premium): Tailored for personal projects, including scripting and notebook-based workflows. Includes a 7-day free trial of premium features.
- Software Developer: Per-seat, perpetual license designed for embedding charts in commercial, distributable software.
Getting Started
Installation
pip install lightningchart
Basic Example
import lightningchart as lc
import random

lc.set_license("your-license-key")

x = list(range(250))
y = [random.random() for _ in x]

chart = lc.ChartXY(theme=lc.Themes.Light, title="Line Chart")
chart.add_line_series().add(x, y)
chart.open()
About Performance:
The following results are on average, and highlight how much faster LightningChart Python is compared to other Python charting libraries:
- Real-time tests: 3,630 times faster than other Python libraries tested
- Static tests: 22,155 times faster than other Python libraries tested
For more information on performance benchmarks, visit our Performance Benchmark page.
LightningChart Python Trader
For financial data visualization, consider LightningChart Python Trader, the most comprehensive Python library for financial charting, featuring over 100 built-in technical indicators (e.g., SMA, EMA, oscillators, volatility tools), drawing tools, and advanced technical analysis capabilities.
Gallery
 |
 |
 |
 |
 |
 |
 |
 |
 |
 |
 |
 |
 |
 |
 |
 |
Useful links
Release history Release notifications | RSS feed


Download files
Download the file for your platform. If you're not sure which to choose, learn more about installing packages.
Source Distributions
Built Distribution
Filter files by name, interpreter, ABI, and platform.
If you're not sure about the file name format, learn more about wheel file names.
Copy a direct link to the current filters
File details
Details for the file lightningchart-2.2-py3-none-any.whl.
File metadata
- Download URL: lightningchart-2.2-py3-none-any.whl
- Upload date:
- Size: 5.0 MB
- Tags: Python 3
- Uploaded using Trusted Publishing? No
- Uploaded via: twine/6.0.1 CPython/3.13.1
File hashes
| Algorithm | Hash digest | |
|---|---|---|
| SHA256 |
71de1274fd1eb86d67d8711224eac92fdd544fded1f98bd4552900a85e692f6c
|
|
| MD5 |
1f47a155f95b34edc178eae34a578036
|
|
| BLAKE2b-256 |
f0febea770fa0e4dda3406dc9c384ff436d17af0c1fba448089dcd53c82f0eb0
|


