Various command line utilities for Linux

Project description
linux-tools
Various command line utilities for Linux written in python.
License
Apache 2.0
Installation
$ pip install --user linux-tools
bits
usage: bits [-h] [-m | -g | -b | -l | -L] MASK_OR_LIST [MASK_OR_LIST ...]

Convert a bit list into a hex mask or the other way around.

positional arguments:
  MASK_OR_LIST        A set of bits specified as a hexadecimal mask value
                      (e.g. 0xeec2) or as a comma-separated list of bit IDs.
                      Consecutive ids can be compressed as ranges (e.g.
                      5,6,7,8,9,10 --> 5-10). Optionally, if an argument
                      starts with a comma, it will be parsed as a single
                      hexadecimal mask split in 32bit groups (e.g.
                      ,00014000,00000000,00020000 --> 17,78,80). By default
                      all will be OR'ed together. A specific group can be
                      XOR'ed by prefixing it with ^, AND'ed by prefixing it
                      with & or NOT'ed by prefixing it with ~.

options:
  -h, --help          show this help message and exit

mode:
  -m, --mask          Print the combined args as a hexadecimal mask value
                      (default).
  -g, --grouped-mask  Print the combined args as a hexadecimal mask value in
                      32bit comma separated groups.
  -b, --bit           Print the combined args as a bit mask value.
  -l, --list          Print the combined args as a list of bit IDs.
                      Consecutive IDs are compressed as ranges.
  -L, --list-full     Print the combined args as a list of bit IDs.
                      Consecutive IDs are *NOT* compressed as ranges.
Examples:
$ bits -m 4,5-8 16,30
0x400101f0
$ bits -l 0xeec2
1,6,7,9-11,13-15
$ bits -b 4,5-8 16,30
0b100_0000_0000_0001_0000_0001_1111_0000
irqstat
usage: irqstat [-h] [-r ROOT] [-c CPU_RANGE_OR_MASK] [-i IRQ] [-n] [-s]
               [-z] [-t THRESHOLD] [-e]

Display linux interrupts information.

options:
  -h, --help            show this help message and exit
  -r ROOT, --root ROOT  Root dir used to determine path to /proc (default /).
  -c CPU_RANGE_OR_MASK, --cpu CPU_RANGE_OR_MASK
                        CPUs specified as an hexadecimal mask values (e.g.
                        0xeec2) or as a comma-separated list of IDs.
                        Consecutive IDs can be compressed as ranges (e.g.
                        5,6,7,8,9,10 --> 5-10). Can be used multiple times.
  -i IRQ, --irq IRQ     Only show this IRQ. Can be used multiple times.
                        Special values are HARD (for numbered hardware IRQs),
                        SOFT (for unnumbered software interrupts and
                        exceptions) and ALL (for all IRQs and exceptions). By
                        default, only numbered hardware IRQs are displayed.
  -n, --num-per-cpu     Display the number of bound IRQs per CPU.
  -s, --stats           Display interrupt counts.
  -z, --display-zeroes  Also show -s/--stats with 0 values.
  -t THRESHOLD, --threshold THRESHOLD
                        Hide -s/--stats below that value. Accepts human
                        readable numbers (e.g. 1K).
  -e, --exact           Display exact stats values.
Examples:
$ irqstat -sc 0x3
IRQ      CPU-0  CPU-1  DESCRIPTION
12           0    144  IO-APIC 12-edge i8042
21         129     28  IO-APIC 21-fasteoi qxl
38          36      0  PCI-MSI 1048576-edge xhci_hcd
44           0     10  PCI-MSI 1572865-edge virtio1-virtqueues
46           0   3.7K  PCI-MSI 524289-edge virtio0-input.0
47          44      9  PCI-MSI 524290-edge virtio0-output.0
49        1.0K      0  PCI-MSI 2097153-edge virtio2-req.0
50           0    803  PCI-MSI 2097154-edge virtio2-req.1
54           0    212  PCI-MSI 442368-edge snd_hda_intel:card0
CAL      18.4K  26.8K  Function call interrupts
HI           6      1  high priority tasklet softirq
HYP          1      1  Hypervisor callback interrupts
LOC      73.1K  43.5K  Local timer interrupts
MCP         13     12  Machine check polls
NET_RX      44   3.8K  network receive softirq
NET_TX       0      1  network transmit softirq
RCU      21.2K  12.9K  RCU softirq
RES       2.3K   3.5K  Rescheduling interrupts
SCHED    34.4K  31.8K  schedule softirq
TASKLET     35     10  normal priority tasklet softirq
TIMER    30.6K  27.0K  timer softirq
TLB         51     29  TLB shootdowns
$ irqstat -c 4
IRQ       AFFINITY  EFFECTIVE-CPU  DESCRIPTION
134              4              4  IR-PCI-MSIX-0000:2e:00.0 5-edge nvme0q5
142              4              4  IR-PCI-MSI-0000:00:02.0 0-edge i915
154            0-7            0-7  dummy 21 elan_i2c
BLOCK          0-7            0-7  block device softirq
CAL            0-7            0-7  Function call interrupts
DFR            0-7            0-7  Deferred Error APIC interrupts
HI             0-7            0-7  high priority tasklet softirq
HRTIMER        0-7            0-7  high resolution timer softirq
IRQ_POLL       0-7            0-7  IO poll softirq
IWI            0-7            0-7  IRQ work interrupts
LOC            0-7            0-7  Local timer interrupts
MCE            0-7            0-7  Machine check exceptions
MCP            0-7            0-7  Machine check polls
NET_RX         0-7            0-7  network receive softirq
NET_TX         0-7            0-7  network transmit softirq
NMI            0-7            0-7  Non-maskable interrupts
NPI            0-7            0-7  Nested posted-interrupt event
PIN            0-7            0-7  Posted-interrupt notification event
PIW            0-7            0-7  Posted-interrupt wakeup event
PMI            0-7            0-7  Performance monitoring interrupts
RCU            0-7            0-7  RCU softirq
RES            0-7            0-7  Rescheduling interrupts
RTR            0-7            0-7  APIC ICR read retries
SCHED          0-7            0-7  schedule softirq
SPU            0-7            0-7  Spurious interrupts
TASKLET        0-7            0-7  normal priority tasklet softirq
THR            0-7            0-7  Threshold APIC interrupts
TIMER          0-7            0-7  timer softirq
TLB            0-7            0-7  TLB shootdowns
TRM            0-7            0-7  Thermal event interrupts
$ irqstat -n
CPU  AFFINITY-IRQs  EFFECTIVE-IRQs
0               14              11
1               14               3
2               16               4
3               14               2
4               14               2
5               16               3
6               17               6
7               14               2
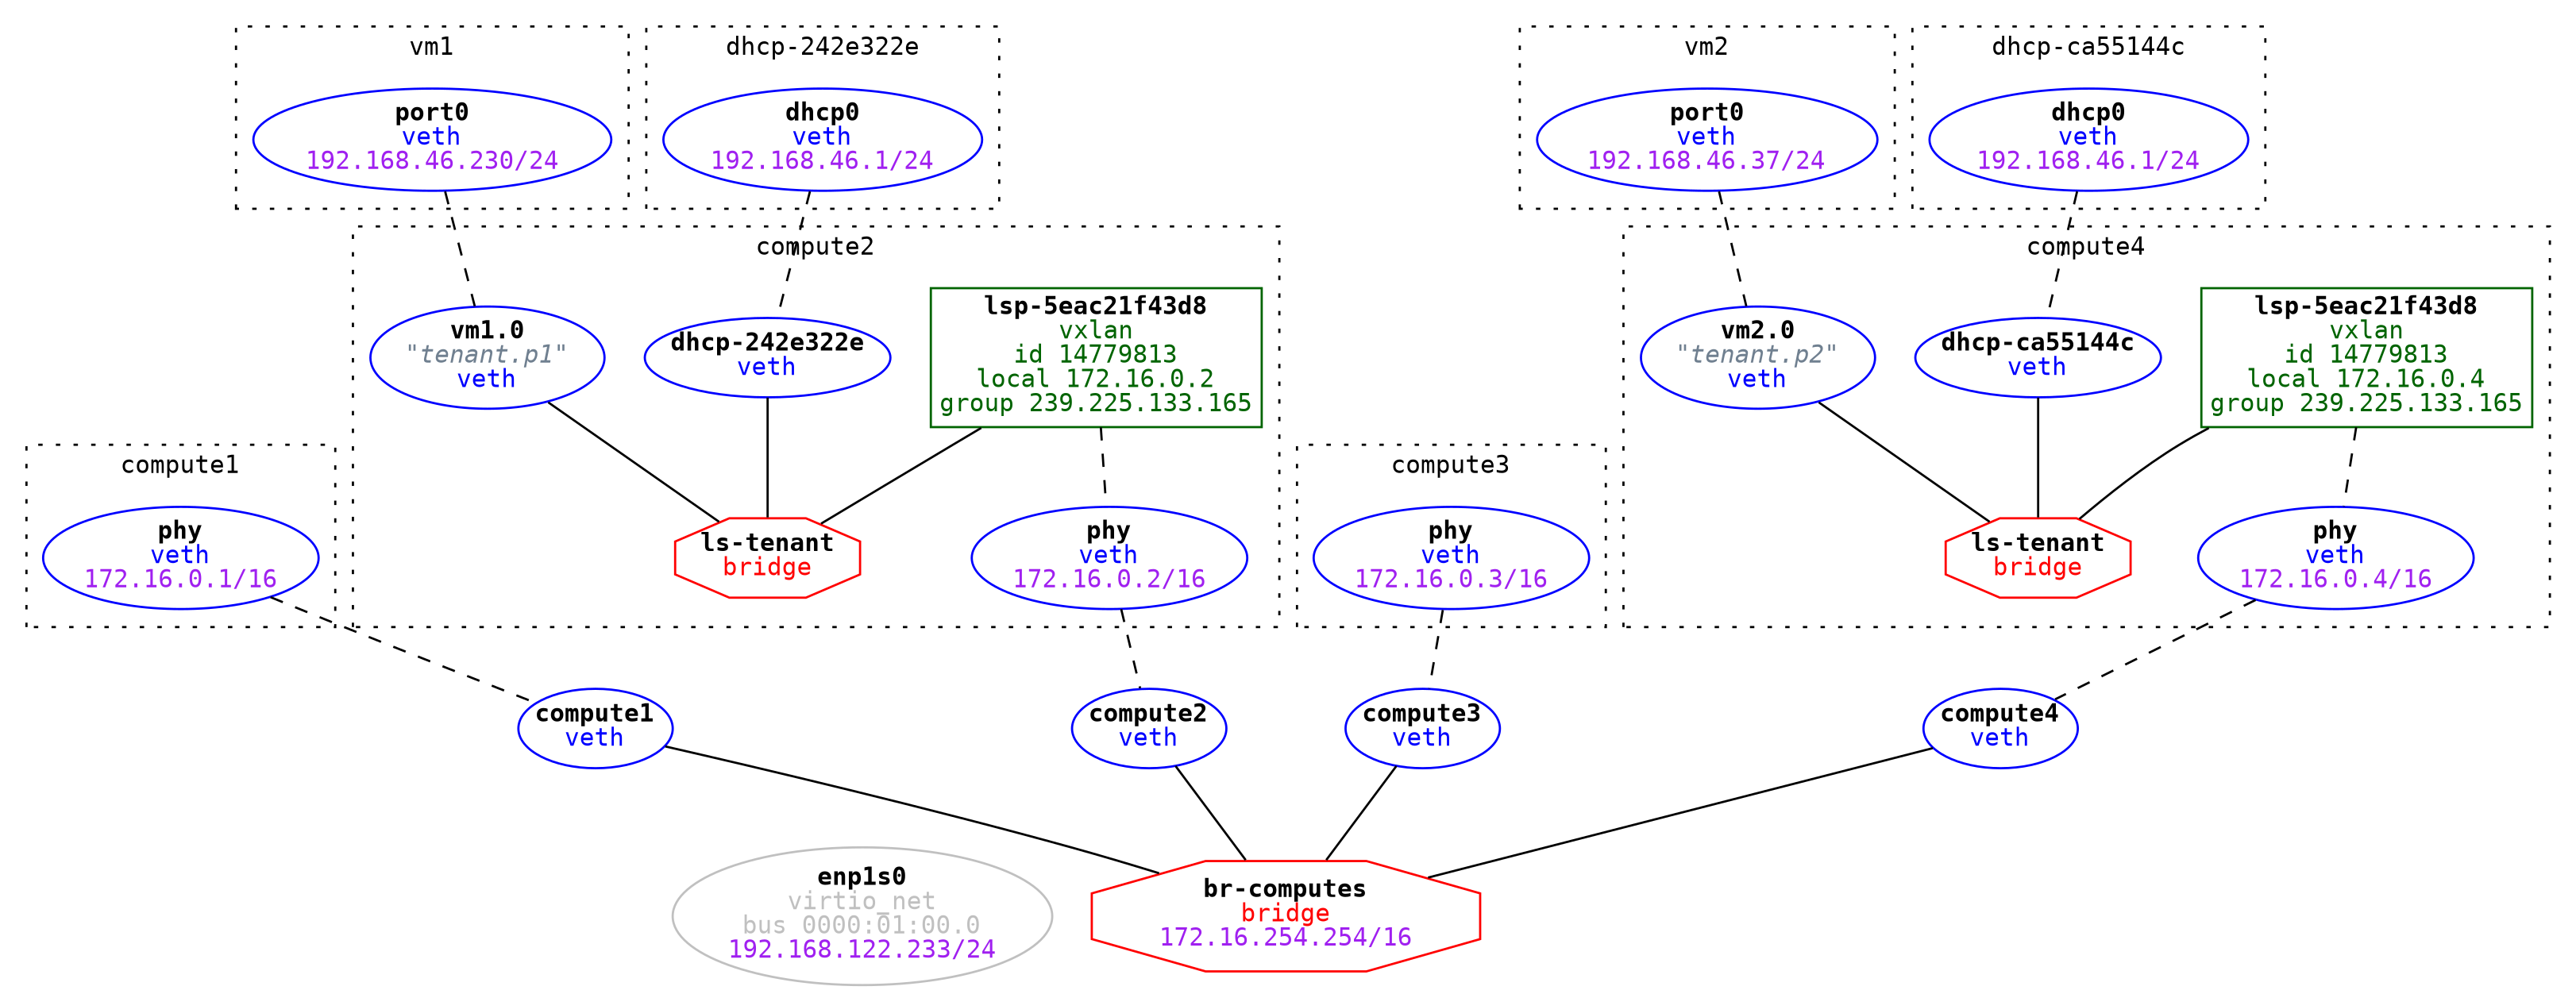
netgraph
usage: netgraph [-h] [-2] [-4] [-6] [-l]

Convert linux networking configuration to a DOT graph. The output can be piped
to dot to convert it to SVG or other formats. Example:

    netgraph.py | dot -Tsvg > net.svg

System dependencies: iproute2, ethtool

options:
  -h, --help            show this help message and exit
  -2, --l2-addresses    Display mac addresses.
  -4, --ipv4-addresses  Display IPv4 addresses.
  -6, --ipv6-addresses  Display IPv6 addresses.
  -l, --local           Display loopback interfaces and local addresses.
Example:
$ netgraph -4
graph {
  node [fontsize=11 fontname=monospace margin=0];
  edge [fontsize=11 fontname=monospace margin=0];
  graph [fontsize=11 fontname=monospace compound=true style=dotted];

  _enp1s0 [tooltip="lladdr 52:54:00:71:c4:d3\ninet6 fe80::5054:ff:fe71:c4d3/64" color=gray shape=oval label=<<b>enp1s0</b><br/><font color="gray">virtio_net</font><br/><font color="gray">bus 0000:01:00.0</font><br/><font color="purple">192.168.122.233/24</font>>];
  _br_phy [tooltip="forward_delay 1500\nhello_time 200\nmax_age 2000\nageing_time 30000\nstp_state 0\npriority 32768\nvlan_filtering 1\nvlan_protocol 802.1Q\nbridge_id 8000.76:eb:ec:34:f1:b\nroot_id 8000.76:eb:ec:34:f1:b\nroot_port 0\nroot_path_cost 0\ntopology_change 0\ntopology_change_detected 0\nhello_timer 0.0\ntcn_timer 0.0\ntopology_change_timer 0.0\ngc_timer 297.74\nvlan_default_pvid 1\nvlan_stats_enabled 0\nvlan_stats_per_port 0\ngroup_fwd_mask 0\ngroup_addr 01:80:c2:00:00:00\nmcast_snooping 1\nmcast_vlan_snooping 0\nmcast_router 1\nmcast_query_use_ifaddr 0\nmcast_querier 0\nmcast_hash_elasticity 16\nmcast_hash_max 4096\nmcast_last_member_cnt 2\nmcast_startup_query_cnt 2\nmcast_last_member_intvl 100\nmcast_membership_intvl 26000\nmcast_querier_intvl 25500\nmcast_query_intvl 12500\nmcast_query_response_intvl 1000\nmcast_startup_query_intvl 3125\nmcast_stats_enabled 0\nmcast_igmp_version 2\nmcast_mld_version 1\nnf_call_iptables 0\nnf_call_ip6tables 0\nnf_call_arptables 0\nlladdr 76:eb:ec:34:f1:0b\ninet6 fe80::84f6:42ff:fe8a:5475/64" color=red shape=octagon label=<<b>br-phy</b><br/><font color="red">bridge</font>>];
  _p0 [tooltip="lladdr da:79:60:12:ef:fd\ninet6 fe80::d879:60ff:fe12:effd/64" color=blue shape=oval label=<<b>p0</b><br/><font color="blue">veth</font>>];
  _p1 [tooltip="lladdr 76:eb:ec:34:f1:0b\ninet6 fe80::74eb:ecff:fe34:f10b/64" color=blue shape=oval label=<<b>p1</b><br/><font color="blue">veth</font>>];

  subgraph compute1 {
    label="netns compute1";
    cluster=true;

    compute1_tenants [tooltip="protocol 802.1Q\nid 404\nflags ['REORDER_HDR']\nlladdr 72:83:c0:3f:a4:c0\ninet6 fe80::7083:c0ff:fe3f:a4c0/64" color=green shape=rectangle margin=0.05 label=<<b>tenants</b><br/><font color="green">vlan</font><br/><font color="green">id 404</font><br/><font color="purple">172.16.13.1/24</font>>];
    compute1_br_internal [tooltip="forward_delay 1500\nhello_time 200\nmax_age 2000\nageing_time 30000\nstp_state 0\npriority 32768\nvlan_filtering 1\nvlan_protocol 802.1Q\nbridge_id 8000.2:91:de:e7:ba:a4\nroot_id 8000.2:91:de:e7:ba:a4\nroot_port 0\nroot_path_cost 0\ntopology_change 0\ntopology_change_detected 0\nhello_timer 0.0\ntcn_timer 0.0\ntopology_change_timer 0.0\ngc_timer 297.74\nvlan_default_pvid 1\nvlan_stats_enabled 0\nvlan_stats_per_port 0\ngroup_fwd_mask 0\ngroup_addr 01:80:c2:00:00:00\nmcast_snooping 1\nmcast_vlan_snooping 0\nmcast_router 1\nmcast_query_use_ifaddr 0\nmcast_querier 0\nmcast_hash_elasticity 16\nmcast_hash_max 4096\nmcast_last_member_cnt 2\nmcast_startup_query_cnt 2\nmcast_last_member_intvl 100\nmcast_membership_intvl 26000\nmcast_querier_intvl 25500\nmcast_query_intvl 12500\nmcast_query_response_intvl 1000\nmcast_startup_query_intvl 3125\nmcast_stats_enabled 0\nmcast_igmp_version 2\nmcast_mld_version 1\nnf_call_iptables 0\nnf_call_ip6tables 0\nnf_call_arptables 0\nlladdr 02:91:de:e7:ba:a4\ninet6 fe80::2040:9bff:feb1:efbd/64" color=red shape=octagon label=<<b>br-internal</b><br/><font color="red">bridge</font>>];
    compute1_vx_internal [tooltip="id 1337\ngroup 239.0.13.37\nlink tenants\nport_range {'low': 0, 'high': 0}\nport 4789\nlearning True\nttl 5\ndf unset\nageing 300\nudp_csum True\nudp_zero_csum6_tx False\nudp_zero_csum6_rx False\nlladdr 02:91:de:e7:ba:a4\ninet6 fe80::91:deff:fee7:baa4/64" color=darkgreen shape=rectangle margin=0.05 label=<<b>vx-internal</b><br/><font color="darkgreen">vxlan</font><br/><font color="darkgreen">id 1337</font><br/><font color="darkgreen">group 239.0.13.37</font>>];
    compute1_br_external [tooltip="forward_delay 1500\nhello_time 200\nmax_age 2000\nageing_time 30000\nstp_state 0\npriority 32768\nvlan_filtering 1\nvlan_protocol 802.1Q\nbridge_id 8000.22:19:24:60:46:42\nroot_id 8000.22:19:24:60:46:42\nroot_port 0\nroot_path_cost 0\ntopology_change 0\ntopology_change_detected 0\nhello_timer 0.0\ntcn_timer 0.0\ntopology_change_timer 0.0\ngc_timer 68.36\nvlan_default_pvid 1\nvlan_stats_enabled 0\nvlan_stats_per_port 0\ngroup_fwd_mask 0\ngroup_addr 01:80:c2:00:00:00\nmcast_snooping 1\nmcast_vlan_snooping 0\nmcast_router 1\nmcast_query_use_ifaddr 0\nmcast_querier 0\nmcast_hash_elasticity 16\nmcast_hash_max 4096\nmcast_last_member_cnt 2\nmcast_startup_query_cnt 2\nmcast_last_member_intvl 100\nmcast_membership_intvl 26000\nmcast_querier_intvl 25500\nmcast_query_intvl 12500\nmcast_query_response_intvl 1000\nmcast_startup_query_intvl 3125\nmcast_stats_enabled 0\nmcast_igmp_version 2\nmcast_mld_version 1\nnf_call_iptables 0\nnf_call_ip6tables 0\nnf_call_arptables 0\nlladdr 22:19:24:60:46:42\ninet6 fe80::843a:6eff:fe60:7450/64" color=red shape=octagon label=<<b>br-external</b><br/><font color="red">bridge</font>>];
    compute1_external [tooltip="protocol 802.1Q\nid 407\nflags ['REORDER_HDR']\nlladdr 72:83:c0:3f:a4:c0\ninet6 fe80::7083:c0ff:fe3f:a4c0/64" color=green shape=rectangle margin=0.05 label=<<b>external</b><br/><font color="green">vlan</font><br/><font color="green">id 407</font>>];
    compute1_phy0 [tooltip="lladdr 72:83:c0:3f:a4:c0\ninet6 fe80::7083:c0ff:fe3f:a4c0/64" color=blue shape=oval label=<<b>phy0</b><br/><font color="blue">veth</font>>];
    compute1_vm1 [tooltip="lladdr 66:33:b0:e4:1f:ee\ninet6 fe80::6433:b0ff:fee4:1fee/64" color=blue shape=oval label=<<b>vm1</b><br/><font color="blue">veth</font>>];
    compute1_vm2 [tooltip="lladdr ea:52:34:41:78:a1\ninet6 fe80::e852:34ff:fe41:78a1/64" color=blue shape=oval label=<<b>vm2</b><br/><font color="blue">veth</font>>];
    compute1_vm6 [tooltip="lladdr 22:19:24:60:46:42\ninet6 fe80::2019:24ff:fe60:4642/64" color=blue shape=oval label=<<b>vm6</b><br/><font color="blue">veth</font>>];
  }

  subgraph guest1 {
    label="netns guest1";
    cluster=true;

    guest1_guest1 [tooltip="lladdr 9a:2e:e8:af:41:29\ninet6 fe80::982e:e8ff:feaf:4129/64" color=blue shape=oval label=<<b>guest1</b><br/><font color="blue">veth</font><br/><font color="purple">10.16.0.1/24</font>>];
  }

  subgraph guest2 {
    label="netns guest2";
    cluster=true;

    guest2_guest2 [tooltip="lladdr ce:68:e5:98:e3:e9\ninet6 fe80::cc68:e5ff:fe98:e3e9/64" color=blue shape=oval label=<<b>guest2</b><br/><font color="blue">veth</font><br/><font color="purple">10.16.0.2/24</font>>];
  }

  subgraph guest6 {
    label="netns guest6";
    cluster=true;

    guest6_guest6 [tooltip="lladdr d6:e9:38:49:be:72\ninet6 fe80::d4e9:38ff:fe49:be72/64" color=blue shape=oval label=<<b>guest6</b><br/><font color="blue">veth</font><br/><font color="purple">10.99.0.6/24</font>>];
  }

  subgraph compute2 {
    label="netns compute2";
    cluster=true;

    compute2_tenants [tooltip="protocol 802.1Q\nid 404\nflags ['REORDER_HDR']\nlladdr 6e:63:91:74:1d:33\ninet6 fe80::6c63:91ff:fe74:1d33/64" color=green shape=rectangle margin=0.05 label=<<b>tenants</b><br/><font color="green">vlan</font><br/><font color="green">id 404</font><br/><font color="purple">172.16.13.2/24</font>>];
    compute2_br_internal [tooltip="forward_delay 1500\nhello_time 200\nmax_age 2000\nageing_time 30000\nstp_state 0\npriority 32768\nvlan_filtering 1\nvlan_protocol 802.1Q\nbridge_id 8000.52:31:2a:dc:63:fc\nroot_id 8000.52:31:2a:dc:63:fc\nroot_port 0\nroot_path_cost 0\ntopology_change 0\ntopology_change_detected 0\nhello_timer 0.0\ntcn_timer 0.0\ntopology_change_timer 0.0\ngc_timer 297.72\nvlan_default_pvid 1\nvlan_stats_enabled 0\nvlan_stats_per_port 0\ngroup_fwd_mask 0\ngroup_addr 01:80:c2:00:00:00\nmcast_snooping 1\nmcast_vlan_snooping 0\nmcast_router 1\nmcast_query_use_ifaddr 0\nmcast_querier 0\nmcast_hash_elasticity 16\nmcast_hash_max 4096\nmcast_last_member_cnt 2\nmcast_startup_query_cnt 2\nmcast_last_member_intvl 100\nmcast_membership_intvl 26000\nmcast_querier_intvl 25500\nmcast_query_intvl 12500\nmcast_query_response_intvl 1000\nmcast_startup_query_intvl 3125\nmcast_stats_enabled 0\nmcast_igmp_version 2\nmcast_mld_version 1\nnf_call_iptables 0\nnf_call_ip6tables 0\nnf_call_arptables 0\nlladdr 52:31:2a:dc:63:fc\ninet6 fe80::d0ef:d6ff:fe39:a863/64" color=red shape=octagon label=<<b>br-internal</b><br/><font color="red">bridge</font>>];
    compute2_vx_internal [tooltip="id 1337\ngroup 239.0.13.37\nlink tenants\nport_range {'low': 0, 'high': 0}\nport 4789\nlearning True\nttl 5\ndf unset\nageing 300\nudp_csum True\nudp_zero_csum6_tx False\nudp_zero_csum6_rx False\nlladdr aa:67:73:6c:36:51\ninet6 fe80::a867:73ff:fe6c:3651/64" color=darkgreen shape=rectangle margin=0.05 label=<<b>vx-internal</b><br/><font color="darkgreen">vxlan</font><br/><font color="darkgreen">id 1337</font><br/><font color="darkgreen">group 239.0.13.37</font>>];
    compute2_br_external [tooltip="forward_delay 1500\nhello_time 200\nmax_age 2000\nageing_time 30000\nstp_state 0\npriority 32768\nvlan_filtering 1\nvlan_protocol 802.1Q\nbridge_id 8000.6e:63:91:74:1d:33\nroot_id 8000.6e:63:91:74:1d:33\nroot_port 0\nroot_path_cost 0\ntopology_change 0\ntopology_change_detected 0\nhello_timer 0.0\ntcn_timer 0.0\ntopology_change_timer 0.0\ngc_timer 68.34\nvlan_default_pvid 1\nvlan_stats_enabled 0\nvlan_stats_per_port 0\ngroup_fwd_mask 0\ngroup_addr 01:80:c2:00:00:00\nmcast_snooping 1\nmcast_vlan_snooping 0\nmcast_router 1\nmcast_query_use_ifaddr 0\nmcast_querier 0\nmcast_hash_elasticity 16\nmcast_hash_max 4096\nmcast_last_member_cnt 2\nmcast_startup_query_cnt 2\nmcast_last_member_intvl 100\nmcast_membership_intvl 26000\nmcast_querier_intvl 25500\nmcast_query_intvl 12500\nmcast_query_response_intvl 1000\nmcast_startup_query_intvl 3125\nmcast_stats_enabled 0\nmcast_igmp_version 2\nmcast_mld_version 1\nnf_call_iptables 0\nnf_call_ip6tables 0\nnf_call_arptables 0\nlladdr 6e:63:91:74:1d:33\ninet6 fe80::fc92:fbff:feaf:cca/64" color=red shape=octagon label=<<b>br-external</b><br/><font color="red">bridge</font>>];
    compute2_external [tooltip="protocol 802.1Q\nid 407\nflags ['REORDER_HDR']\nlladdr 6e:63:91:74:1d:33\ninet6 fe80::6c63:91ff:fe74:1d33/64" color=green shape=rectangle margin=0.05 label=<<b>external</b><br/><font color="green">vlan</font><br/><font color="green">id 407</font>>];
    compute2_phy1 [tooltip="lladdr 6e:63:91:74:1d:33\ninet6 fe80::6c63:91ff:fe74:1d33/64" color=blue shape=oval label=<<b>phy1</b><br/><font color="blue">veth</font>>];
    compute2_vm3 [tooltip="lladdr c2:bb:13:b5:bd:13\ninet6 fe80::c0bb:13ff:feb5:bd13/64" color=blue shape=oval label=<<b>vm3</b><br/><font color="blue">veth</font>>];
    compute2_vm4 [tooltip="lladdr 52:31:2a:dc:63:fc\ninet6 fe80::5031:2aff:fedc:63fc/64" color=blue shape=oval label=<<b>vm4</b><br/><font color="blue">veth</font>>];
    compute2_vm5 [tooltip="lladdr ca:96:fe:af:60:15\ninet6 fe80::c896:feff:feaf:6015/64" color=blue shape=oval label=<<b>vm5</b><br/><font color="blue">veth</font>>];
  }

  subgraph guest3 {
    label="netns guest3";
    cluster=true;

    guest3_guest3 [tooltip="lladdr aa:81:ae:0a:39:ae\ninet6 fe80::a881:aeff:fe0a:39ae/64" color=blue shape=oval label=<<b>guest3</b><br/><font color="blue">veth</font><br/><font color="purple">10.16.0.3/24</font>>];
  }

  subgraph guest4 {
    label="netns guest4";
    cluster=true;

    guest4_guest4 [tooltip="lladdr 52:cb:9e:13:35:08\ninet6 fe80::50cb:9eff:fe13:3508/64" color=blue shape=oval label=<<b>guest4</b><br/><font color="blue">veth</font><br/><font color="purple">10.16.0.4/24</font>>];
  }

  subgraph guest5 {
    label="netns guest5";
    cluster=true;

    guest5_guest5 [tooltip="lladdr 92:41:c2:96:15:99\ninet6 fe80::9041:c2ff:fe96:1599/64" color=blue shape=oval label=<<b>guest5</b><br/><font color="blue">veth</font><br/><font color="purple">10.99.0.5/24</font>>];
  }

  _p0 -- _br_phy [label="VLAN\n400-409"];
  _p1 -- _br_phy [label="VLAN\n400-409"];
  compute1_vx_internal -- compute1_br_internal;
  compute1_external -- compute1_br_external;
  compute1_vm1 -- compute1_br_internal;
  compute1_vm2 -- compute1_br_internal;
  compute1_vm6 -- compute1_br_external;
  compute2_vx_internal -- compute2_br_internal;
  compute2_external -- compute2_br_external;
  compute2_vm3 -- compute2_br_internal;
  compute2_vm4 -- compute2_br_internal;
  compute2_vm5 -- compute2_br_external;
  compute1_tenants -- compute1_phy0 [style=dashed];
  compute1_vx_internal -- compute1_tenants [style=dashed];
  compute1_external -- compute1_phy0 [style=dashed];
  compute1_phy0 -- _p0 [style=dashed];
  guest1_guest1 -- compute1_vm1 [style=dashed];
  guest2_guest2 -- compute1_vm2 [style=dashed];
  guest6_guest6 -- compute1_vm6 [style=dashed];
  compute2_tenants -- compute2_phy1 [style=dashed];
  compute2_vx_internal -- compute2_tenants [style=dashed];
  compute2_external -- compute2_phy1 [style=dashed];
  compute2_phy1 -- _p1 [style=dashed];
  guest3_guest3 -- compute2_vm3 [style=dashed];
  guest4_guest4 -- compute2_vm4 [style=dashed];
  guest5_guest5 -- compute2_vm5 [style=dashed];

  {
    rank=sink cluster=false;
    _enp1s0;
    _br_phy;
  }
}
Here is the result after piping this output to dot:
procstat
usage: procstat [-h] [-r ROOT] [-e] PID [PID ...]

Display process statistics: CPU/NUMA affinity, context switches (voluntary and
non-voluntary) and thread names.

positional arguments:
  PID                   Process ID for which to display statistics.

options:
  -h, --help            show this help message and exit
  -r ROOT, --root ROOT  Root dir used to determine path to /proc (default /).
  -e, --exact           Display exact stats values.
Examples:
$ procstat $(pidof br)
PID     CPUs        NUMAs  NONVOL_CTX_SW  VOL_CTX_SW  COMM
113182  6           0               1.0K       19.5K  br
113183  7-19,26-39  0                  3          25  dpdk-intr
113184  7-19,26-39  0                  0           1  dpdk-telemet-v2
113196  7           0                  1        1.0M  datapath-7
113200  27          0                  1        997K  datapath-27
113202  8           0                  2        991K  datapath-8
113204  28          0                  1        981K  datapath-28
113206  9           0                  1        998K  datapath-9
113208  29          0                  1        991K  datapath-29
113210  10          0                  1        982K  datapath-10
113212  30          0                  1        974K  datapath-30
$ procstat -e $(pidof sway)
PID     CPUs  NUMAs  NONVOL_CTX_SW  VOL_CTX_SW  COMM
161335  0-7   0              12601     1672692  sway
161455  0-7   0                  0           1  sway:disk$0
161456  0-7   0                  0           3  sway:sh0
161457  0-7   0                  0           2  sway:traceq0
161458  0-7   0                  0           1  sway:gdrv0
161459  0-7   0                  0           1  sway:disk$0
161460  0-7   0                  0           1  sway:sh0
systar
usage: systar [-h] [-v] [-f FILE] PATH [PATH ...]

Create gzipped tar archives of sysfs devfs folders. Properly handling file
sizes without errors.

positional arguments:
  PATH                  Path to include into archive (folder contents are
                        included recursively).

options:
  -h, --help            show this help message and exit
  -v, --verbose         Print files and dirs on stderr as they are included in
                        the archive.
  -f FILE, --file FILE  Output file to create. By default, gzipped tar archive
                        is written to stdout.
Example:
$ tar -zcvf cpu-topo.tgz /sys/devices/system/cpu/cpu*/topology
/sys/devices/system/cpu/cpu0/topology/
/sys/devices/system/cpu/cpu0/topology/cluster_cpus
tar: /sys/devices/system/cpu/cpu0/topology/cluster_cpus: File shrank by 4093 bytes; padding with zeros
/sys/devices/system/cpu/cpu0/topology/die_id
tar: /sys/devices/system/cpu/cpu0/topology/die_id: File shrank by 4094 bytes; padding with zeros
/sys/devices/system/cpu/cpu0/topology/cluster_cpus_list
tar: /sys/devices/system/cpu/cpu0/topology/cluster_cpus_list: File shrank by 28668 bytes; padding with zeros
/sys/devices/system/cpu/cpu0/topology/physical_package_id
tar: /sys/devices/system/cpu/cpu0/topology/physical_package_id: File shrank by 4094 bytes; padding with zeros
...
$ echo $?
1
$ sysstat -vf cpu-topo.tgz /sys/devices/system/cpu/cpu*/topology
/sys/devices/system/cpu/cpu0/topology/cluster_cpus
/sys/devices/system/cpu/cpu0/topology/die_id
/sys/devices/system/cpu/cpu0/topology/cluster_cpus_list
/sys/devices/system/cpu/cpu0/topology/physical_package_id
/sys/devices/system/cpu/cpu0/topology/core_cpus_list
/sys/devices/system/cpu/cpu0/topology/die_cpus_list
...
$ tar -tf cpu-topo.tgz
sys/devices/system/cpu/cpu0/topology/cluster_cpus
sys/devices/system/cpu/cpu0/topology/die_id
sys/devices/system/cpu/cpu0/topology/cluster_cpus_list
sys/devices/system/cpu/cpu0/topology/physical_package_id
sys/devices/system/cpu/cpu0/topology/core_cpus_list
sys/devices/system/cpu/cpu0/topology/die_cpus_list
...
Development
Send questions, bug reports and patches to ~rjarry/public-inbox@lists.sr.ht.
git clone https://git.sr.ht/~rjarry/linux-tools
cd linux-tools
git config format.subjectPrefix "PATCH linux-tools"
git config sendemail.to "~rjarry/public-inbox@lists.sr.ht"
Release history Release notifications | RSS feed


Download files
Download the file for your platform. If you're not sure which to choose, learn more about installing packages.
Source Distribution
linux_tools-0.6.0.tar.gz
(23.8 kB
view details)
Built Distribution
Filter files by name, interpreter, ABI, and platform.
If you're not sure about the file name format, learn more about wheel file names.
Copy a direct link to the current filters
File details
Details for the file linux_tools-0.6.0.tar.gz.
File metadata
- Download URL: linux_tools-0.6.0.tar.gz
- Upload date:
- Size: 23.8 kB
- Tags: Source
- Uploaded using Trusted Publishing? No
- Uploaded via: twine/4.0.2 CPython/3.12.3
File hashes
| Algorithm | Hash digest | |
|---|---|---|
| SHA256 |
1b1b34a7b1ffaeddc596adb5cf3dee1a9bdd09a0a82bab592db9b7952bf841d5
|
|
| MD5 |
399d51bc213daa4d64f489a6f09537b4
|
|
| BLAKE2b-256 |
020d44cfeb77ea8aabf94820c948b38093193d93e6b65165eaed01255650a573
|
File details
Details for the file linux_tools-0.6.0-py3-none-any.whl.
File metadata
- Download URL: linux_tools-0.6.0-py3-none-any.whl
- Upload date:
- Size: 20.3 kB
- Tags: Python 3
- Uploaded using Trusted Publishing? No
- Uploaded via: twine/4.0.2 CPython/3.12.3
File hashes
| Algorithm | Hash digest | |
|---|---|---|
| SHA256 |
db3347d523310f0fd178ddd61045deb22ca663470a2c2532afd46f5d51ff9b58
|
|
| MD5 |
b9dcf0871deef42bbf0bc37f37b56b02
|
|
| BLAKE2b-256 |
97fa8743b6b51caa710f7a04047fc03cfa1a12c0a8dedf97c275e607e20f12f4
|


