
llamastat
nvtop for llama.cpp: a zero-infrastructure terminal dashboard for llama-server inference. Point it at a running server and watch slots, throughput, and context usage live.
Why llamastat?
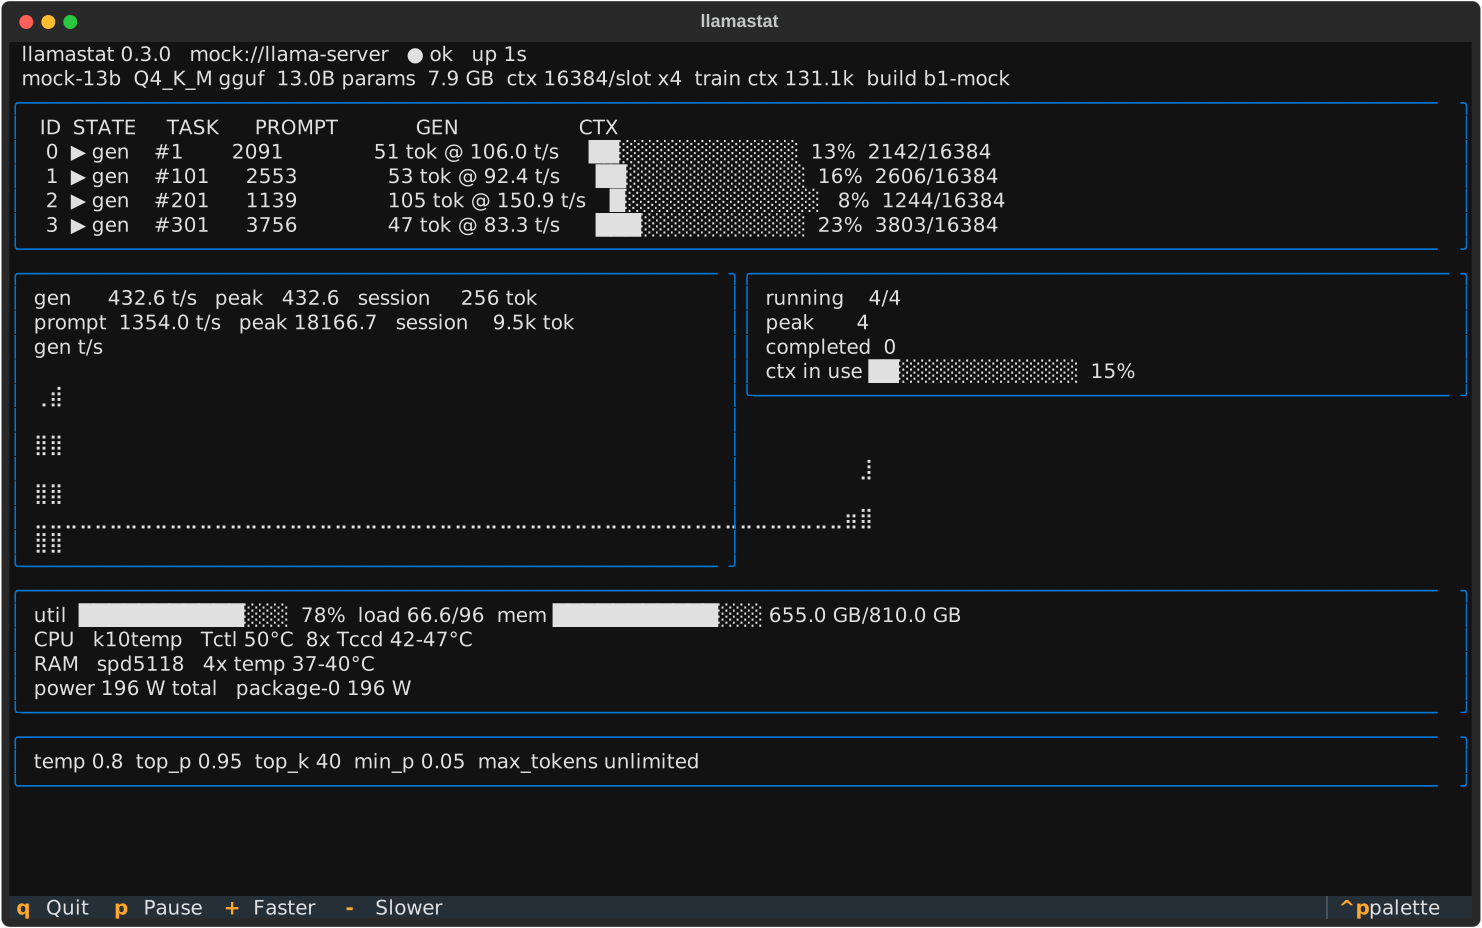
llama-server tells you what it is doing, but only in raw JSON. llamastat turns that into a live picture:
- Per-slot activity: which slots are processing prompts, which are generating, and how full each context window is.
- Throughput without
--metrics: llamastat diffs slot token counters between polls, so you get generation and prompt tokens/s even on servers started without the Prometheus endpoint. - Zero infrastructure: no Prometheus, no Grafana, no agents. One
pip install, one command, works over any HTTP reachable server (including an SSH port-forward to a production box). - Degrades gracefully: if the server flaps, is still loading the model, or has
/slotsdisabled, llamastat shows what it can instead of crashing.
Sibling project: vllmstat does the same for vLLM.
Install
pip install llamastat
Usage
llamastat                          # local server on the default port
llamastat -u http://host:8080      # remote server
llamastat -u http://host:8080 -i 0.5
llamastat --once --json            # one snapshot as JSON, for scripting
llamastat --mock                   # synthetic data, no server needed
Key bindings
| Key | Action |
|---|---|
q |
Quit |
p |
Pause/resume polling |
+ |
Poll faster (halve interval, min 0.1s) |
- |
Poll slower (double interval, max 10s) |
Flags
| Flag | Default | Meaning |
|---|---|---|
-u, --url |
http://localhost:8080 |
llama-server base URL |
-i, --interval |
1.0 |
poll interval in seconds |
--api-key |
$LLAMACPP_API_KEY |
bearer token for servers started with --api-key |
--metrics-path |
/metrics |
Prometheus metrics path |
--no-host |
off | disable local host sensors (hwmon temps, RAPL power) |
--once |
off | poll once, print, exit |
--json |
off | with --once, print machine-readable JSON |
--mock |
off | run against synthetic data |
What it shows
- Header: model alias, quantization, parameter count, file size, context per slot, training context, server build, health.
- Slots: one row per slot with phase (
prompt/gen/idle), task id, prompt progress, generated tokens, per-slot tokens/s, and a context-usage bar. - Throughput: EWMA generation and prompt tokens/s with session peaks and totals, plus a braille history plot.
- Requests: running/peak concurrency, completed tasks, aggregate context in use.
- Host sensors (Linux, when llamastat runs on the inference box itself): aggregate CPU utilization bar with load average, RAM usage, and CPU, RAM, motherboard, NVMe, and GPU temperatures from hwmon, grouped per chip, plus power draw from hwmon sensors and RAPL package counters. The CPU bar reflects the whole machine, so standalone tools like
llama-benchshow up here even though they never touch llama-server. RAPL wattage is derived by diffing the energy counters between polls. On hardened kernelsenergy_ujis root-only; runsudo chmod a+r /sys/class/powercap/intel-rapl*/energy_uj(or run llamastat as root) to expose package power, and llamastat will say so in the panel. Disable everything with--no-host. - Server metrics: when the server was started with
--metrics, llamastat also shows the server-side Prometheus counters (total tokens, deferred requests, context high-water mark, busy slots per decode). The panel hides itself otherwise. - Sampling defaults: temperature, top_p, top_k, min_p, max_tokens from
/props.
llamastat only issues read-only GET requests (/health, /slots, /props, /v1/models, and optionally /metrics), so it is safe to point at a production server.
Requirements
- Python 3.10+
- A llama.cpp
llama-servernew enough to expose/slots(enabled by default; some deployments disable it, in which case llamastat falls back to header and metrics panels)
Development
git clone https://github.com/bryanvine/llamastat
cd llamastat
pip install -e ".[dev]"
pytest -q
See CONTRIBUTING.md.
License
Apache-2.0. See LICENSE.
1 maintainer

Download files
Download the file for your platform. If you're not sure which to choose, learn more about installing packages.
Source Distribution
Built Distribution
Filter files by name, interpreter, ABI, and platform.
If you're not sure about the file name format, learn more about wheel file names.
Copy a direct link to the current filters
File details
Details for the file llamastat-0.3.0.tar.gz.
File metadata
- Download URL: llamastat-0.3.0.tar.gz
- Upload date:
- Size: 35.9 kB
- Tags: Source
- Uploaded using Trusted Publishing? No
- Uploaded via: twine/7.0.0 CPython/3.12.3
File hashes
| Algorithm | Hash digest | |
|---|---|---|
| SHA256 |
6e18658019d239aba42ab6ceab11bfa4f751d973fbf40943fb55e089764d3312
|
|
| MD5 |
bae0d70a4e5e923e08d0e5dc8b8d45f4
|
|
| BLAKE2b-256 |
bb8dee02ac02166539ea807d3c5fb06c0ca217033d39078485897b332a12a2d9
|
File details
Details for the file llamastat-0.3.0-py3-none-any.whl.
File metadata
- Download URL: llamastat-0.3.0-py3-none-any.whl
- Upload date:
- Size: 29.1 kB
- Tags: Python 3
- Uploaded using Trusted Publishing? No
- Uploaded via: twine/7.0.0 CPython/3.12.3
File hashes
| Algorithm | Hash digest | |
|---|---|---|
| SHA256 |
91aab69a7dffd155c0d401a910fdb49dd469d6a80662bb2b153b2c0f7cedaced
|
|
| MD5 |
3cea0c13b126f6da6457ef3ef7efaa9d
|
|
| BLAKE2b-256 |
da1ba997811b9a58c55129e435c775ac381a6cf938e204c7ac396ba29e3d9264
|







