
llmperfscope



Tells you what limits an LLM engine, where its memory goes, and how its data moves between disk, RAM, CPU and GPU, over its whole life: load, warmup, prefill, decode, serving and shutdown.
It works with any engine and needs no code changes. Put it in front of the command you already run:
pip install llmperfscope
llmperfscope run -- llama-bench -m model.gguf -ngl 0 -lm mmap
Here is a 0.6 GiB model on the CPU with 450 MiB of RAM, from a real run:
## What limits each phase

| phase  | limit | confidence | why                                                                                                       |
|--------|-------|------------|-----------------------------------------------------------------------------------------------------------|
| decode | ram   | high       | Host RAM is short: 333 MiB/s of file pages dropped and read again, tasks stalled on memory 13% of the time. |

## Data movement findings

- **warning**: 18.79 GiB read from disk and 49,217 major page faults during decode. The weights or cache are not staying in RAM:
  evicted pages, mmap of tensors used on the CPU, or an engine offloading to disk.
- Load read 0.64 GiB from sda (hdd) at 878 MiB/s; 0% of the model was cached before the run.
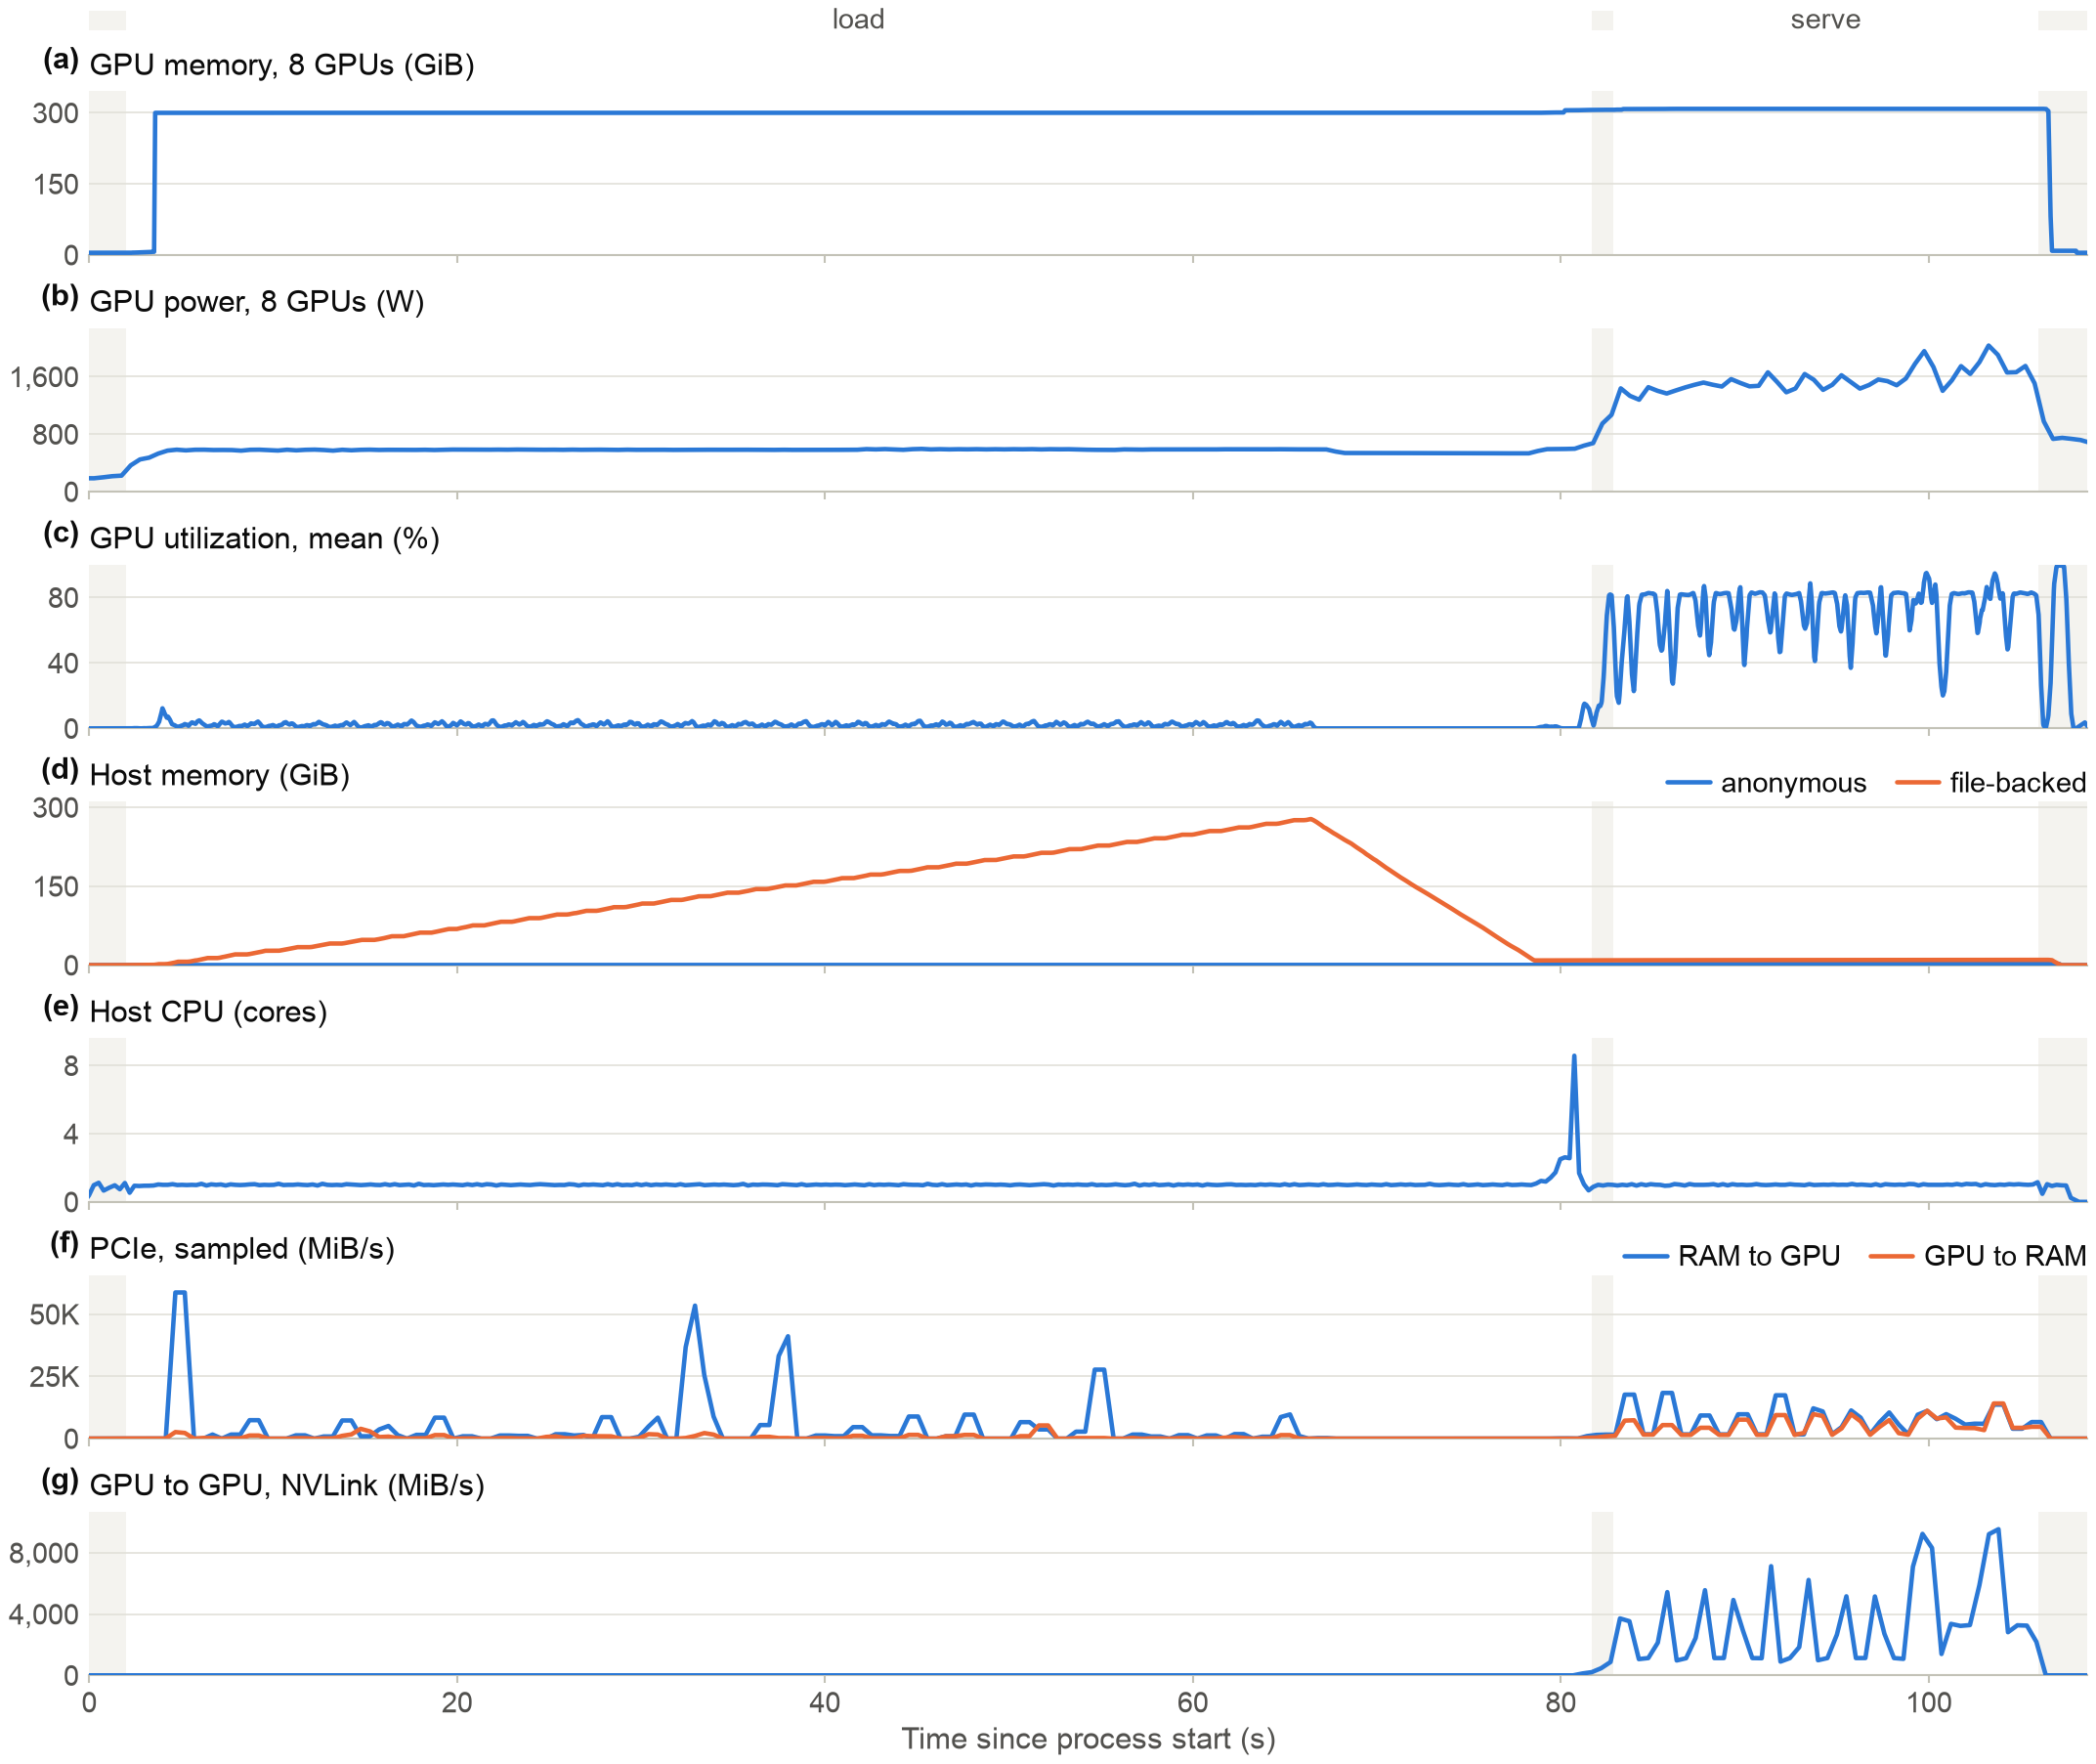
Each run also writes report.html with every counter on one time axis, run.json with all the numbers, and, on request, figures ready for a paper:
Install
pip install llmperfscope               # no dependencies
pip install "llmperfscope[figures]"    # adds matplotlib, for paper figures
llmperfscope check                     # what can be measured on this machine
Measuring needs Linux or macOS and Python 3.9 or newer. GPU telemetry needs an NVIDIA driver on Linux, and nothing extra on Apple Silicon; without a GPU you still get phases, host memory, CPU and disk. A C compiler is needed only for --cpu-profile.
Use it with your engine
Servers are started, loaded, stopped and measured in one command. llmperfscope finds the port, waits until the server is ready, sends streaming requests and reads its metrics.
llmperfscope serve -- llama-server -m model.gguf -ngl 99
llmperfscope serve -- vllm serve Qwen/Qwen3-0.6B
llmperfscope serve -- python -m sglang.launch_server --model-path Qwen/Qwen3-0.6B
llmperfscope serve -- text-generation-launcher --model-id Qwen/Qwen3-0.6B
llmperfscope serve --model qwen2.5:0.5b --pull -- ollama serve

# Containers work the same way. llmperfscope follows the engine inside, not the docker client.
llmperfscope serve -- docker run --gpus all -p 8000:8000 vllm/vllm-openai --model Qwen/Qwen3-0.6B
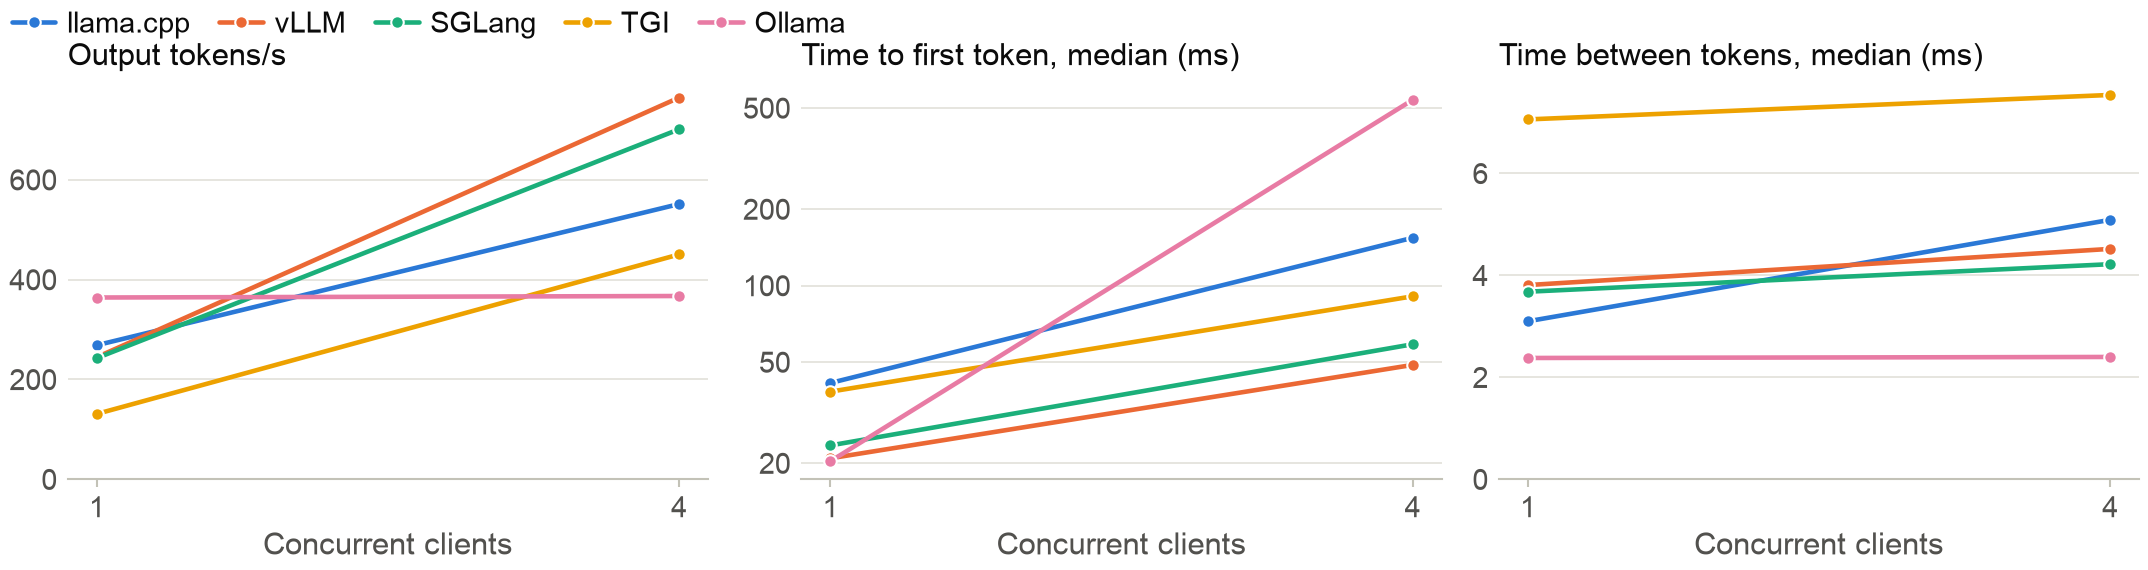
Choose the load with --prompts mix (public real prompts in several languages and lengths) or --prompts file.jsonl, --concurrency 1,4,8 and --max-tokens 64. Any other OpenAI-compatible server works with --preset openai --url http://host:port, and something already running with llmperfscope attach.
An engine used as a library takes a wrapper and, optionally, a few markers. They do nothing when no profiler is running:
import llmperfscope

with llmperfscope.phase("load"):
    model = AutoModelForCausalLM.from_pretrained(name, device_map="auto")

timer = llmperfscope.TokenTimer()
with llmperfscope.phase("decode", tokens=128):
    model.generate(**inputs, max_new_tokens=128, streamer=timer)
print(timer.summary())
llmperfscope run -- python script.py
Any other program can mark phases from any language, with no dependency:
llmperfscope run --mark 'Model loaded=decode' -- my-engine        # a line in its output starts a phase
echo decode >> "$LLMPERFSCOPE_MARKERS"                            # or append to this file
Tested end to end with llama.cpp (llama-bench, llama-server), vLLM 0.32.0 (server and library), SGLang 0.5.22, Text Generation Inference 3.3.7, Ollama 0.40.9 and transformers. See the engine notes.
What it answers
What limits this phase? Each phase gets one verdict with the numbers behind it: gpu, gpu (throttled), gpu imbalance, gpu + host wait, cpu (one thread), cpu (many threads), cpu contention, disk (nvme|ssd|hdd), ram. It rests on the kernel's pressure stall counters, GPU utilization history, per-thread CPU time and disk activity. A phase too short for these counters is reported as too short.
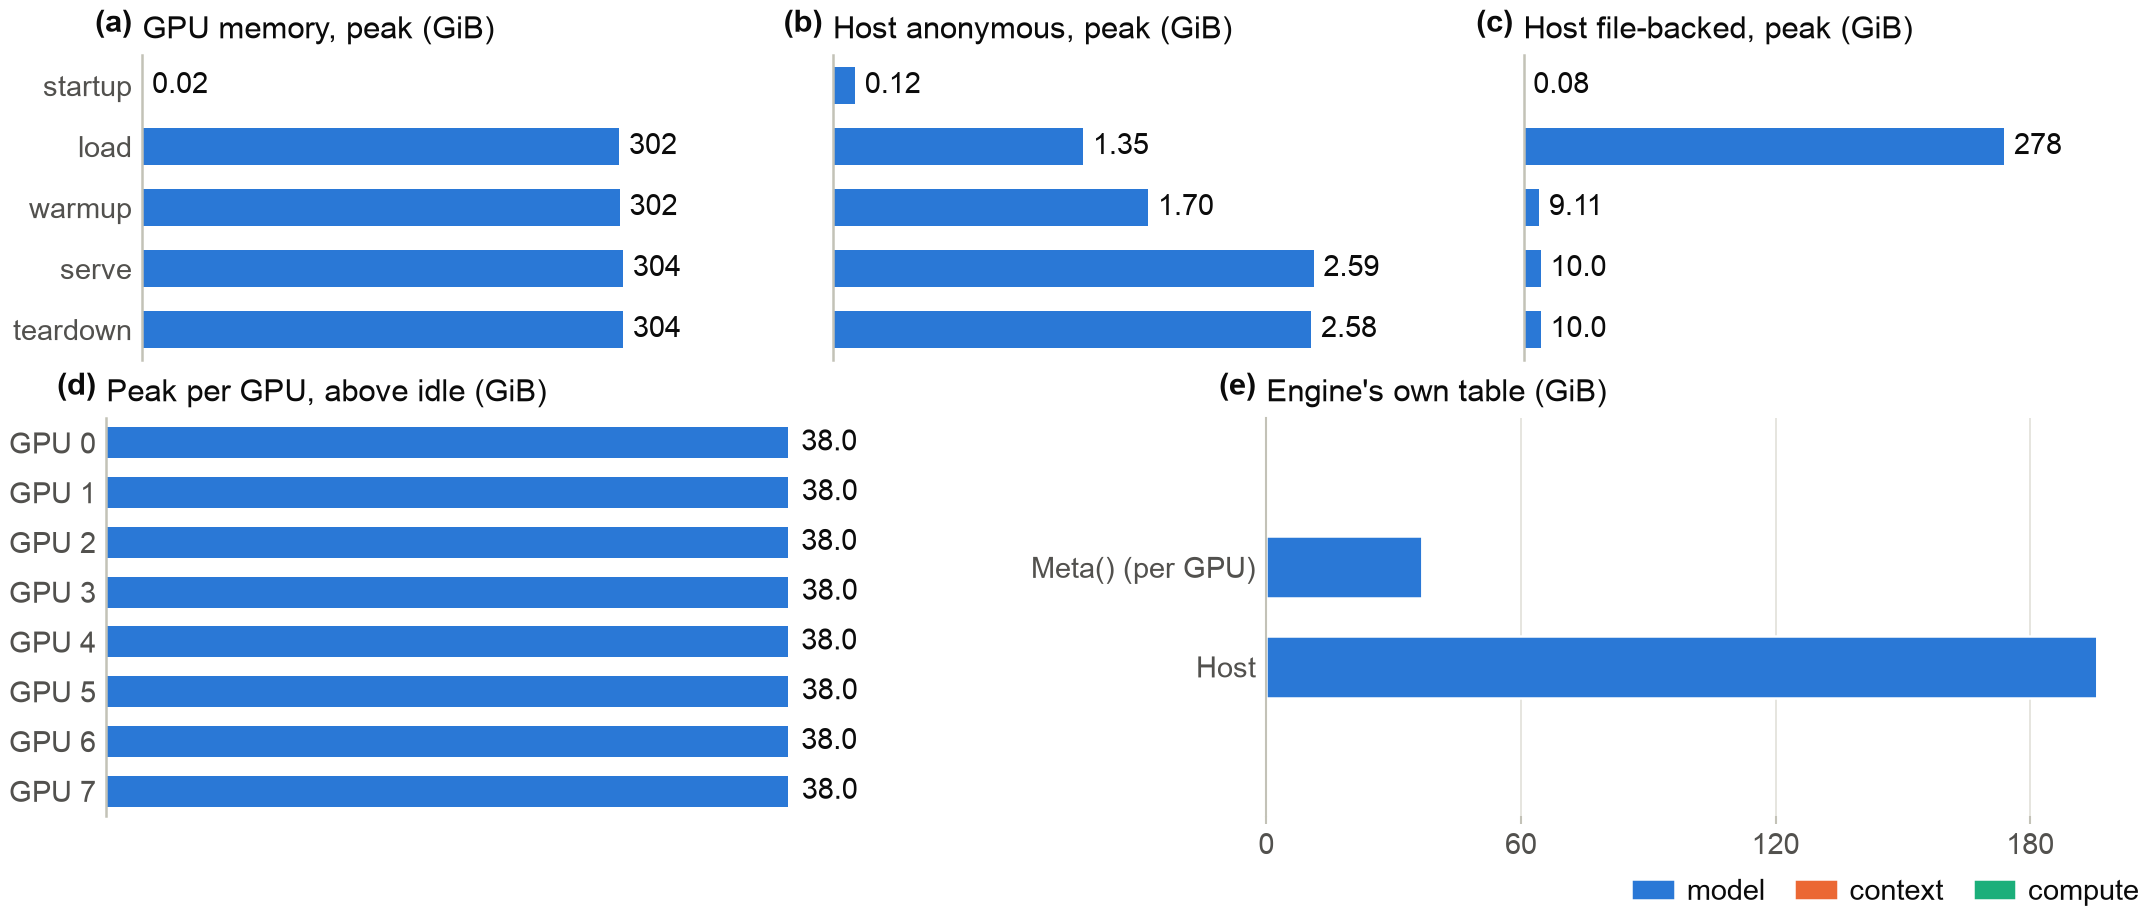
Is memory being overused? llmperfscope reports GPU memory per device and per process, host memory split into anonymous and file-backed, swap, and the engine's own breakdown where it gives one. It flags:
- a GPU or the host running out of headroom
- a transient peak that decides what fits
- host memory that keeps growing, as a leak would
- weights held in RAM next to their GPU copy
- PyTorch reserving far more than its tensors use, and cache pools that are mostly unused
- GPUs filled unevenly
Where does data travel? Per phase: bytes read and written per disk, with NVMe, SSD and HDD told apart; swap in and out; page cache changes and refaults; major page faults; RAM to GPU and back over PCIe; GPU to GPU over NVLink. Reads from disk during inference are flagged, because they mean the weights are not staying in RAM. --cold-start drops the model from the page cache first, without root, so a load can be measured as a user's first run would see it.
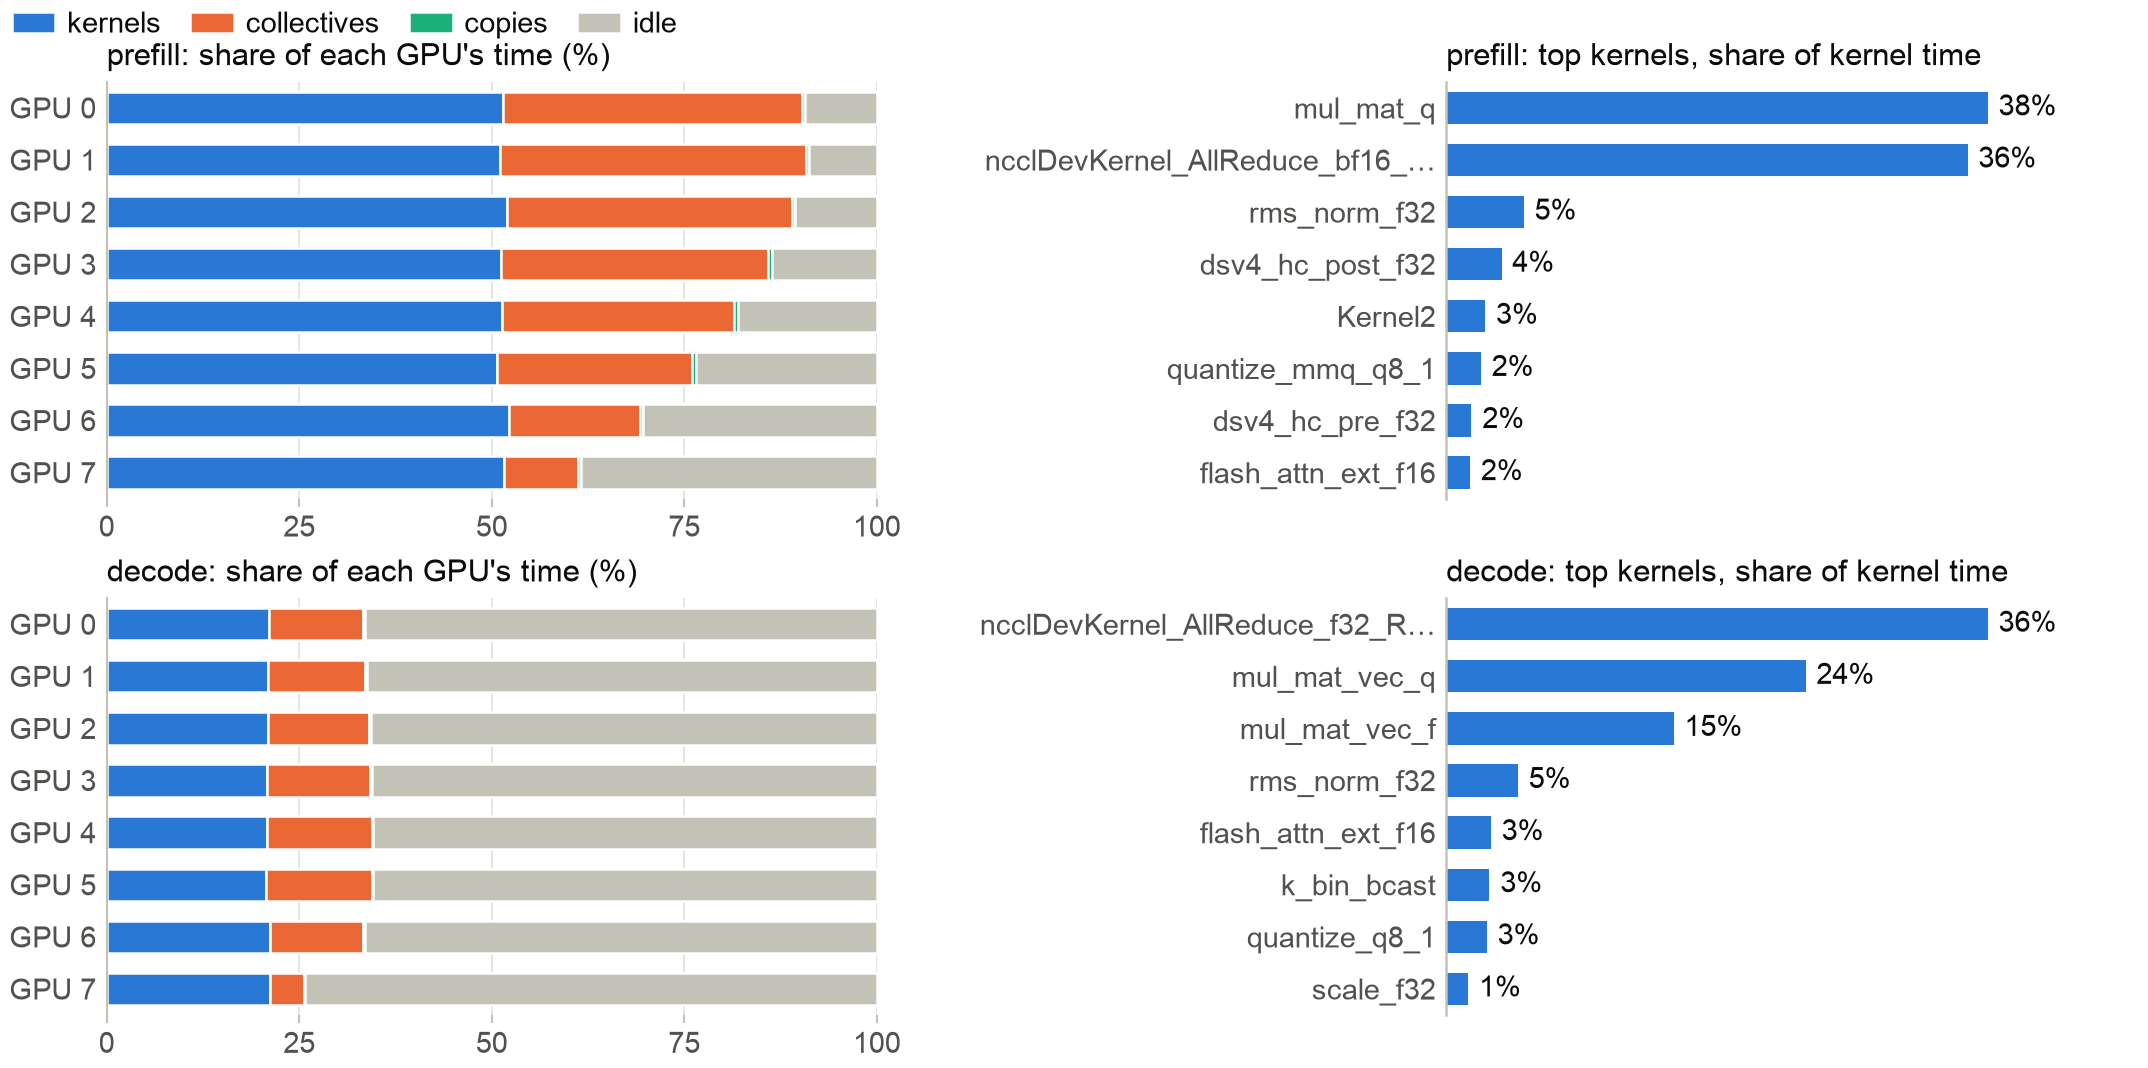
Where does the GPU's time go, and which kernel is worth speeding up? Add --nsys for kernels, collectives, copies and idle gaps per phase and per token, the host's time in CUDA calls, and exact bytes copied. llmperfscope kernels then lists each kernel's share of a token and the most it could win. Add --cpu-profile for the hot functions of the host threads. It samples from inside the process, so it works where perf is not allowed. Both slow the engine down, so those runs are marked and never counted as speed results.
What did a change cost? llmperfscope matrix runs two builds in alternating order across many cases, in fresh processes, re-checking the machine before each arm. It judges speed, memory, load time and energy together, so a speed win that costs memory shows up as a regression. A difference counts only if the arms do not overlap and it exceeds the noise floor, and a case that looks worse is run again before anything is called worse. Measure that floor with the same binary on both sides.
llmperfscope matrix --cases cases.json --a old=build-old/bin --b new=build-new/bin --out res
Figures for papers
llmperfscope figure RUN_DIR --width single --print-safe --out figures
You get vector PDF with embedded TrueType fonts, editable SVG, 300 dpi PNG, the data behind each figure as CSV, and a suggested caption with the numbers filled in. Widths match common paper layouts, colors stay distinct under color vision deficiency, and the same run gives byte-identical PDF and SVG. llmperfscope anonymize makes a copy of a run with no host names or paths, to publish with the paper.
 |
 |
 |
 |
See every figure and how to fit it to your venue. The runs behind these are in the repository, so you can try it with no GPU.
Trusting the numbers
-
The tool's own cost is measured. Sampling happens in another process, pinned away from the engine's CPUs when it can be. Speed with llmperfscope against without it, alternating fresh processes, 4 arms each of 10 repetitions, on 8 RTX A6000 (the same binary against itself varies by about 1% at 8 GPUs):
Case Prefill Decode Qwen3-30B-A3B Q8_0, 1 GPU 1.00 1.00 Qwen3-30B-A3B Q8_0, 8 GPUs, tensor split 0.998 1.000 DeepSeek-V4.1-Flash, 8 GPUs, tensor split 1.001 1.001 -
Every run checks itself. Phase times are compared with the engine's own timers where it has them; it was 1.000 to 1.001 in the runs above. Power from the energy counter is compared with the power gauge, because the counter was caught under-reporting by half when read too often; llmperfscope reads it about twice a second, and a large disagreement is called out in the report.
-
Known answers. The RAM-limited run above took decode from 73.9 to 2.5 tokens/s, and the report named
ram. GPU memory from NVML matched llama.cpp's own table to within driver overhead. GPU kernel times matched a separately written analysis of the same trace. -
Every run stores its context. That means foreign CPU and GPU load, the page cache state of the model, the storage it lives on, binary hashes, the git commit and relevant environment variables. Runs on a busy machine are flagged, and
--precheck waitwaits for it to go quiet. -
Hung runs stop. A collective that spins forever looks busy to every utilization counter, so progress means output or resource changes. A stalled run is killed with a report of what its threads were doing.
-
Credentials stay out. Tokens and keys in the command line and environment are never written to the report.
The test suite runs real processes with known behaviour and checks that the report says what happened: cd tests && python3 -m unittest. See how it was validated, including the mistakes it has already made.
Limits
- Measuring works on Linux and macOS. GPU telemetry covers NVIDIA and Apple Silicon for now (other vendors can plug in); without it you still get host metrics and phases.
- On a Mac,
--nsysand--cpu-profileare not available, GPU memory is machine-wide, and GPU energy and clock come from undocumented counters. Apple Silicon has the details. - GPU hardware counters such as cache hit rates need admin rights (
RmProfilingAdminOnly=0). llmperfscope does not read them yet. - Memory bandwidth on the host is not visible without privileges.
- PCIe traffic is a sample, not a count. Use
--nsysfor exact copy bytes. - System-wide counters (disks, swap, pressure) include other processes. On a shared machine, trust the per-process columns.
- NVML's GPU utilization needs about a second to mean anything, which is why short phases are not judged.
Documentation
| Quickstart | install, first run, which command to use |
| Engines | llama.cpp, vLLM, SGLang, TGI, Ollama, transformers, containers, any other program |
| Reading a report | every verdict and finding, and what to do about it |
| Figures | paper figures, sizes, fonts, captions, checklist |
| Comparing | A/B runs, noise floors, what counts as a real difference |
| Going deeper | --nsys, --cpu-profile, --cold-start |
| What the model's structure tells you | experts, KV cache, attention, speculation, prompt cache: which number is about which |
| Run data | run.json, samples and requests, for your own analysis |
| Adding an engine | presets, adapters, GPU backends |
| Validation | overhead, known answers, limits |
Citing
If llmperfscope helps your work, please cite it. GitHub's "Cite this repository" button gives BibTeX from CITATION.cff.
License
Apache-2.0
1 maintainer

Metadata
1 maintainer
Release files for llmperfscope 0.2.0
For a detailed explanation of source distributions (sdists) and built distributions (wheels), please see the package formats documentation.
Source distribution (sdist)
| File | Size | Uploaded | Provenance | Actions |
|---|---|---|---|---|
| llmperfscope-0.2.0.tar.gz | 235.3 kB | With provenance | Details for llmperfscope-0.2.0.tar.gz |
Built distribution (wheel)
| File | Interpreter | ABI | Platform | Actions Reset |
|---|---|---|---|---|
| llmperfscope-0.2.0-py3-none-any.whl | Python 3 | none | any | Details for llmperfscope-0.2.0-py3-none-any.whl |
Total release size: 401.2 kB
Release files / llmperfscope-0.2.0.tar.gz
| Download URL | llmperfscope-0.2.0.tar.gz |
|---|---|
| Size | 235.3 kB |
| Tags | Source |
|
SHA-256 checksum How to use checksums |
1c4216742e4bf9766bedd74b2aa01ddae154444ff03d732264d8023edc7bd566
|
|
BLAKE2b-256 checksum How to use checksums |
2c35c00c36cc984412fa90f71f67b43d4567b161b526f224d2ec22bb61b2e672
|
| Upload date | |
|
Uploaded using Trusted Publishing? What is trusted publishing? |
Yes |
| Uploaded via |
twine/7.0.0 CPython/3.13.14
|
Provenance
Provenance describes where a file came from. On PyPI, provenance is shared via attestations, which provide a verifiable record of the build or publishing details. View details, limitations and caveats.


PyPI Publish Attestation
PyPI verified that this artifact, at this checksum, originated from the publisher listed below.
Signed by GitHub Actions, verified by PyPI on Nov 3, 2026.
Transparency logRelease files / llmperfscope-0.2.0-py3-none-any.whl
| Download URL | llmperfscope-0.2.0-py3-none-any.whl |
|---|---|
| Size | 165.9 kB |
| Tags | Python 3 |
|
SHA-256 checksum How to use checksums |
bd4b36ced3606d56821bb386cdca9355883a53e231046e3bac2b0df525082aba
|
|
BLAKE2b-256 checksum How to use checksums |
9a3d2c125a9c553c0796e04b419ba277b3ab9a52bd748ecb0b809ad97a35b08a
|
| Upload date | |
|
Uploaded using Trusted Publishing? What is trusted publishing? |
Yes |
| Uploaded via |
twine/7.0.0 CPython/3.13.14
|
Provenance
Provenance describes where a file came from. On PyPI, provenance is shared via attestations, which provide a verifiable record of the build or publishing details. View details, limitations and caveats.
PyPI Publish Attestation
PyPI verified that this artifact, at this checksum, originated from the publisher listed below.
Signed by GitHub Actions, verified by PyPI on Nov 3, 2026.
Transparency logSecurity for llmperfscope 0.2.0
Provenance
Provenance describes where a file came from. On PyPI, provenance is shared via attestations, which provide a verifiable record of the build or publishing details. View details, limitations and caveats.
Full provenance
All 2 files in this release have been uploaded with provenance metadata.
Attestation for llmperfscope-0.2.0.tar.gz
PyPI Publish Attestation
PyPI verified that this artifact, at this checksum, originated from the publisher listed below.
Signed by GitHub Actions, verified by PyPI on Nov 3, 2026.
Transparency logA note on package security
PyPI is a repository for distributing packages, not a service for auditing them. While third-party security researchers and our staff do their best to detect and remove malicious packages, PyPI cannot guarantee the quality, security or suitability of any given package.
To learn more about protecting yourself from malicious actors, visit our package security documentation.














