





loadcast
A synthetic multi-carrier industrial energy demand generator
import loadcast

profiles = loadcast.generate(
    annual_mwh=10_000,
    heat_to_cold=7.4,        # this site wants 7.4x more heat than cold
    elec_share=0.20,         # a fifth of its energy is electricity
    process_class="semi_continuous",   # weekday shifts, weekend trough
    carrier_correlation=0.75,          # how tightly the carriers move together
    carrier_lag_h={"cold": 6},         # cold demand trails heat by six hours
)
Returns an 8760-row hourly or quarter-hourly frame of heat_kw, cold_kw and elec_kw.
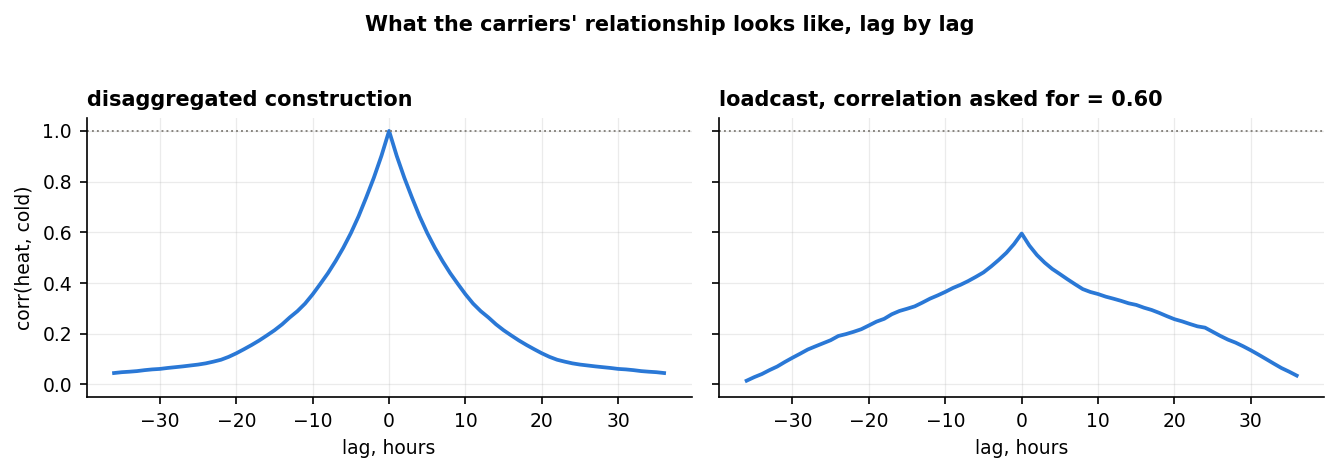
Left: every carrier as a fixed multiple of one shared profile, the construction behind published
disaggregated data, which is correlated at 1 by algebra. Right: loadcast with carrier_correlation=0.60.
More in the tutorial notebook.
Why
Designing anything with storage against an industrial site needs to know not just how much of each carrier the site wants, but whether it wants them at the same hours. A store exists to bridge the gap when it does not.
Existing sources cannot answer that question:
| source | approach | industrial | coincidence controllable? |
|---|---|---|---|
| demandlib / BDEW SLP | deterministic step profiles | yes | no — deterministic |
| RAMP | bottom-up from appliances | no | no — emerges from user schedules |
| LoadProfileGenerator | behavioural simulation | no | no |
| EnTiSe | framework, pluggable methods | partly | no — pipeline dependency |
| JERICHO-E-usage | disaggregated national totals | yes | no — fixed at 1.000 |
The disaggregated datasets build every carrier as a fixed scalar times one shared profile, $P_m(t) = \kappa_m p(t)$, under which the correlation between any two carriers is identically 1 — an artefact of the construction, not a measurement. Feeding that into a storage study builds the answer into the question.
loadcast makes the relationship an input you set and sweep.
What you specify
Things you can answer from a site visit or an energy bill, not things the mathematics wants:
| input | meaning |
|---|---|
annual_mwh |
total annual energy across all carriers |
heat_to_cold |
ratio of annual heat to annual cold |
elec_share |
electricity as a fraction of the total |
process_class |
continuous, semi-continuous, campaign or batch |
carrier_correlation |
how tightly carriers move together, at peak alignment |
carrier_lag_h |
hours by which a carrier trails the others |
The four process classes are calibrated on metered industrial sites. If none fits yours, build one from your own statistics:
from loadcast import class_from_observations, register_class

mine = class_from_observations(
    "my_plant", load_factor=0.45, cv=0.60, lag1=0.90,
    calendar_from="semi_continuous",
)
register_class(mine)
profiles = loadcast.generate(process_class="my_plant", annual_mwh=5_000)
The inversion from observables to generator parameters is closed form. See mathematics for details.
What it guarantees exactly
Not approximately, but to floating-point:
- annual energy equals
annual_mwh - the heat:cold ratio equals
heat_to_cold - the electricity share equals
elec_share - the load factor equals the process class's, via the capacity cap fixed point
- every value is strictly positive
Diagnostics
loadcast.summary_table(profiles)                       # the four scalars
loadcast.duration_curve(profiles["heat_kw"])           # load duration curve
loadcast.cross_correlogram(profiles["heat_kw"], profiles["cold_kw"])
loadcast.integrated_drift(profiles["heat_kw"], profiles["cold_kw"], window_h=24)
Read the correlogram's peak position, not only its height. A lag and a weak coupling are indistinguishable from the contemporaneous correlation alone: as carriers are offset, the lag-0 correlation decays towards the floor the shared calendar imposes, exactly where a small correlation would also put it.
integrated_drift is the quantity a store actually responds to. A buffer does
not sample a mismatch, it integrates one, so what sizes it is the area under the
mismatch autocovariance over the storage window — correlation is a single point
of that picture.
What it deliberately does not do
- No temperature. It carries energy by carrier. Whether a machine can reach a given process is a separate question, answered from the machine's own limits.
- No claim about your site. Parameters are yours to choose; defaults are indicative values with a stated provenance, not predictions. Results are meant to be reported as they hold across a swept space, not at one assumed point.
- No cold validation. No site in the calibration archive meters refrigeration. The cold carrier's annual quantity is whatever you specify; its shape rests on the same calendar and correlation assumptions as the others, and nothing independent confirms it. Every cold result carries this.
Install
pip install loadcast
Requires Python 3.9+, numpy and pandas. Nothing else.
Documentation
A detailed documentation of the library is available at: https://loadcast.readthedocs.io/en/latest/
Refer to that documentation for usage instructions and examples and details of the method.
Calibration data
The process classes are calibrated on metered industrial sites that cannot be redistributed. What ships is the derived statistics and calendar factors — group means carrying no identifying information. The raw series are not part of this repository.
Contributing
Issues and pull requests are welcome — see CONTRIBUTING.md for scope, what a test looks like here, and support expectations. Reports that the generated profiles disagree with a real site you have measured are especially welcome: the calibration archive is small, and that is the package's main limitation.
This project follows the Contributor Covenant. Generative AI was used in building it; see AI_USAGE.md.
Citing
Use the "Cite this repository" button, or CITATION.cff. Each release is
archived on Zenodo with a DOI.
Licence
MIT — see LICENSE. Changes are recorded in CHANGELOG.md.
1 maintainer

Metadata
1 maintainer
Release files for loadcast 0.1.2
For a detailed explanation of source distributions (sdists) and built distributions (wheels), please see the package formats documentation.
Source distribution (sdist)
| File | Size | Uploaded | |
|---|---|---|---|
| loadcast-0.1.2.tar.gz | 1.9 MB | Details |
Built distribution (wheel)
| File | Interpreter | ABI | Platform | Reset |
|---|---|---|---|---|
| loadcast-0.1.2-py3-none-any.whl | Python 3 | none | any | Details |
Total release size: 2.0 MB
Release files / loadcast-0.1.2.tar.gz
| Download URL | loadcast-0.1.2.tar.gz |
|---|---|
| Size | 1.9 MB |
| Tags | Source |
|
SHA-256 checksum How to use checksums |
d36b9a7b919ac1a3b26f63deae72048755c5b30c2a584da1089385a3a5a9ee05
|
|
BLAKE2b-256 checksum How to use checksums |
349e0bbabc94fbc87610ed283f7a77ec0b45d9a8d4104bc9044b4480ccf5c693
|
| Upload date | |
|
Uploaded using Trusted Publishing? What is trusted publishing? |
Yes |
| Uploaded via |
twine/7.0.0 CPython/3.13.14
|
Provenance
Provenance describes where a file came from. On PyPI, provenance is shared via attestations, which provide a verifiable record of the build or publishing details. View details, limitations and caveats.


PyPI Publish Attestation
PyPI verified that this artifact, at this checksum, originated from the publisher listed below.
Signed by GitHub Actions, verified by PyPI on Oct 9, 2026.
Transparency logRelease files / loadcast-0.1.2-py3-none-any.whl
| Download URL | loadcast-0.1.2-py3-none-any.whl |
|---|---|
| Size | 33.1 kB |
| Tags | Python 3 |
|
SHA-256 checksum How to use checksums |
4ec5952359a3387b3ca287f0849636098ba810bdf08ca3f26ba2f4d206c2521a
|
|
BLAKE2b-256 checksum How to use checksums |
1a010f0a5f4e27e58ae7d92b4188e4429417eeab67f0e7c2f1b0490ae239926a
|
| Upload date | |
|
Uploaded using Trusted Publishing? What is trusted publishing? |
Yes |
| Uploaded via |
twine/7.0.0 CPython/3.13.14
|
Provenance
Provenance describes where a file came from. On PyPI, provenance is shared via attestations, which provide a verifiable record of the build or publishing details. View details, limitations and caveats.
PyPI Publish Attestation
PyPI verified that this artifact, at this checksum, originated from the publisher listed below.
Signed by GitHub Actions, verified by PyPI on Oct 9, 2026.
Transparency log













