A Locust plugin to log load test metrics to observability tools (DB-free).
Verified details
These details have been verified by PyPIProject links
GitHub Statistics
Maintainers

Project description
Locust Telemetry


Locust Telemetry is a modular observability plugin for the Locust load-testing framework.
It emits structured telemetry from load tests so you can correlate request behavior with system metrics using modern observability tools.
📖 Full documentation: https://locust-telemetry.readthedocs.io/en/latest/index.html
Why Locust Telemetry?
Load testing is most effective when request-level metrics can be correlated with system signals like CPU, memory, network usage, and errors.
Locust Telemetry bridges this gap by exporting structured telemetry that integrates cleanly with existing observability stacks.
Key Features
-
Structured Telemetry Test lifecycle events, request metrics, and system metrics
-
Multiple Backends JSON logs or OpenTelemetry metrics
-
OpenTelemetry Native OTLP export to Prometheus, Grafana, Datadog, New Relic, and more
-
Distributed Support Works with Locust master–worker mode
-
Extensible Design Add custom recorders and instruments
Traces and spans are planned but not yet supported.
Installation
pip install locust-telemetry
Quick Start
1. Initialize the plugin
In your locustfile.py:
from locust_telemetry import entrypoint

entrypoint.initialize()
2. Run Locust with telemetry enabled
JSON telemetry (logs):
locust -f locustfile.py --testplan mytest --enable-telemetry-recorder json
OpenTelemetry metrics:
locust -f locustfile.py --testplan mytest --enable-telemetry-recorder otel
➡️ See the Configuration section in the docs for all available options.
Local Demo (Docker)
A complete local observability stack is provided to quickly try both JSON and OpenTelemetry telemetry:
git clone https://github.com/platform-crew/locust-telemetry.git
cd locust-telemetry/examples/local
make build && make up
- Locust UI: http://localhost:8089
- Grafana: http://localhost:3000
📘 Full walkthrough: https://locust-telemetry.readthedocs.io/en/latest/examples.html
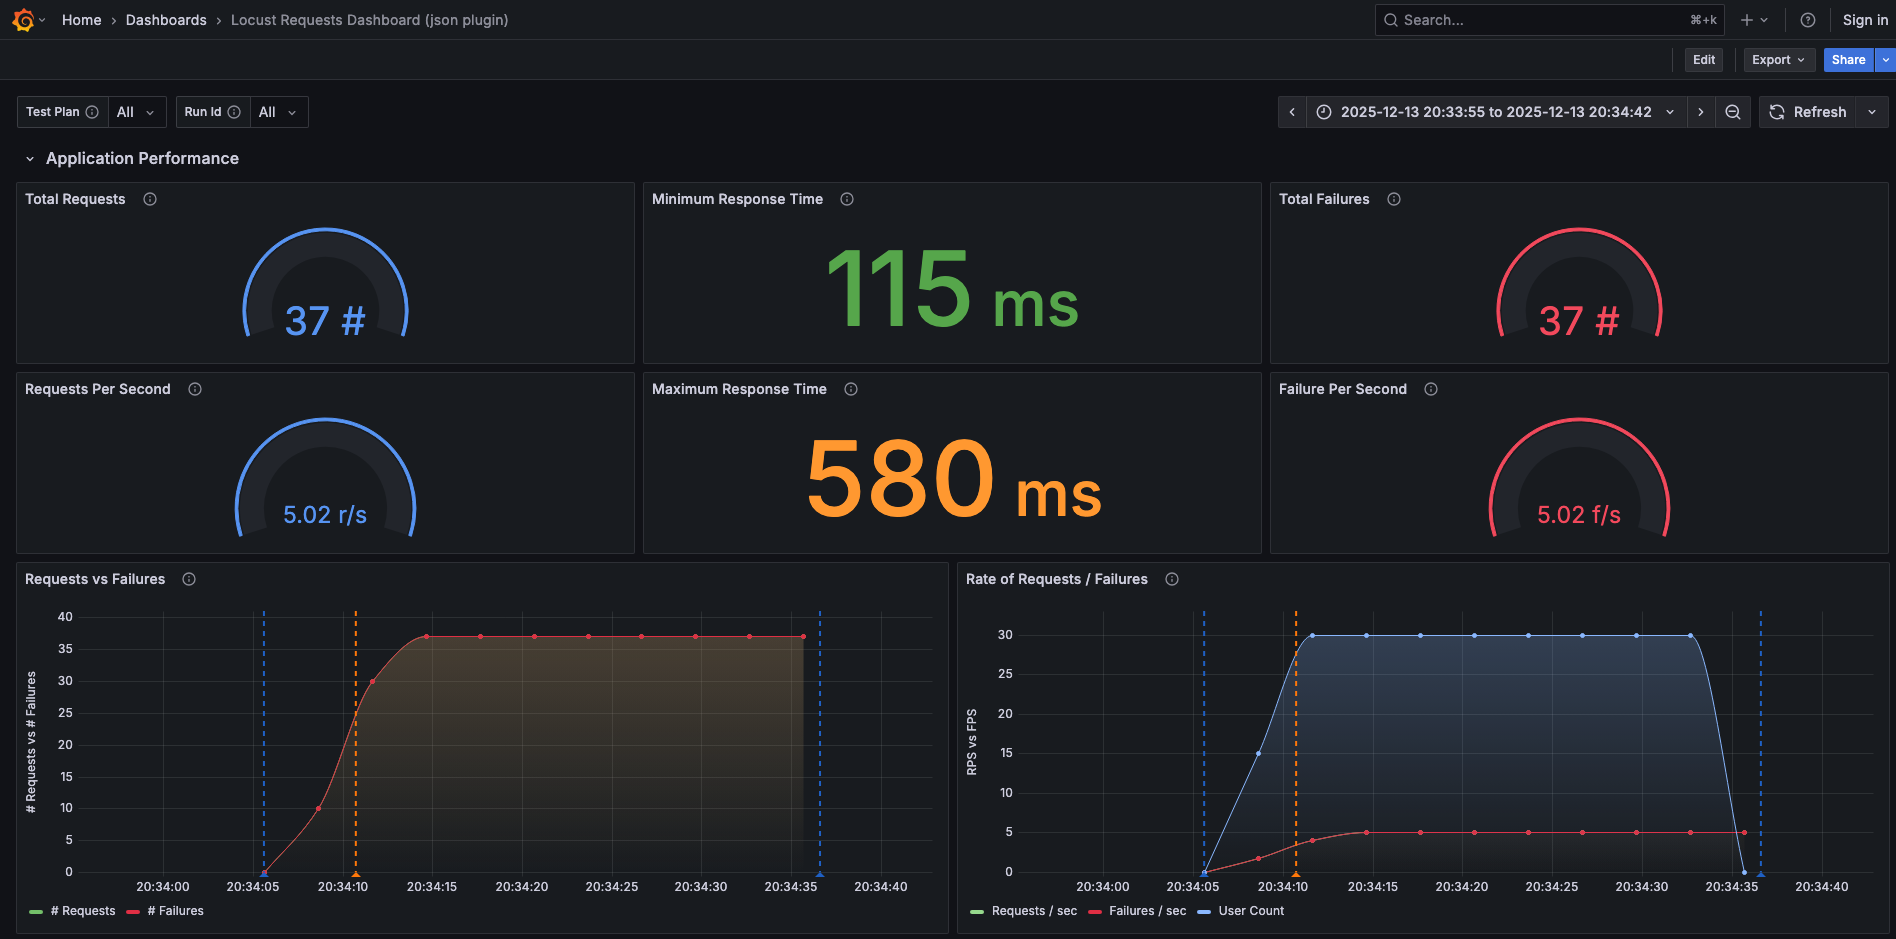
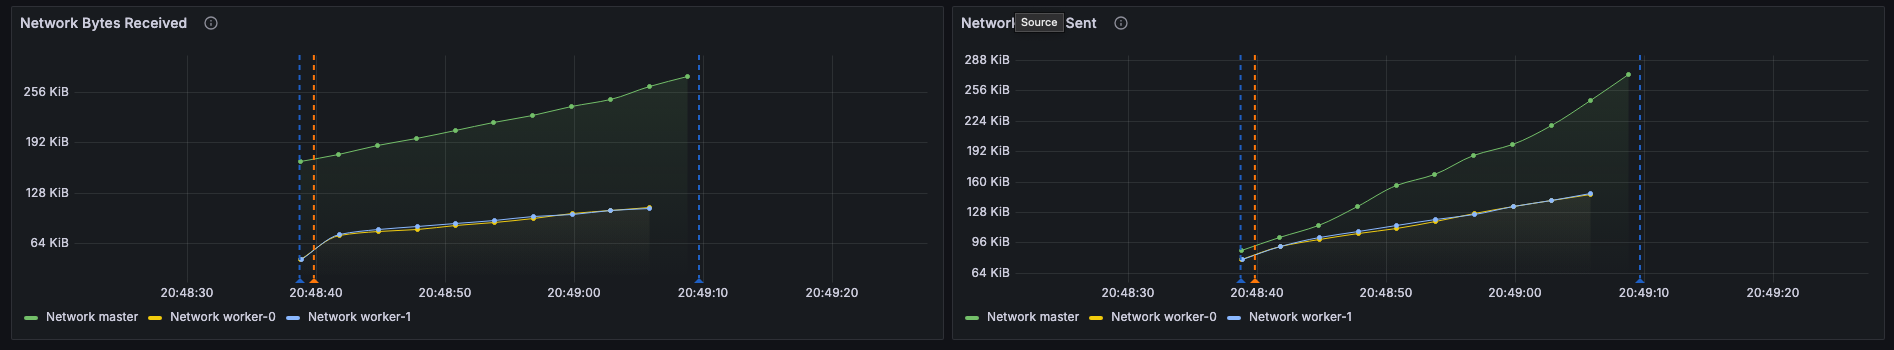
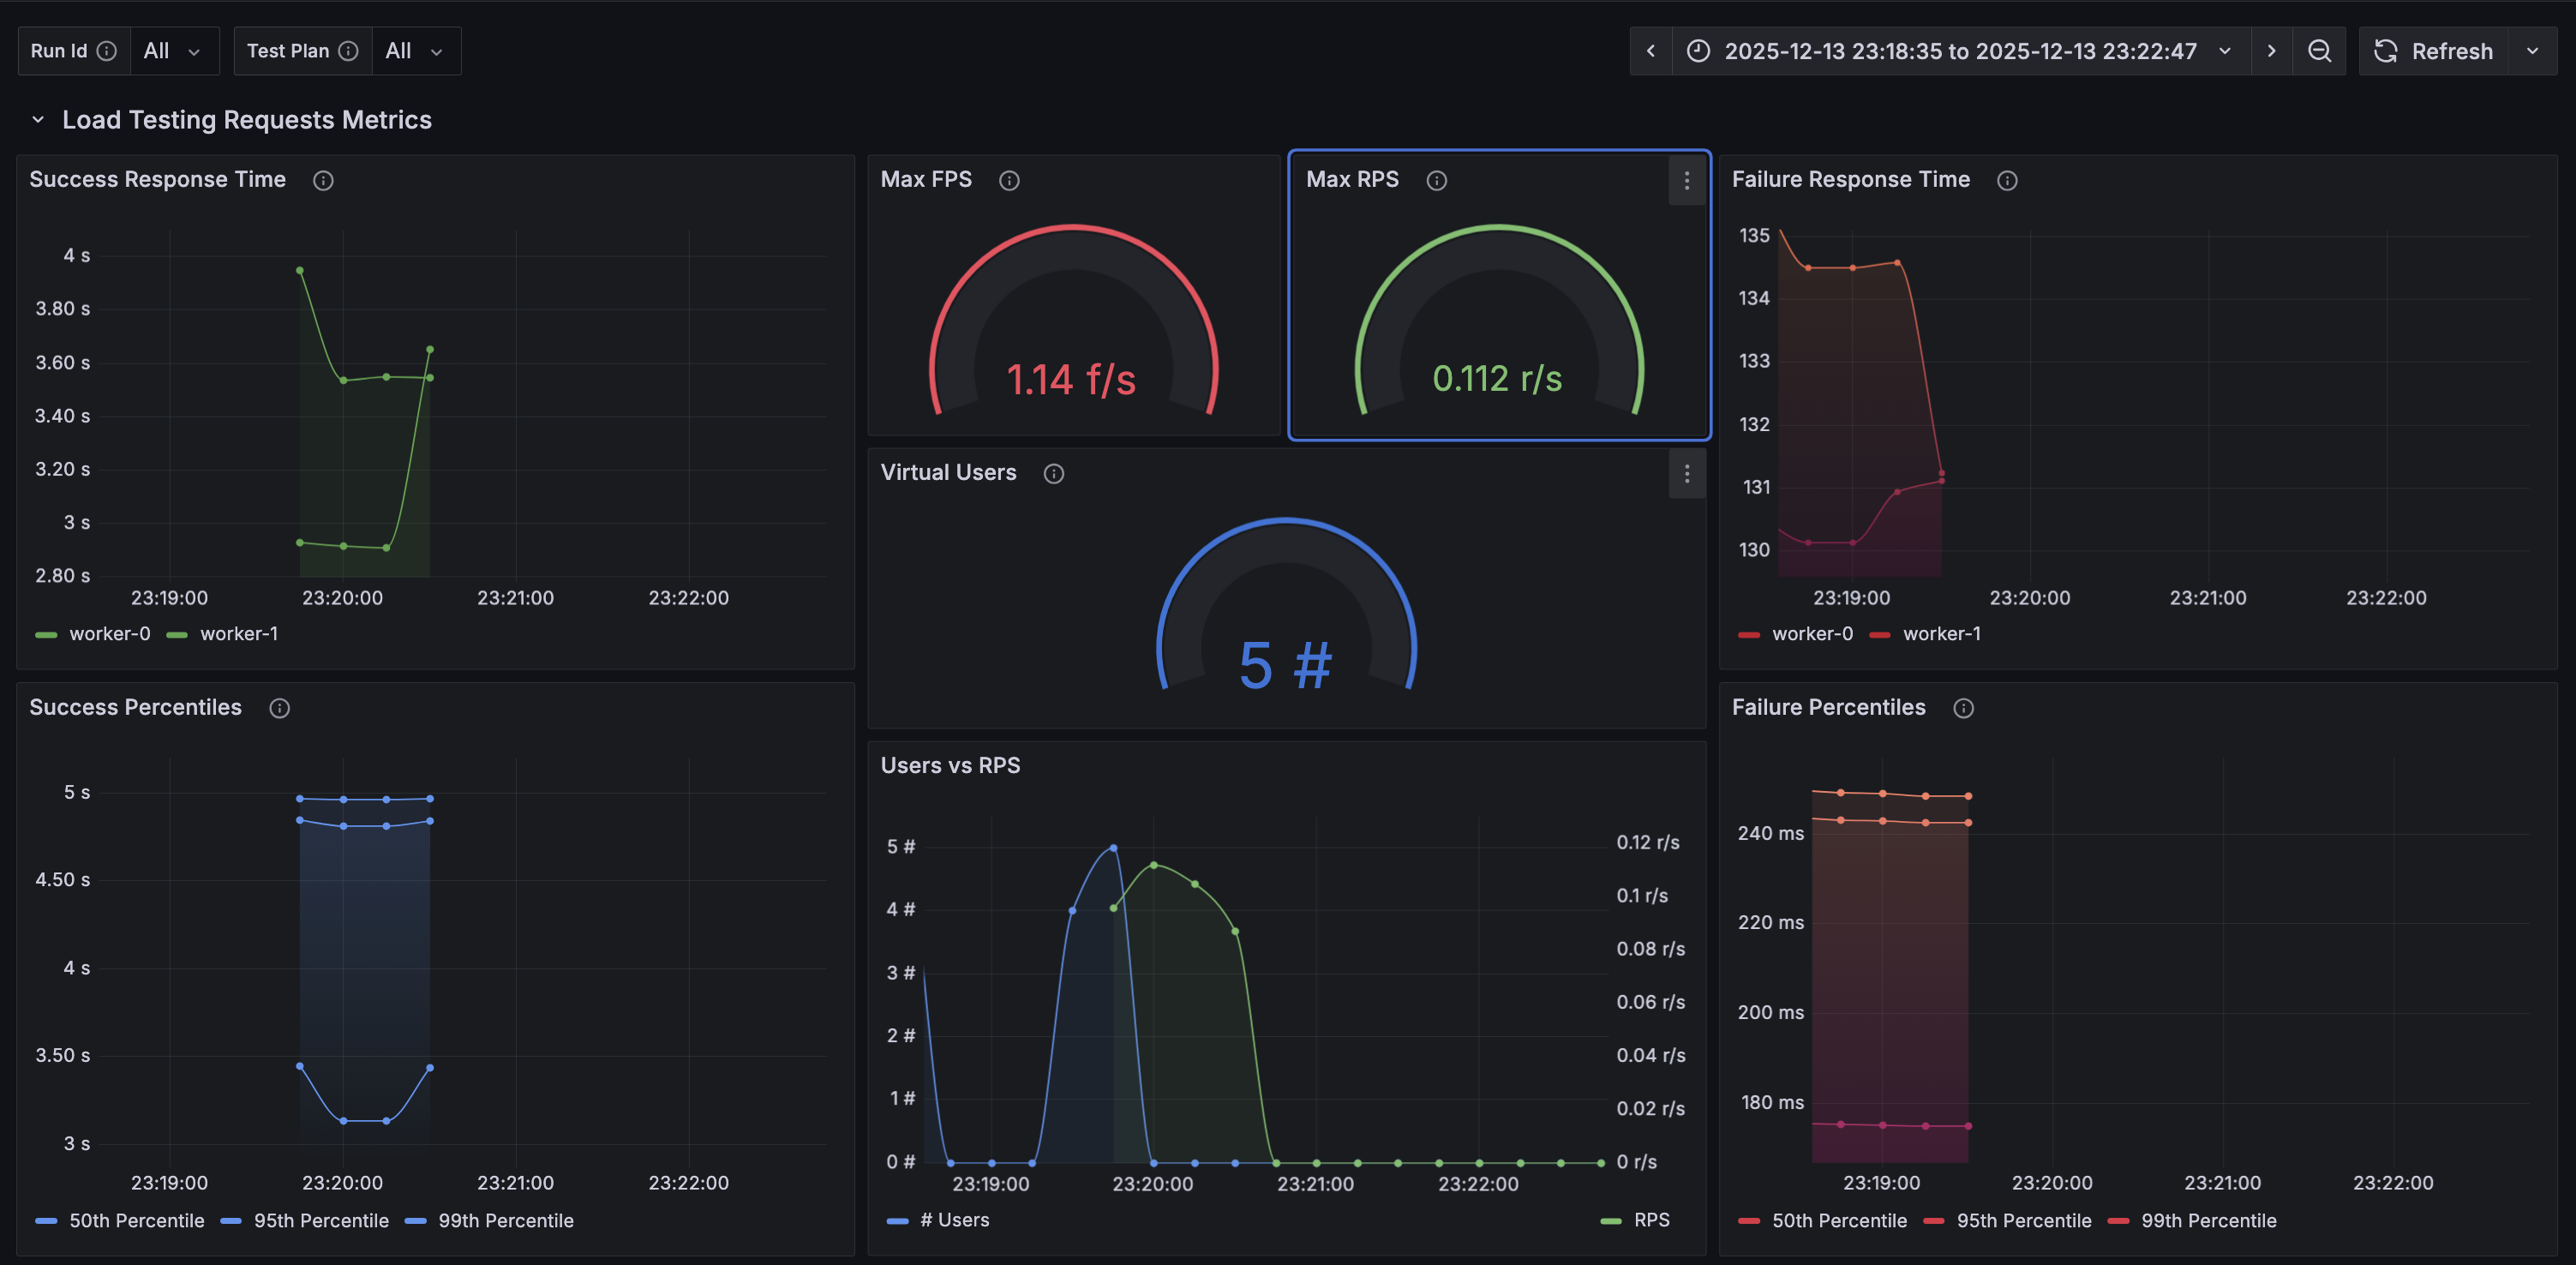
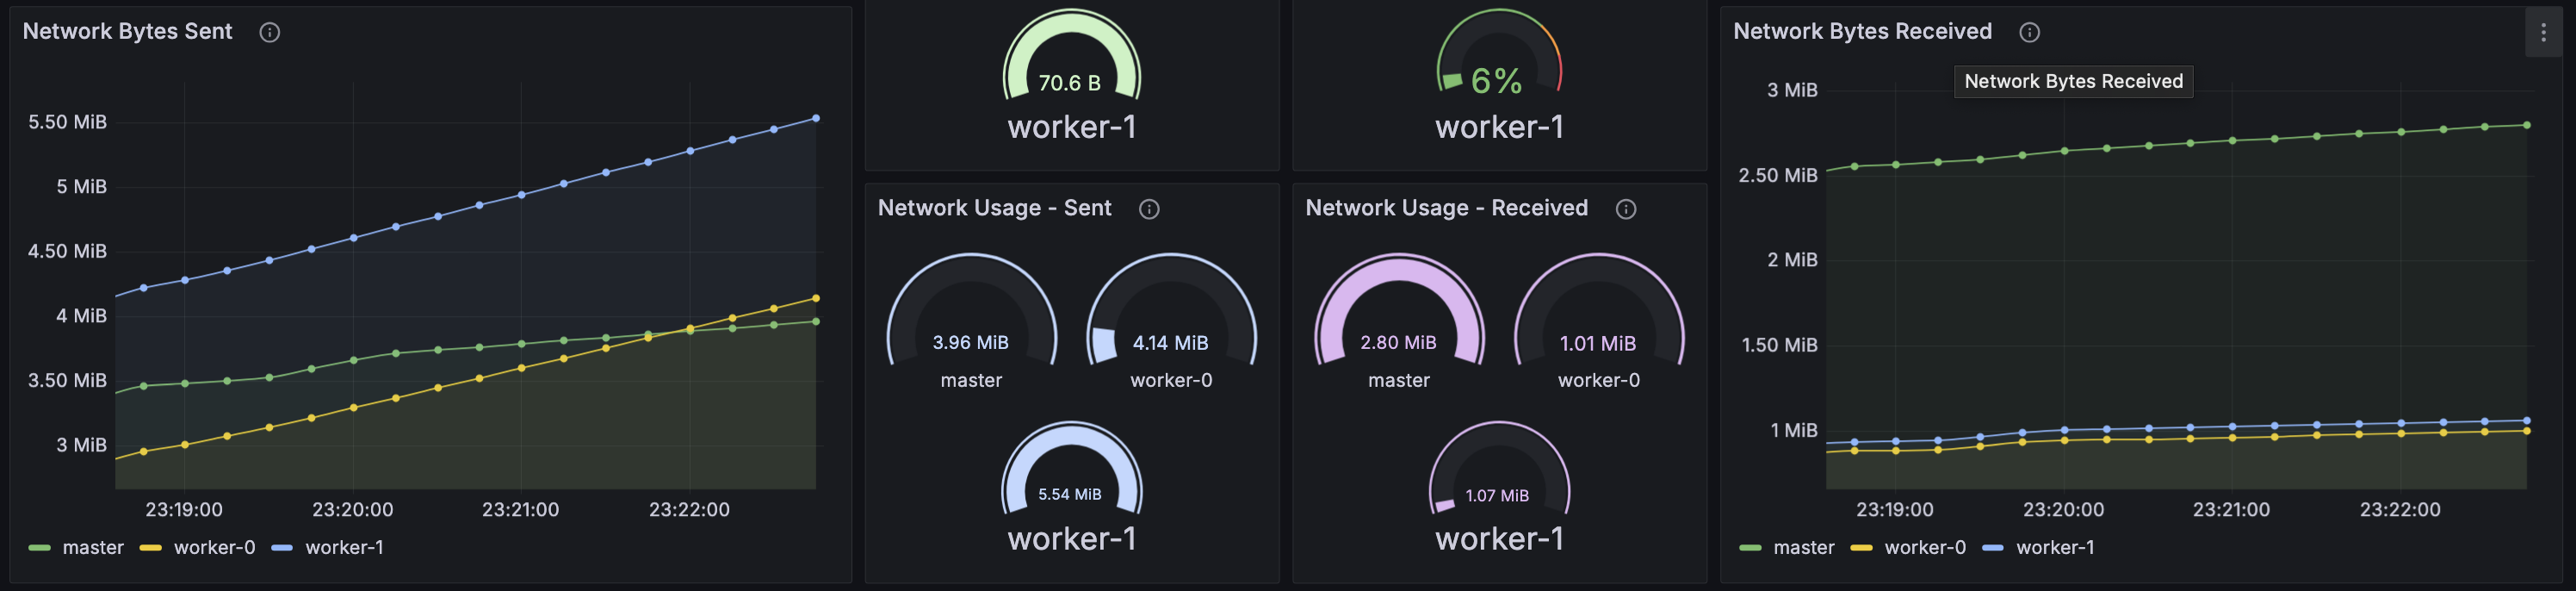
Dashboard Preview
JSON Telemetry (Loki / Grafana Logs)
OpenTelemetry Metrics (Prometheus / Grafana)
Contributing
Contributions are welcome! Please see contributing for guidelines.
Author
Swaroop Shubhakrishna Bhat (@ss-bhat)
Thanks to all contributors ❤️
License
Licensed under the Apache License 2.0. See LICENSE for details.
Project details
Verified details
These details have been verified by PyPIProject links
GitHub Statistics
Maintainers


Download files
Download the file for your platform. If you're not sure which to choose, learn more about installing packages.
Source Distribution
Built Distribution
Filter files by name, interpreter, ABI, and platform.
If you're not sure about the file name format, learn more about wheel file names.
Copy a direct link to the current filters
File details
Details for the file locust_telemetry-2.0.2.tar.gz.
File metadata
- Download URL: locust_telemetry-2.0.2.tar.gz
- Upload date:
- Size: 30.5 kB
- Tags: Source
- Uploaded using Trusted Publishing? Yes
- Uploaded via: twine/6.1.0 CPython/3.13.7
File hashes
| Algorithm | Hash digest | |
|---|---|---|
| SHA256 |
229b3a2371f79ab5a09d4db66f1e21df6a47fdada9b9bd62d0ce77ab303eb5f8
|
|
| MD5 |
764f738431ce64d5a17d7cb74f3ad399
|
|
| BLAKE2b-256 |
302b5470c12f42a114d5f2196a5612ce86cc87762b34f93400bcb7ffdcfc81d7
|
Provenance
The following attestation bundles were made for locust_telemetry-2.0.2.tar.gz:
Publisher:
release.yaml on platform-crew/locust-telemetry
-
Statement:
-
Statement type:
https://in-toto.io/Statement/v1 -
Predicate type:
https://docs.pypi.org/attestations/publish/v1 -
Subject name:
locust_telemetry-2.0.2.tar.gz -
Subject digest:
229b3a2371f79ab5a09d4db66f1e21df6a47fdada9b9bd62d0ce77ab303eb5f8 - Sigstore transparency entry: 763770296
- Sigstore integration time:
-
Permalink:
platform-crew/locust-telemetry@cf3c98a9581e23f242d07c3a3a33793e23e2030b -
Branch / Tag:
refs/tags/v2.0.2 - Owner: https://github.com/platform-crew
-
Access:
public
-
Token Issuer:
https://token.actions.githubusercontent.com -
Runner Environment:
github-hosted -
Publication workflow:
release.yaml@cf3c98a9581e23f242d07c3a3a33793e23e2030b -
Trigger Event:
release
-
Statement type:
File details
Details for the file locust_telemetry-2.0.2-py3-none-any.whl.
File metadata
- Download URL: locust_telemetry-2.0.2-py3-none-any.whl
- Upload date:
- Size: 36.8 kB
- Tags: Python 3
- Uploaded using Trusted Publishing? Yes
- Uploaded via: twine/6.1.0 CPython/3.13.7
File hashes
| Algorithm | Hash digest | |
|---|---|---|
| SHA256 |
e137fb2adfccd02c968b9da577a58896f6b6019cd6112bc4766d6053e4862439
|
|
| MD5 |
733a521509892c1d651b591681458caf
|
|
| BLAKE2b-256 |
8fa5f20d42de066f79f9236a8ad782d5523474db4a7b147b8e8a6c96cb1689e7
|
Provenance
The following attestation bundles were made for locust_telemetry-2.0.2-py3-none-any.whl:
Publisher:
release.yaml on platform-crew/locust-telemetry
-
Statement:
-
Statement type:
https://in-toto.io/Statement/v1 -
Predicate type:
https://docs.pypi.org/attestations/publish/v1 -
Subject name:
locust_telemetry-2.0.2-py3-none-any.whl -
Subject digest:
e137fb2adfccd02c968b9da577a58896f6b6019cd6112bc4766d6053e4862439 - Sigstore transparency entry: 763770298
- Sigstore integration time:
-
Permalink:
platform-crew/locust-telemetry@cf3c98a9581e23f242d07c3a3a33793e23e2030b -
Branch / Tag:
refs/tags/v2.0.2 - Owner: https://github.com/platform-crew
-
Access:
public
-
Token Issuer:
https://token.actions.githubusercontent.com -
Runner Environment:
github-hosted -
Publication workflow:
release.yaml@cf3c98a9581e23f242d07c3a3a33793e23e2030b -
Trigger Event:
release
-
Statement type:


