
logometer
Tail your logs. Catch anomalies. Skip the 2am grep.
logometer watches a log file (or stdin), buckets lines into time windows, and flags windows that look statistically off — an error spike, or an error type that's never shown up before. It's silent when things are fine. No AI required for the core detection; point it at an LLM with --explain if you want a plain-English guess at why a window looks weird.
Zero dependencies for the core tool — just Python 3.10+.
Install
As a standalone command, without cloning:
pipx install git+https://github.com/AmanSg098/logometer.git
Or from a clone, for development:
git clone https://github.com/AmanSg098/logometer.git
cd logometer
pip install -e .              # core tool, no dependencies
pip install -e ".[pretty]"    # optional: styled output via rich
Quick start
Try it on the included sample log (has a normal-traffic baseline plus an injected error burst):
python3 -m logometer.cli tail examples/sample.log --replay
or, once installed:
logometer tail examples/sample.log --replay
Usage
# Tail a live log file (like tail -f, but with anomaly detection)
logometer tail /var/log/app.log

# Pipe from stdin
tail -f app.log | logometer tail -

# Replay a static file from start to finish, then exit
logometer tail app.log --replay

# Only show anomalous windows, hide the "ok" noise
logometer tail app.log --replay --quiet

# Adjust window size (seconds) and how aggressively to flag deviations
logometer tail app.log --window 30 --sensitivity high

# Mute known-noisy lines so they never reach the baseline (repeatable regex)
logometer tail app.log --ignore 'healthcheck' --ignore 'DeprecationWarning'

# Ask an LLM for a one-sentence explanation of each anomaly
export ANTHROPIC_API_KEY=your-key-here
logometer tail app.log --explain

# JSON output, one object per line — good for piping into other tools
logometer tail app.log --format json
Stop a live tail with Ctrl-C (or SIGTERM from a process manager); the window in progress is reported before exiting.
All options
| Option | Default | What it does |
|---|---|---|
file |
— | Log file to read, or - for stdin |
--window SECONDS |
10 |
Window size, when timestamps are parseable |
--sensitivity |
medium |
low, medium or high — how far above the baseline a window must be to count as a spike |
--format |
plain |
plain or json |
--replay |
off | Read the file start to end and exit, instead of following it live |
--quiet |
off | Only print anomalous windows |
--ignore REGEX |
— | Drop matching lines before analysis; repeatable |
--explain |
off | Ask an LLM for a one-sentence cause of each anomaly |
--explain-provider |
anthropic |
anthropic, openai or openrouter |
--explain-model MODEL |
see below | Override the model used by --explain |
--no-pretty |
off | Use plain output even if rich is installed |
--version |
— | Print the version and exit |
Supported timestamp formats
Timestamps are read from each line to decide which window it belongs to. Two formats are recognised:
- ISO 8601 —
2026-09-17T12:03:10,2026-09-17 12:03:10.123Z, and Pythonlogging's default2026-09-17 12:03:10,123 - Syslog —
Sep 17 12:03:10(syslog has no year, so the current year is assumed)
The first 20 lines decide the mode: if at least half have a recognisable timestamp, lines are bucketed by time; otherwise every 50 lines form a window.
--explain
Requires an API key for one of three providers, set in your environment:
--explain-provider |
Key | Default model |
|---|---|---|
anthropic (default) |
ANTHROPIC_API_KEY |
claude-haiku-4-5-20251001 |
openai |
OPENAI_API_KEY |
gpt-4o-mini |
openrouter |
OPENROUTER_API_KEY |
anthropic/claude-haiku-4.5 |
OpenRouter gives one key access to models from many vendors; its model ids are prefixed with the vendor (openai/gpt-4o-mini, google/gemini-2.5-flash, …). No SDK install needed — it's a plain HTTPS call. If the key is missing or the request fails, logometer prints a one-line warning to stderr and keeps tailing normally; it never crashes because --explain had a bad day.
Only the anomalous window's ERROR and WARN lines are sent (capped at 30 lines). Pick a different model with --explain-model:
export OPENAI_API_KEY=your-key-here
logometer tail app.log --explain --explain-provider openai --explain-model gpt-4o

export OPENROUTER_API_KEY=your-key-here
logometer tail app.log --explain --explain-provider openrouter --explain-model google/gemini-2.5-flash
--ignore
Real logs usually have one or two messages that fire constantly and mean nothing. Left alone they dominate the error count, so the rolling baseline learns them as "normal" and a genuine problem has to shout louder to get noticed. --ignore drops matching lines before any analysis:
# on a real macOS install log, one benign repeating message accounted for
# 97% of all "errors" — muting it cut the noise dramatically
logometer tail /var/log/install.log --replay --window 60 --quiet \
  --ignore 'installation-check'          # 27 anomalies -> 5, all genuine
Each --ignore takes a regular expression and can be repeated. An invalid pattern is reported as a normal CLI error rather than a crash.
Live tailing
logometer tail app.log (without --replay) follows the file the way tail -f does, with two things a naive tail loop gets wrong:
- Windows close on time. A window is emitted once its duration has elapsed, even if no further lines arrive. Without this, a service that errors and then dies would never report that final burst — the most important one — because nothing follows it to trigger the flush.
- Rotation is handled. If the log is rotated out from under it (
logrotate, or truncated in place withcopytruncate), it notices and follows the new file instead of reading a now-orphaned file forever.
Output is flushed as each window is reported, so piping or redirecting works in real time:
logometer tail app.log --quiet --format json >> alerts.jsonl
tail -f app.log | logometer tail -
Pretty output
If you pip install rich (or pip install -e ".[pretty]"), terminal output automatically upgrades to styled panels. Not required — plain ANSI output works everywhere. When output is piped or redirected to a file it stays plain text either way; pass --no-pretty to get plain output in the terminal too.
Example output
From the included sample log:
$ logometer tail examples/sample.log --replay --no-pretty

  [12:01:20 – 12:01:30]  ok        errors: 0   baseline: ~0.1

  [12:01:30 – 12:01:40]  ! ANOMALY  errors: 10  warns: 1  baseline: ~0.1   score: 9.9x
    New error signature detected: '<x> ERROR ConnectionResetError: [Errno <x>] Connection reset by peer id=<x>'

  [12:01:40 – 12:01:50]  ! ANOMALY  errors: 6  baseline: ~0.1   score: 5.9x
    (error rate spike — no brand-new error signature)

  [12:01:50 – 12:02:00]  ok        errors: 0   baseline: ~0.1
  ...
-- 18 window(s) processed, 4 anomaly(ies) flagged --
score is how many standard deviations the window's error count sits above the baseline. <x> marks the ids, numbers and timestamps stripped out when building an error signature.
With --explain, each anomaly gets one more line:
  [12:01:30 – 12:01:40]  ! ANOMALY  errors: 10  warns: 1  baseline: ~0.1   score: 9.9x
    New error signature detected: '<x> ERROR ConnectionResetError: [Errno <x>] Connection reset by peer id=<x>'
    Explanation: Database or downstream service became unresponsive, causing clients to forcibly close connections due to timeouts or hangs.
With --format json, each window is one line with these fields:
{"window_index": 9, "start": "12:01:30", "end": "12:01:40", "error_count": 10, "warn_count": 1, "baseline_mean": 0.111, "error_score": 9.889, "is_anomaly": true, "new_shapes": ["<x> ERROR ConnectionResetError: [Errno <x>] Connection reset by peer id=<x>"], "explanation": null}
The end-of-run summary line is omitted in JSON mode, so every line of output is valid JSON.
How the detection works
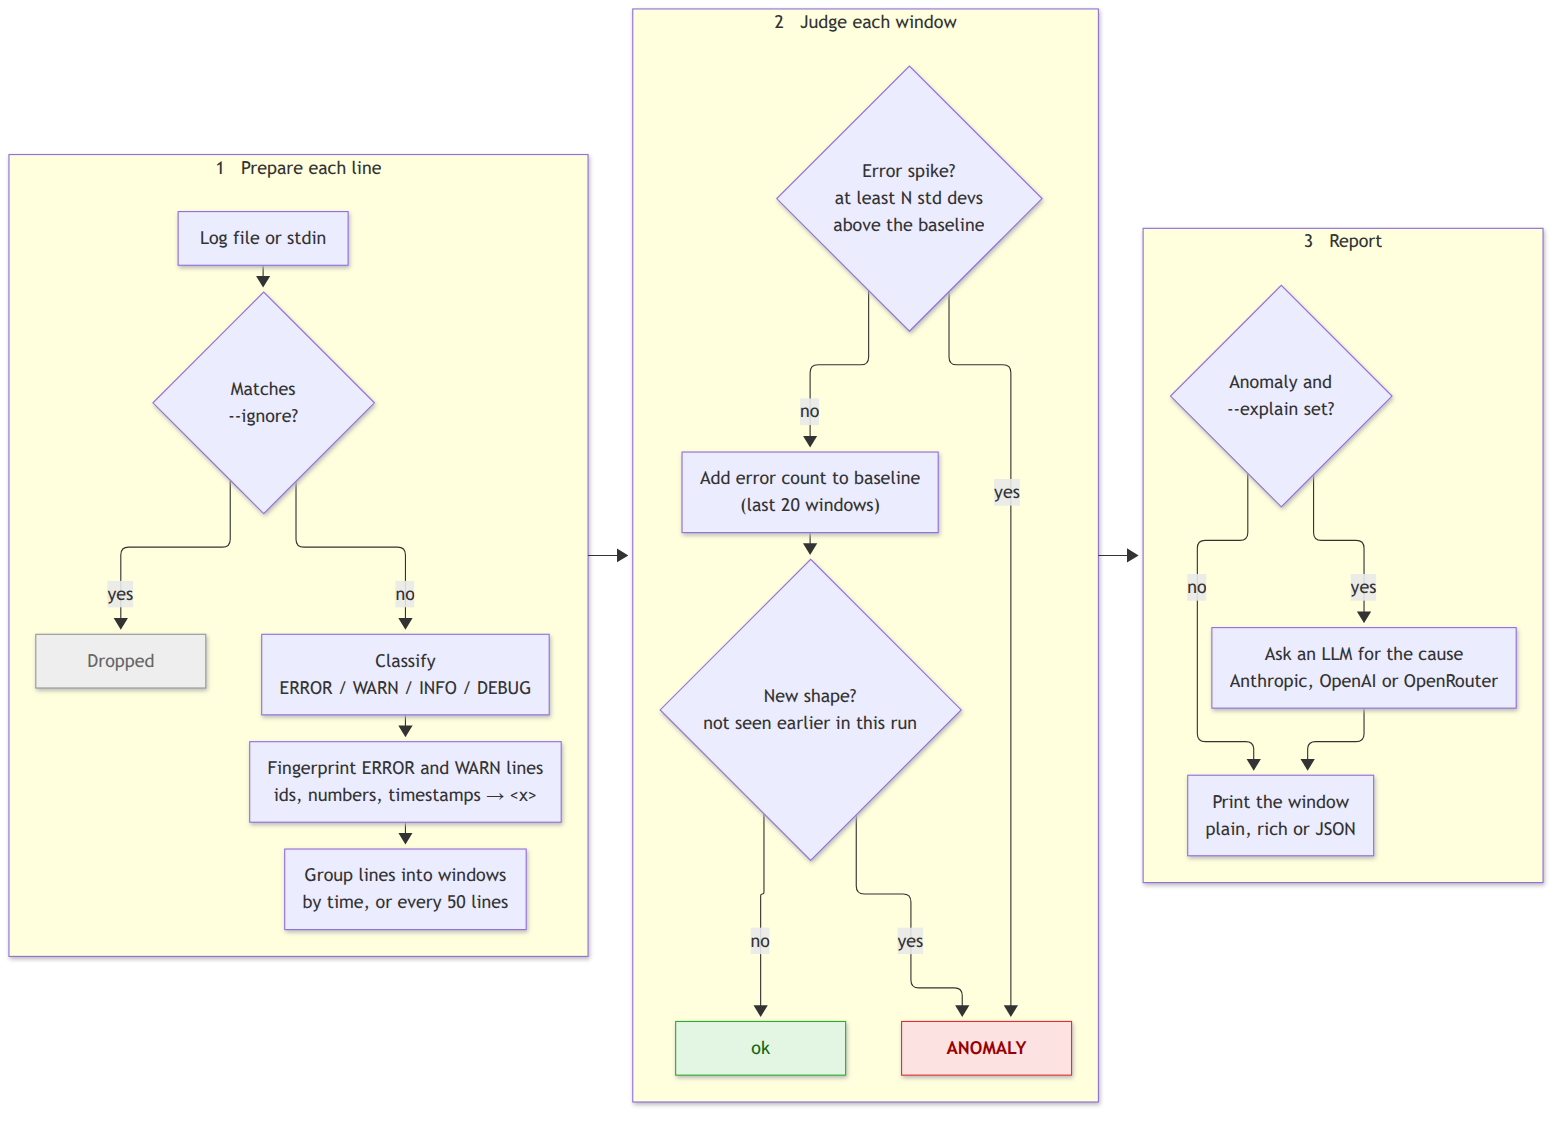
- Classify. Each line is tagged by keyword: ERROR (
error,err,fatal,critical,exception,traceback,panic), then WARN (warn,warning), INFO (info,notice), DEBUG (debug,trace). First match wins, so a line mentioning both an error and a warning counts as ERROR. - Fingerprint. ERROR and WARN lines are reduced to a "shape": UUIDs, hex addresses, timestamps, quoted strings and numbers are replaced with
<x>, so the same underlying error collapses to one shape regardless of the specific id. - Window. Lines are batched into fixed-size windows — by time if timestamps are parseable, otherwise by a fixed line count.
- Baseline. The error counts of the last 20 windows give a rolling mean and standard deviation — what "normal" error volume looks like. Scoring starts once 3 windows of history exist.
- Flag. A window is anomalous if either:
- its error count is at least N standard deviations above the mean, where N is 3.0 for
--sensitivity low, 2.0 formediumand 1.2 forhigh; or - it contains an error or warning shape not seen earlier in this run (checked from the second window on).
- its error count is at least N standard deviations above the mean, where N is 3.0 for
Two tuning choices keep this honest:
- Noise floor. The standard deviation is never taken as less than 1.0. On a log that's normally error-free the real deviation is 0, and a single stray error would otherwise score as infinitely anomalous.
- Spikes don't train the baseline. A window flagged as a spike isn't added to the history, so a long outage doesn't slowly teach the tool that a high error rate is normal.
No ML model, no training step — deliberately simple and explainable.
Known limitations
Worth knowing before you point this at something you care about. These are real, tested behaviours, not hypotheticals:
- Severity is keyword matching, not parsing. A line counts as an error if it contains a word like
error,fatalorcritical. That meansDownloading 1 products: Critical []— an empty list, i.e. good news — is counted as an error. Use--ignoreto mute these. - Python tracebacks are only partly seen.
Traceback (most recent call last):is detected, but the finalValueError: ...line is not, because the match looks forerroras a standalone word. And since that first line is identical for every exception, new-signature detection can't tell one crash type from another. Logs that print their own level (ERROR ValueError: ...) work properly. - JSON logs break new-signature detection. Fingerprinting strips quoted strings, which in a JSON line removes the entire message — so unrelated errors collapse into one shape. Error counting still works. Extracting the message first works around it:
jq -r '.level + " " + .msg' app.log | logometer tail -. - Only the error count is scored. A flood of identical warnings won't trigger a spike (though a never-seen-before warning shape will be flagged), and a sudden drop in traffic isn't detected either — only rises above the baseline are.
- Window labels show time, not date. On a log spanning several days you'll see the same
[17:14:39 – 17:15:39]label more than once. - Timezone offsets are ignored.
2026-09-20 19:05:04+05:30is read as local wall-clock time; a log mixing offsets is bucketed as though they were the same clock. - Nothing persists between runs. The baseline and the set of known error shapes are rebuilt from scratch each start, so expect the first few windows of any run to over-flag. (Persistence is on the roadmap.)
- If timestamps can't be parsed it silently falls back to fixed 50-line windows, and
--windowstops having any effect. You can tell from the labels:[line 1 – line 50]instead of a time range. --explainonly sees ERROR and WARN lines. Lines without a level keyword — like the body of a Python traceback — aren't sent, so the model can miss the root cause and give a vaguer answer.--explainsends log lines to a third party. There's no redaction — don't use it on logs containing secrets or personal data.
Running the tests
python3 -m unittest discover -s tests -v
No network or API key is needed — the --explain tests mock the HTTP call.
Project layout
logometer/
  cli.py         command-line entry point, file/stdin reading, output formatting
  classifier.py  severity tagging and error-shape fingerprinting
  timeparse.py   timestamp extraction (ISO 8601, syslog)
  windower.py    groups lines into time- or count-based windows
  baseline.py    rolling mean / standard deviation of errors per window
  detector.py    decides whether a window is anomalous
  explain.py     optional LLM explanations (Anthropic / OpenAI / OpenRouter over plain HTTPS)
  pretty.py      optional rich-styled output
tests/           unit and end-to-end tests
examples/        sample log with an injected error burst
docs/            flow diagram (Mermaid source + rendered PNG)
Roadmap
- Config file for custom log-format parsing
- Multiple file / glob support
- Slack/Discord webhook alerts
- Persistent anomaly history (SQLite)
Contributing
Issues and PRs welcome — especially around log-format parsing (every stack logs differently) and reducing false positives.
License
MIT — see LICENSE.
1 maintainer

Release files for logometer 0.1.0
For a detailed explanation of source distributions (sdists) and built distributions (wheels), please see the package formats documentation.
Source distribution (sdist)
| File | Size | Uploaded | |
|---|---|---|---|
| logometer-0.1.0.tar.gz | 35.3 kB | Details |
Built distribution (wheel)
| File | Interpreter | ABI | Platform | Reset |
|---|---|---|---|---|
| logometer-0.1.0-py3-none-any.whl | Python 3 | none | any | Details |
Total release size: 61.9 kB
Release files / logometer-0.1.0.tar.gz
| Download URL | logometer-0.1.0.tar.gz |
|---|---|
| Size | 35.3 kB |
| Tags | Source |
|
SHA-256 checksum How to use checksums |
e29ef90aa4f367d0135662a73ae616775489b6d666093d2ee4a35f1c0c3cb7fa
|
|
BLAKE2b-256 checksum How to use checksums |
c7fce6733c02fae8b678f7deff7e4255d5b8544f0177d686c3495f897c081793
|
| Upload date | |
|
Uploaded using Trusted Publishing? What is trusted publishing? |
No |
| Uploaded via |
uv/0.12.15 {"installer":{"name":"uv","version":"0.12.15","subcommand":["publish"]},"python":null,"implementation":{"name":null,"version":null},"distro":{"name":"Zorin OS","version":"18","id":"noble","libc":null},"system":{"name":null,"release":null},"cpu":null,"openssl_version":null,"setuptools_version":null,"rustc_version":null,"ci":null}
|
Release files / logometer-0.1.0-py3-none-any.whl
| Download URL | logometer-0.1.0-py3-none-any.whl |
|---|---|
| Size | 26.6 kB |
| Tags | Python 3 |
|
SHA-256 checksum How to use checksums |
275082ee005140e61ef81efb684c244726b3272d08e0e07fae9b4262751464be
|
|
BLAKE2b-256 checksum How to use checksums |
712ed745e1eb786e242d2c954c7600c345be6d848ab34af18a5f4edd9328c907
|
| Upload date | |
|
Uploaded using Trusted Publishing? What is trusted publishing? |
No |
| Uploaded via |
uv/0.12.15 {"installer":{"name":"uv","version":"0.12.15","subcommand":["publish"]},"python":null,"implementation":{"name":null,"version":null},"distro":{"name":"Zorin OS","version":"18","id":"noble","libc":null},"system":{"name":null,"release":null},"cpu":null,"openssl_version":null,"setuptools_version":null,"rustc_version":null,"ci":null}
|













