DESC
Project description
LTSpice data parsing library for python
Installation
$ pip install ltspice
Supported Files
- encoding : UTF8 / UTF16-LE
- format : Binary / Ascii
- extenstion : .raw / .fft
Usage
import ltspice
filepath = 'Your ltspice output file (.raw)'
l = ltspice.Ltspice(filepath)
l.parse() # Data loading sequence. It may take few minutes for huge file.

time = l.get_time()
V1 = l.get_data('V(N1)')
Examples
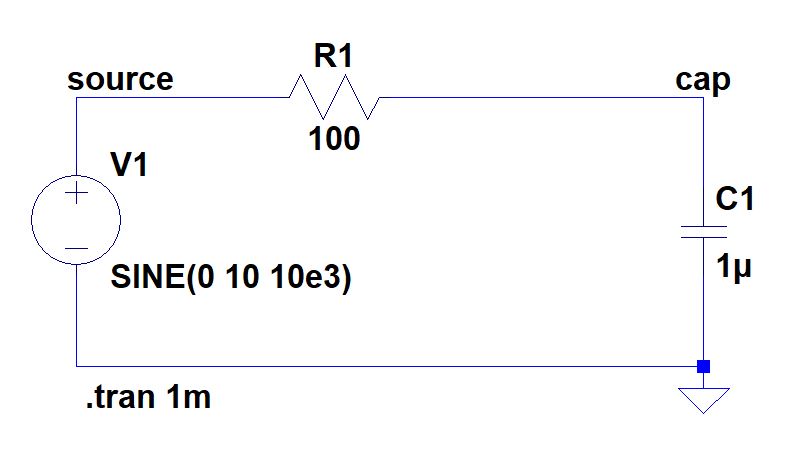
01 - RC Circuit
LTSpice file (.asc)

Python code (.py)
import ltspice
import matplotlib.pyplot as plt
import numpy as np
import os

l = ltspice.Ltspice(os.path.dirname(__file__)+'\\rc.raw')
# Make sure that the .raw file is located in the correct path
l.parse()

time = l.get_time()
V_source = l.get_data('V(source)')
V_cap = l.get_data('V(cap)')

plt.plot(time, V_source)
plt.plot(time, V_cap)
plt.show()
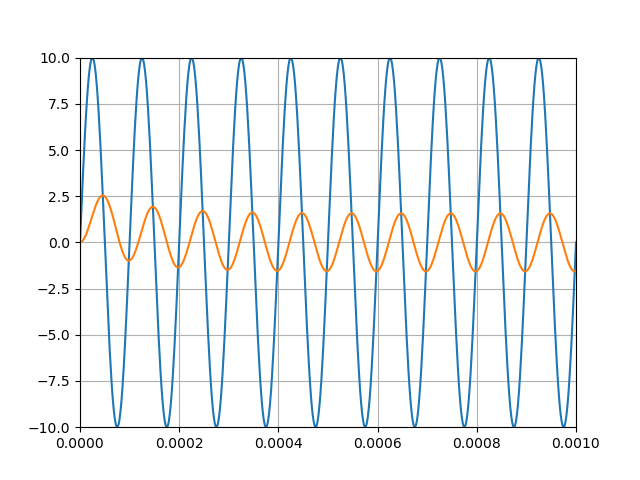
Output result

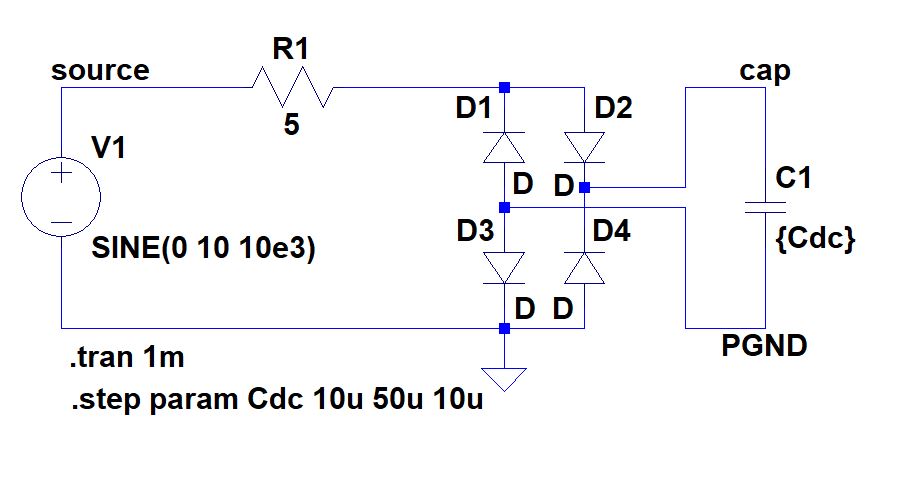
02 - Multi point simulation
LTSpice file (.asc)

Python code (.py)
import ltspice
import matplotlib.pyplot as plt
import numpy as np
import os

l = ltspice.Ltspice(os.path.dirname(__file__)+'\\rectifier.raw')
# Make sure that the .raw file is located in the correct path
l.parse()

time = l.get_time()
V_source = l.get_data('V(source)')
V_cap_max = []

plt.plot(time, V_source)
for i in range(l.case_count): # Iteration in simulation cases
    time = l.get_time(i)
    # Case number starts from zero
    # Each case has different time point numbers
    V_cap = l.get_data('V(cap,pgnd)',i)
    V_cap_max.append(max(V_cap))
    plt.plot(time, V_cap)

print(V_cap_max)

plt.xlim((0, 1e-3))
plt.ylim((-15, 15))
plt.grid()
plt.show()
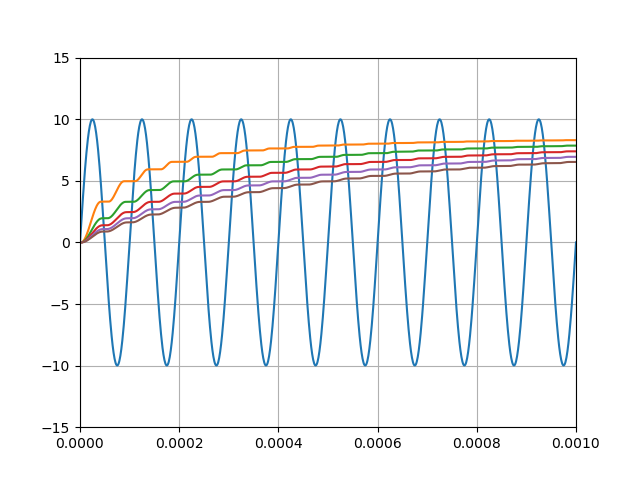
Output result
$ [8.299080580472946, 7.855469107627869, 7.391375303268433, 6.944645524024963, 6.529755532741547]

If you want to find more usage examples, please check examples folder.
Project details
Release history Release notifications | RSS feed
Download files
Download the file for your platform. If you're not sure which to choose, learn more about installing packages.
Source Distribution
ltspice-1.0.6.tar.gz
(6.2 kB
view details)
File details
Details for the file ltspice-1.0.6.tar.gz.
File metadata
- Download URL: ltspice-1.0.6.tar.gz
- Upload date:
- Size: 6.2 kB
- Tags: Source
- Uploaded using Trusted Publishing? No
- Uploaded via: twine/3.4.2 importlib_metadata/4.6.1 pkginfo/1.7.1 requests/2.26.0 requests-toolbelt/0.9.1 tqdm/4.61.2 CPython/3.9.14
File hashes
| Algorithm | Hash digest | |
|---|---|---|
| SHA256 |
b9ec773e35262f72379a44c70874c3967100593e34802ec0546af656adfa17a7
|
|
| MD5 |
f96786c25069df4a20dd36a5e4550441
|
|
| BLAKE2b-256 |
6a7b80a1552d54ffd1854b9f5a762227aaddcee7a2ee1447be298e804f087019
|


