
This release is a pre-release and may not be stable for production use.
luna-doctor
Alpha. Until
1.0.0, the CLI, the JSON schema and measured gateway behaviour can change without a major bump. If you embed this tool in automation, pin to an exact tag.
LunaRoute runs your coding agents on open models. LunaRoute measures capacity in concurrent requests, not tokens. This tool explains what your LunaRoute agent traffic does to that concurrency, and what to change.
LunaRoute bills concurrent sessions, not tokens. There is no quota or token-budget dimension to it. The account admits a fixed number of concurrent requests at once. Every symptom below is that number being exceeded.
When the account is full, the gateway waits. It can also demote the request to a background tier, and then hold the stream open with keep-alives while it produces nothing. Part of that same overflow also arrives directly as a 429 (rate_limit_error, CONCURRENT_REQUEST_LIMIT_EXCEEDED). A 429 in your logs is therefore a concurrency symptom, not a quota that you can wait out. Often the harness kills a stall with an error string of its own making instead. That is why a grep of the logs for 429 finds only part of the picture.
luna-doctor reads the session logs that the machine already has. It reconstructs what was asked for at what tier, and what came back. Then it tells you what to adjust. Thresholds are measured on your machine, not assumed from ours.
Install
Requirements: Python 3.9+. Everything below, discover, analyze, fix, chart and the bare default run, is offline and needs no credentials. capacity reads a disk cache the same way. The only fetches in the tool are opt-in. They use the routing key that lunaroute login already stored: capacity --online, and analyze --online / fix --online for the model catalog.
pipx install luna-doctor   # installs the `luna-doctor` command
luna-doctor --version      # prints the installed version
Every release is an alpha. pipx installs it, because the index holds no final release.
To run from a checkout instead:
git clone https://github.com/jesserobbins/luna-doctor.git
cd luna-doctor
pipx install .
Give the install to your agent instead: docs/install-with-an-agent.md
holds one block to paste, which installs the tool, reads the account's capacity
and applies the settings that fix names.
Or without packaging, put it on your PATH:
ln -s "$PWD/bin/luna-doctor" ~/.local/bin/luna-doctor
luna-doctor --version
Quick start
luna-doctor                  # the default run: the last hour analyzed, plus the chart
luna-doctor discover          # what log stores exist, how big, how fresh
luna-doctor analyze           # last 24h: what happened and what to adjust
luna-doctor analyze --now     # last 15 minutes (alias for --since 15m)
luna-doctor analyze --since 7d --json   # machine-readable, for cron/CI
luna-doctor analyze --plan <plan name or number>   # declare the account's width
luna-doctor analyze --baseline prev     # …this window against the one before it
luna-doctor analyze --style plain       # undecorated text, for a paste or a pipe
luna-doctor explain           # one request: what it waited for, and whose room it was
luna-doctor explain --blocked # the newest request the gateway refused
luna-doctor explain --slowest --last 5  # the five longest by duration
luna-doctor watch             # during an incident: one line per state change, summary on Ctrl-C
luna-doctor analyze --for-issue  # one redacted, datable block for a support ticket
luna-doctor capacity          # the account's plan and priority concurrency (cached)
luna-doctor fix               # per-agent copy-paste config, from the evidence
luna-doctor fix --agent pi    # …or one agent at a time (pi | claude-code | codex | swamp)
luna-doctor chart --since 24h # SVG: one stacked-area graph of concurrent requests
luna-doctor chart --since 24h --open  # …and open it in your browser
Exit codes: 0 no pressure, 1 pressure found, 2 no data. These codes are usable from a shell prompt, a skill, or cron. explain follows the same codes for the one request it explains: 1 when that request was refused or stalled, 0 when it was served.
How it works
One report, two renderers
discover, analyze and capacity all build the same Report: a headline,
sections of label: value rows, adjustments and a footnote. The report goes to
one of two renderers. plain is undecorated text: no ANSI, no emoji, and no
column padding. A value longer than its column therefore cannot break the
layout. That is why output survives a narrow terminal, a pipe, or a chat app
that wraps at 40 characters. pretty draws the same rows at a terminal, with
color, a rule under each section and a moon.
--style is on discover, analyze, capacity and chart. auto is the
default. It picks pretty when stdout is a terminal and NO_COLOR is unset, and
plain otherwise. --style pretty asks for decoration even down a pipe.
NO_COLOR still wins over it. CLICOLOR_FORCE colors a pipe that otherwise
stays plain. --json is never styled: no Style is constructed on that path at
all. chart takes the flag for consistency, but its console output is four plain
lines. Those lines give the two paths, the counts behind the picture and the
source of the drawn rule. The picture is the SVG.
--copy is on discover, analyze, capacity and fix. It puts the printed
text on the clipboard too, as plain text. The tool uses the first of pbcopy,
wl-copy, xclip or xsel that it finds on PATH. Stdout does not change, so a
machine with no clipboard tool loses nothing. stderr says so, and never as an
error.
The attribution line
The default run and analyze open with one line. That line answers a question
that an error string cannot answer. Ask: which wall did this traffic hit? The
wall is this machine, the account, or the gateway. The verdict word is one of
you, your org, the gateway, not concurrency, or unknown.
The line leads the report. Every later row is judged against the wall that the line names. A report misleads when it confuses one wall with another. If a gateway fault looks like your own traffic, you lower a setting that was never the problem.
analyze: what your machine was doing
The command reconstructs every model request from the pi and claude-code log stores. It classifies each outcome against measured gateway behaviour: admission timeouts, silent background demotions, upstream errors, concurrency rejections that surface as 429s, and more. Thresholds (admission deadlines, idle budgets) are measured per model, not hardcoded. The report carries each model's observed deadline with its sample count. It does not lend one model's number to another.
The combined snapshot (metrics.snapshot in the --json envelope) reads one
store further. codex rollouts are parsed into requests and counted as measured,
per model and per harness. codex's declared configuration keys join the catalog
beside their siblings. But codex requests do not enter the outcome classes
above, which stay gated to the harnesses that --harness names (pi and
claude-code by default). Token totals stay per harness and the tool never merges
them. codex's input_tokens includes its cached tokens, while pi's input
excludes cacheRead. One merged "input tokens" number is therefore a silent
wrong answer.
--plan <plan name or number> declares the account's priority concurrency for
that run. It is a declaration and never a measurement. The tool uses it only
when the account's own capacity payload carries no number. If the account does
report one, the declaration is set aside and the report says so. Account values
are labelled (account), and plan-derived ones (declared plan <name>). A value
that neither source supplies is unknown, with the command that fetches the
account half (luna-doctor capacity).
fix takes the same --plan declaration, so the tool judges the advice and the
analysis against the same number.
--baseline prev: this window against the one before it
analyze --baseline prev compares the window with the window before it. The
second window has the same length and comes from the same logs. The report
prints a change: section:
blocked at admission: 12 -> 3
If either window holds fewer requests than the sample floor, the verdict is
inconclusive. A direction that rests on a few requests is a coincidence with
a number attached.
The section never claims a cause. It places two windows of the same logs side by side. The report does not say that your change made the difference.
fix: what to change, with copy-paste you can audit
Prints one block per agent: the exact file, the snippet, and a command that backs
the file up, makes sure that the file is still valid, merges the key, and prints
ok. It never writes anything itself. The tool made sure that every key it
emits is in the installed harness bundles or their shipped docs. It does not
emit a key that it cannot make sure of.
The fix output ends with a way to make sure that the change worked. Restart
the harness. Then run analyze --baseline prev and read the change: section.
Success looks like a lower blocked-at-admission count over a window wide enough
to clear the sample floor.
explain: why was that one request slow
analyze describes the window. explain describes one request in that window.
The report gives the start and the end of the request, the length of the wait,
and the result. It gives the number of requests that this machine had in flight
when the request started, and the peak during the request. It also says whether
the same model served another request inside that span.
The headline names the owner of the wait. The owner is this machine, the shared pool of the account, the gateway, or no wall at all. Each number carries a label that gives its owner.
If you give no flag, explain selects the request that went wrong, which is a
refused request or a stalled request. --blocked selects the newest refused
request. --slowest selects by duration only. A bare id selects one request by
response id, session id, or run id.
watch: the incident, live
watch reads the last 15 minutes on a fixed interval. It prints one line for
each change of state. The line gives the pressure classes that moved, the peak
that this machine held, and the occupancy of the account when a capacity sample
covers that moment.
On a terminal, watch redraws a frame. Through a pipe, it adds ASCII lines and
never sends cursor control codes. Ctrl-C prints a summary of three lines and
exits with the verdict of the last sample. --count N and --once stop without
a key press. --json prints one object for each sample, for a script.
analyze --for-issue: a block that you can send to someone
--for-issue replaces the report with one block. The block is safe to paste.
It gives the tool version and the log schema, the window in UTC, and the stores
that the run read. It gives the attribution verdict, the headline, and the rows
with their labels.
The tool redacts home paths, email addresses, and long opaque tokens before it writes the block. You can put the block in a support ticket or an issue, and the block does not carry the layout of your machine.
chart: one picture
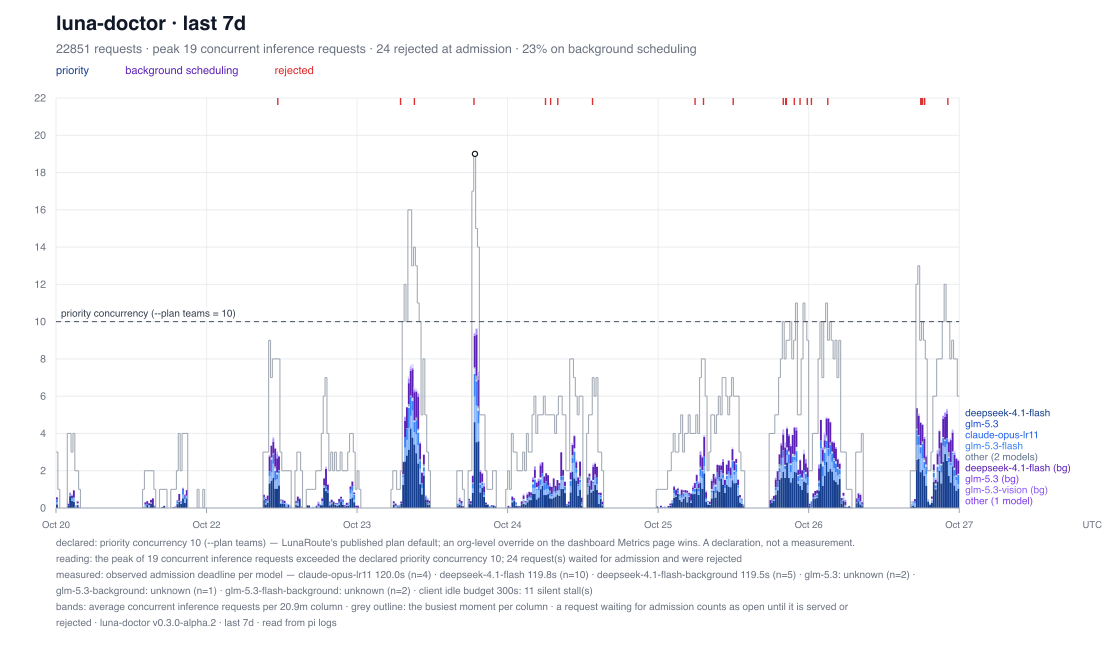
Seven days of generated example traffic. The stack is the concurrent requests in flight, split by model and by scheduling class. The dashed rule is a declared width, not a measured one. The open circle is the peak. Each red tick on the top edge is a request that the gateway rejected. The thin stretches are the night.
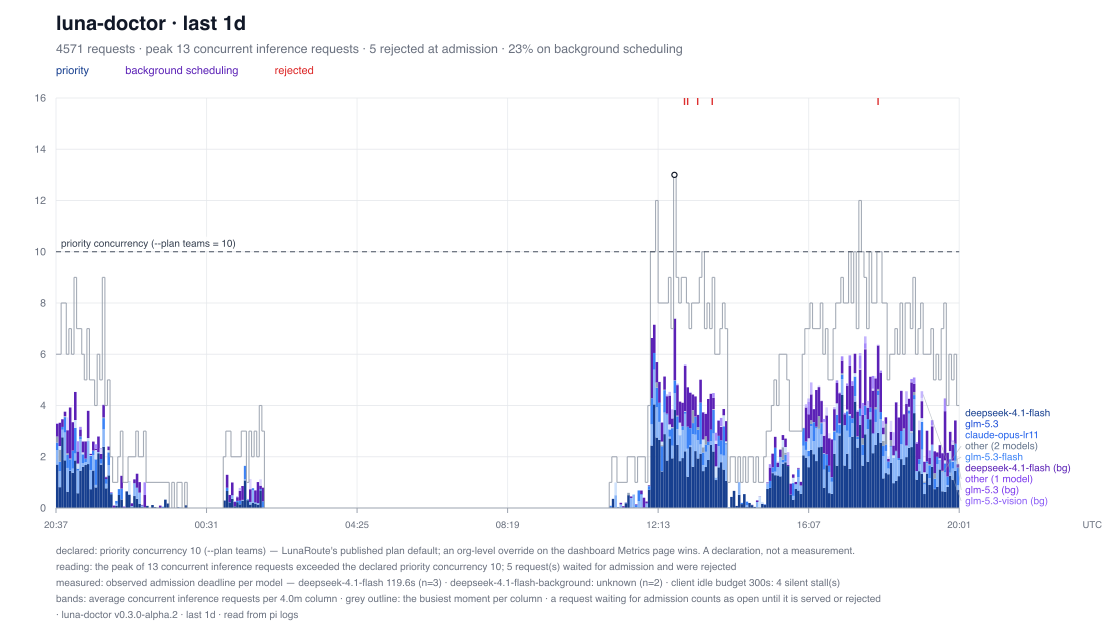
The same store, for the last day only. A burst crosses the declared width, and five requests were refused at admission. A day with a busy afternoon and a quiet night is what the tool usually has to describe.
Both pictures come from a synthetic log store, not from an account and not from
a real session. They carry a declared width, so no plan and no account number
appears in them. Run python3 scripts/make_demo_charts.py to write them again.
The script generates the store from an hour-of-week rhythm, a mix of models and
tiers, and a small share of refusals, then points the chart at it and leaves the
capacity cache empty, so no account value can reach the picture.
A standalone SVG opens anywhere. It has no embedded or remote fonts, so the text
names a system font stack. It has no scripts and no CDN. A PNG is written
beside it under the same stem, and that PNG is the inline image, pasteable into
a chat, a note or a doc. --no-image suppresses it. The graph is one
stacked-area graph: a single time axis and a single stack. The height of the
stack is the account's total concurrent inference requests. The stack is
layered by band. A band is one model's traffic from one agent in one scheduling
class (blues for priority, violets for background). A band is named for the
agent that it belongs to ("glm-5.3 · pi") whenever more than one agent has
traffic. A grey outline carries the busiest moment per column. An open circle
marks the exact peak. Red flare ticks hang where the gateway rejected a request.
The account's priority concurrency is one dashed rule, drawn from the capacity
API's cached account value, or declared with --plan when the account has no
number. The rule is labelled with its source, so a fetched value can never be
mistaken for a declared one. The footer carries the provenance: what was
measured, what was declared.
The picture deliberately carries no universal admission deadline, because the
deadline is per model. It carries no advisory concurrency figure, because advice
that depends on the plan belongs to analyze. It carries no latency picture,
because latency lives in analyze.
Use it as an agent skill
The tool explains one incident. The skill is what an agent reads, so that the agent reaches for the right command before it theorises.
skills/luna-doctor/SKILL.md is a router: the invariants that must not be
broken, a table that turns a symptom into the file that answers it, the command
index with the flags an agent actually types, and the exit codes. The nine files
under skills/luna-doctor/references/ hold the depth. An agent loads one at a
time:
| file | what it answers |
|---|---|
playbooks/slow-right-now.md |
the incident loop, and how far back to widen |
playbooks/one-bad-request.md |
explain: which request, and whose wait |
playbooks/too-wide.md |
many requests at once, and whose wall it was |
playbooks/after-the-fix.md |
did the change work |
playbooks/share-evidence.md |
the block to paste, and watch live |
outcomes.md |
every outcome id, verdict word and metric |
gateway-contract.md |
the measured constants, and what these logs cannot see |
fix-families.md |
how to read fix, and the sizing family |
chart-anatomy.md |
reading the picture above |
Every playbook ends in a verdict, so an agent that loads one cannot finish without saying whose wall it was, which number belongs to whom, and what to change. The catalogues are there because the same question keeps arriving in different words: which outcome id, whose capacity number, which header lies.
Add it to your agent:
npx skills add jesserobbins/luna-doctor
The skill is only as good as its agreement with the CLI, so that agreement is a
test rather than a review note: tests/test_skill_package.py parses every
subcommand's --help and fails if any skill file names a flag the parser does
not carry, links a path that resolves nowhere, names a command that does not
exist, or pushes the router past its line and word budget.
What it reads
Read-only, and offline by default for discover / analyze / fix / chart:
| harness | store |
|---|---|
| pi | ~/.pi/agent/sessions/**/*.jsonl |
| claude-code | ~/.claude/projects/**/*.jsonl |
| codex | ~/.codex/sessions/**/*.jsonl: parsed into requests and counted as measured per model in the combined snapshot (compressed *.jsonl.zst rollouts are skipped because the Python 3.9 stdlib has no zstd), but not classified into the outcome classes above |
| swamp | only a repository you name: --swamp-root DIR reads that repo's .swamp/run_tracker.db, and swamp is reported while a run overlapped the window |
| agentsview | the local agentsview command, when it is installed: discover reports how many projects and sessions it holds, through one agentsview projects --json query. It is a second view of session history, never a log store, and the reports still read the harness logs. No daemon, no serve, no sync |
Swamp is opt-in. Swamp keeps run history per repository, in
<repo>/.swamp/run_tracker.db, and nothing on the machine lists the repositories
a person uses swamp in: ~/.swamp holds the toolchain, and
~/.config/swamp/workspaces.json is a list you fill in. So the tool never looks
for a swamp repo. Name one with --swamp-root DIR and that repository's own
tracker decides: a run that started before the window closed and finished after
it opened was in flight during the window. A store full of old runs is
installed, not running, and the report says nothing about it. Installed is not
traffic. The database is opened read-only, and swamp is never spawned.
When swamp does appear, the report describes its concurrency as configured (its extract and verify configuration, and where they came from). It never describes that concurrency as measured.
luna-doctor capacity serves a disk cache of the account's plan, priority concurrency and overflow capacity by default. The report keeps the two pools apart. The priority pool is the account's main width. The overflow pool holds the requests that a background tier takes, so a demoted request waits there. Each pool has its own occupancy and its own 7-day and 30-day rollups. The report never adds one pool to the other. It serves a cached payload even when that payload is stale, and the network stays untouched. Two flags can fetch, and each one is a single authenticated GET: capacity --online refreshes the capacity cache (5 minutes), and analyze --online / fix --online refresh the 24-hour model catalog at ~/.luna-doctor/catalog.json. Both use the routing key that lunaroute login already stored. Anything that cannot be fetched is reported as unknown, and never as an error.
Limits worth knowing
- Log records capture when a request started and when its record was written. They do not record time to first token. So
analyzemeasures end-to-end latency and classifies outcomes. The wait before headers is not in these logs. - Error records zero their token usage, so input size is unavailable on failures.
- Concurrency reconstructed from one machine is a lower bound. Other machines and other tenants are invisible.
Repo layout
| path | what |
|---|---|
luna_doctor/cli.py |
the CLI, the log readers and the analyser |
luna_doctor/_fix_block.py |
the fix command, kept apart so you can read its snippets on their own and make sure that they are right |
luna_doctor/_chart_block.py |
the chart command |
luna_doctor/report.py |
the report model and its plain renderer |
luna_doctor/render_pretty.py |
the decorated renderer over the same report |
luna_doctor/style.py |
the single decoration gate: color, emoji, motion |
luna_doctor/scene.py |
the chart's shape list, and the SVG renderer over it |
luna_doctor/png.py |
the raster renderer over the same scene |
luna_doctor/font.py |
the hand-drawn 5x7 bitmap font and its ASCII folding |
bin/luna-doctor |
launcher for the no-packaging path. It resolves its own symlink and imports the package |
skills/luna-doctor/ |
the agent skill: a router, five playbooks, four catalogues |
assets/ |
the two chart images above, each one written by luna-doctor chart, and the social preview, written by python3 scripts/titlecard.py --moon <screenshot> |
The package ships luna_doctor/, which is the CLI and its sibling modules.
cli loads _fix_block and _chart_block off disk from its own directory, so
a partial install is the one thing that breaks fix and chart. The skill, the
launcher in bin/ and the chart images stay in the repository. The skill is not
inside the wheel yet, so an agent that installs the tool from PyPI still reads
skills/luna-doctor/SKILL.md from this repository.
How this project is built
This project is developed using a Greenroom. The Greenroom is this public repo beside a private one that holds the design docs, drafts and review notes. That way, work can be shaped before it takes the stage. If you want to read the private greenroom repo, reach out and ask.
Greenroom is a skill you can use on your own projects:
- how it works: Announcing Greenroom
- the skill: github.com/jesserobbins/greenroom,
npx skills add jesserobbins/greenroom
Versioning
Semantic versioning with prerelease identifiers (0.1.1-alpha.1, 0.1.1-beta.1, …), single source of truth:
| what | where |
|---|---|
| version number | VERSION, mirrored in luna_doctor/cli.py |
| history | CHANGELOG.md (Keep a Changelog) |
| releases | annotated git tags, vX.Y.Z and vX.Y.Z-prerelease (e.g. v0.1.1-alpha.1), published to PyPI by scripts/publish.sh |
| JSON document shape | "schema": 4 in every --json envelope: bumped independently when the shape changes |
| measured gateway facts | "contract": {...} in every --json envelope |
Prereleases publish to PyPI. The index keeps every uploaded file forever, and a bad one is yanked rather than deleted, so pin an exact version in automation.
Publishing needs a PyPI token in PYPI_TOKEN, or in ~/.config/luna-doctor/pypi-token.
scripts/publish.sh builds the tagged release, uploads it and reads the index back to
confirm that the version is live. It publishes nothing without a tag and a clean tree.
Every --json document carries schema, version, and command. The reporting commands (discover, analyze, fix, chart, capacity) also carry contract, so a saved report stays readable after the tool moves on. While the project is prerelease, schema is bumped freely, because the envelope has no stable consumers to protect yet. Usage errors print to stderr and exit 2 with no JSON document.
Bumping a version updates the number in both places, opens a dated changelog section, and prints the tag and push commands. It never pushes:
scripts/release.sh patch       # 0.1.1 -> 0.1.2
scripts/release.sh 0.1.1-beta.1 # explicit
Tests are stdlib-only and read-only (they never open live sessions on the gateway):
python3 -m unittest discover -s tests -v
1 maintainer

Metadata
1 maintainer
Release files for luna-doctor 0.3.0a6
For a detailed explanation of source distributions (sdists) and built distributions (wheels), please see the package formats documentation.
Source distribution (sdist)
| File | Size | Uploaded | Provenance | Actions |
|---|---|---|---|---|
| luna_doctor-0.3.0a6.tar.gz | 290.5 kB | Without provenance | Details for luna_doctor-0.3.0a6.tar.gz |
Built distribution (wheel)
| File | Interpreter | ABI | Platform | Actions Reset |
|---|---|---|---|---|
| luna_doctor-0.3.0a6-py3-none-any.whl | Python 3 | none | any | Details for luna_doctor-0.3.0a6-py3-none-any.whl |
Total release size: 473.9 kB
Release files / luna_doctor-0.3.0a6.tar.gz
| Download URL | luna_doctor-0.3.0a6.tar.gz |
|---|---|
| Size | 290.5 kB |
| Tags | Source |
|
SHA-256 checksum How to use checksums |
64bf0a7b228d196b111638f05263e12b007ac6f1c90da19f8ab4110ed4bb0c7a
|
|
BLAKE2b-256 checksum How to use checksums |
d293511e532708c36f99a6a671bf6dba492031db86e23ff3e1a71112d4292f59
|
| Upload date | |
|
Uploaded using Trusted Publishing? What is trusted publishing? |
No |
| Uploaded via |
uv/0.13.6 {"installer":{"name":"uv","version":"0.13.6","subcommand":["publish"]},"python":null,"implementation":{"name":null,"version":null},"distro":{"name":"macOS","version":null,"id":null,"libc":null},"system":{"name":null,"release":null},"cpu":null,"openssl_version":null,"setuptools_version":null,"rustc_version":null,"ci":null}
|
Release files / luna_doctor-0.3.0a6-py3-none-any.whl
| Download URL | luna_doctor-0.3.0a6-py3-none-any.whl |
|---|---|
| Size | 183.4 kB |
| Tags | Python 3 |
|
SHA-256 checksum How to use checksums |
9510c5f3878ad9523732f732327ca2ba3fd06563825255e1c7c22eb8ed499029
|
|
BLAKE2b-256 checksum How to use checksums |
6c262d821882d4e6e20992503164d8d523d14eeb1ce439f32293c75c9043810a
|
| Upload date | |
|
Uploaded using Trusted Publishing? What is trusted publishing? |
No |
| Uploaded via |
uv/0.13.6 {"installer":{"name":"uv","version":"0.13.6","subcommand":["publish"]},"python":null,"implementation":{"name":null,"version":null},"distro":{"name":"macOS","version":null,"id":null,"libc":null},"system":{"name":null,"release":null},"cpu":null,"openssl_version":null,"setuptools_version":null,"rustc_version":null,"ci":null}
|
Security for luna-doctor 0.3.0a6
Provenance
Provenance describes where a file came from. On PyPI, provenance is shared via attestations, which provide a verifiable record of the build or publishing details. View details, limitations and caveats.
No provenance found
None of the files in this release were uploaded with provenance metadata.
A note on package security
PyPI is a repository for distributing packages, not a service for auditing them. While third-party security researchers and our staff do their best to detect and remove malicious packages, PyPI cannot guarantee the quality, security or suitability of any given package.
To learn more about protecting yourself from malicious actors, visit our package security documentation.














