
manim-radar
Animated radar (spider) charts for Manim — build one, morph it into another, or play a whole sequence with a single command.




from manim import *
from manim_radar import RadarChart, DeepSpace, set_scene_background

AXES = ["Speed", "Power", "Range", "Comfort", "Price", "Safety"]

class Demo(Scene):
    def construct(self):
        set_scene_background("midnight")
        chart = RadarChart(axes=AXES, values=[8, 6, 7, 9, 5, 8], title="Six axes")

        self.add(DeepSpace().link(chart))              # optional starfield
        self.play(chart.reveal())                      # grow out of the centre
        self.play(chart.morph_to([5, 9, 5, 6, 9, 9],   # one command = one morph
                                 color="#FFB74D"))
        self.play(chart.disappear())
manim -qh demo.py Demo # 1080p60
Install
pip install manim_radar
Requires Python ≥ 3.9, manim >= 0.18 and numpy. pip pulls those in for you.
Features
| One command morphing | chart.morph_to(...) tweens values, full scale, colour, emphasis outline and opacity in a single pass |
| Seven transition presets | smooth, dip, shockwave, zoom, glitch, stepped, burst (new in 0.1.1) — plus every knob to fine-tune them |
| Multi-dataset comparison | datasets=[dA, dB]: several polygons share one grid, morph and reel together (new in 0.1.1) |
| Overflow radar | OverflowRadarChart: values above the full scale stab beyond the ring — dashed track, breach glow, true read-out (new in 0.1.1) |
| Camera language | chart.push_in() / pull_out(), or a true-camera CameraRig for MovingCameraScene (new in 0.1.1) |
| One command sequences | RadarReel(chart, snapshots).play_on(self) plays a whole reel, black gaps included |
| 3 styles × 5 themes | neo (glow / rainbow outline / sweep beam), classic (the lean 1.0 look), minimal (light themes, reports) |
| Odometer numbers | digits roll continuously instead of snapping, with automatic 10+ overflow labels |
| Real Manim mobjects | the chart is a VGroup: shift / move_to / scale / rotate / FadeIn / FadeOut all behave |
| Deep-space backdrop | DeepSpace adds a radial glow, corner vignette, nebula blobs and drifting stars that tint with the chart |
| Two generations included | RadarV1Scene and RadarV2Scene rebuild the original 1.0 and 2.0 reels from the library |
| Cross-platform fonts | picks the first installed CJK / monospace font, works on macOS, Linux and Windows |
Demos
Every GIF below was rendered straight from the matching example scene
(manim -ql + ffmpeg); they all live in docs/.
 |
0.1.1 feature showcase — multi-dataset comparison, overflow spikes and camera moves. examples/10_showcase.py |
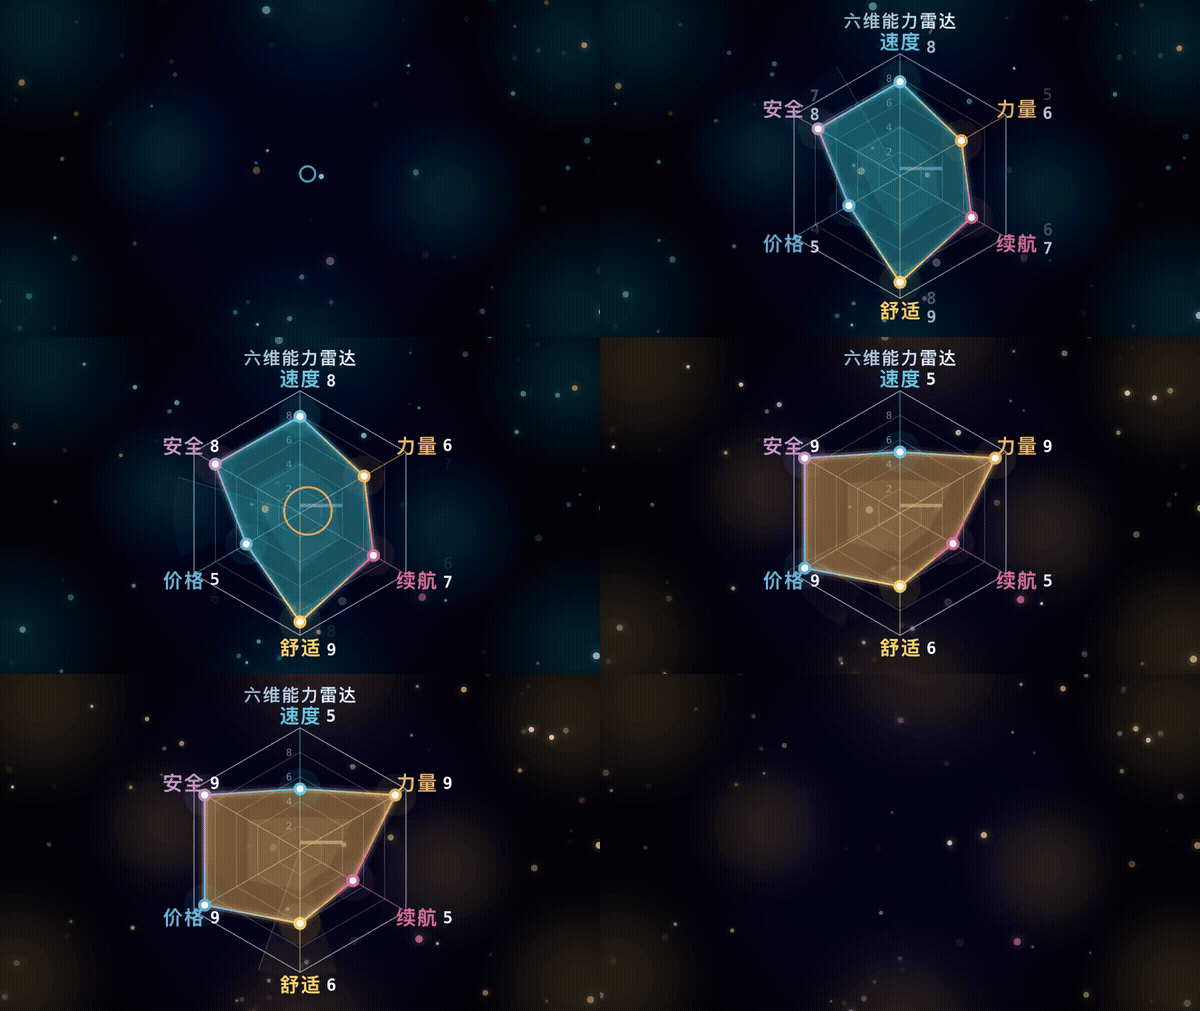 |
Quickstart — build → reveal → morph → fade, in ten lines. examples/01_quickstart.py |
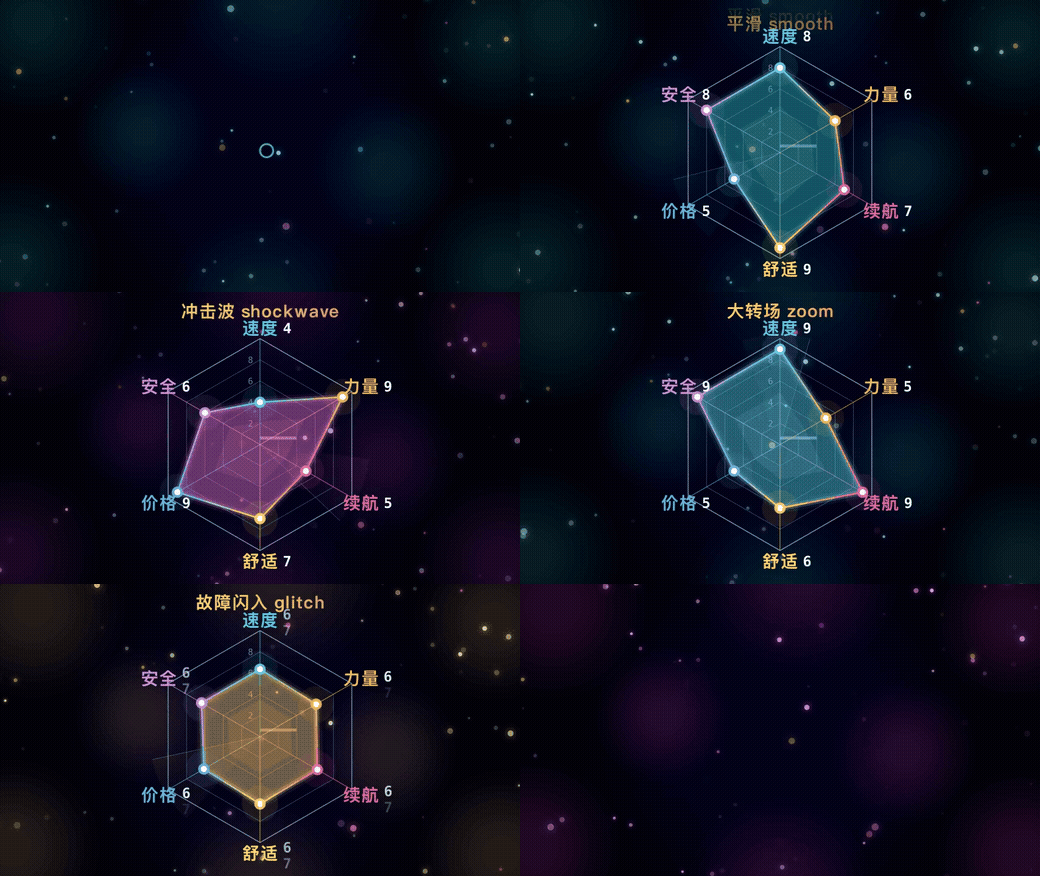 |
Transitions — smooth / shockwave / zoom / glitch / rim. examples/02_morph_gallery.py |
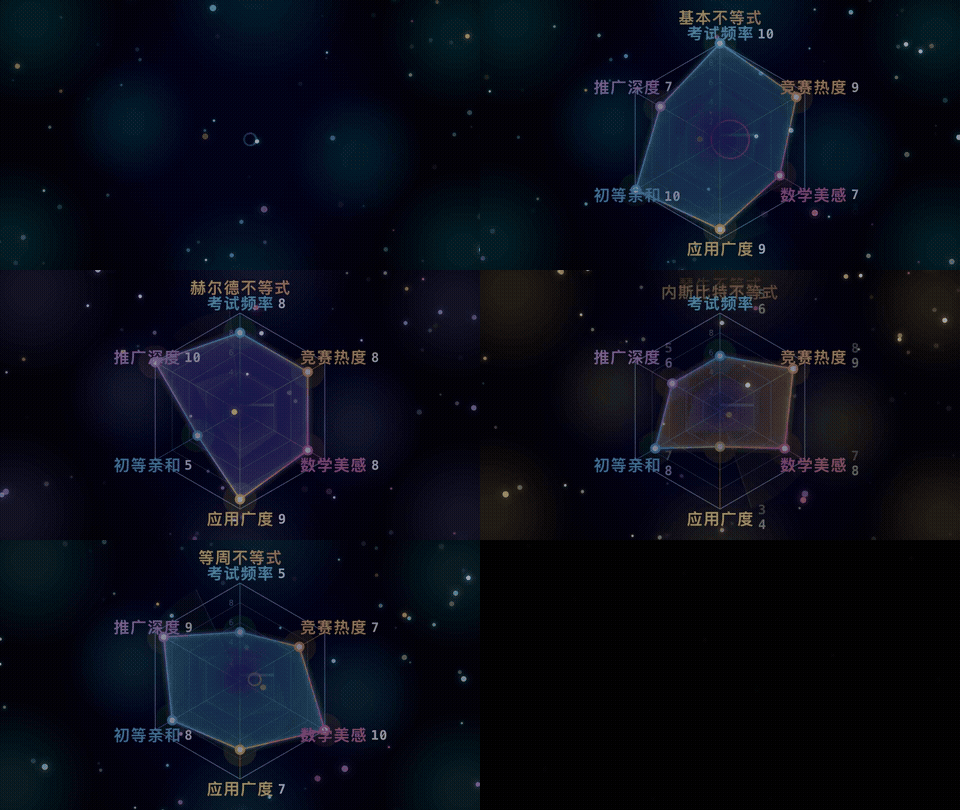 |
One-command reel — a whole sequence, black gap included. examples/03_reel.py |
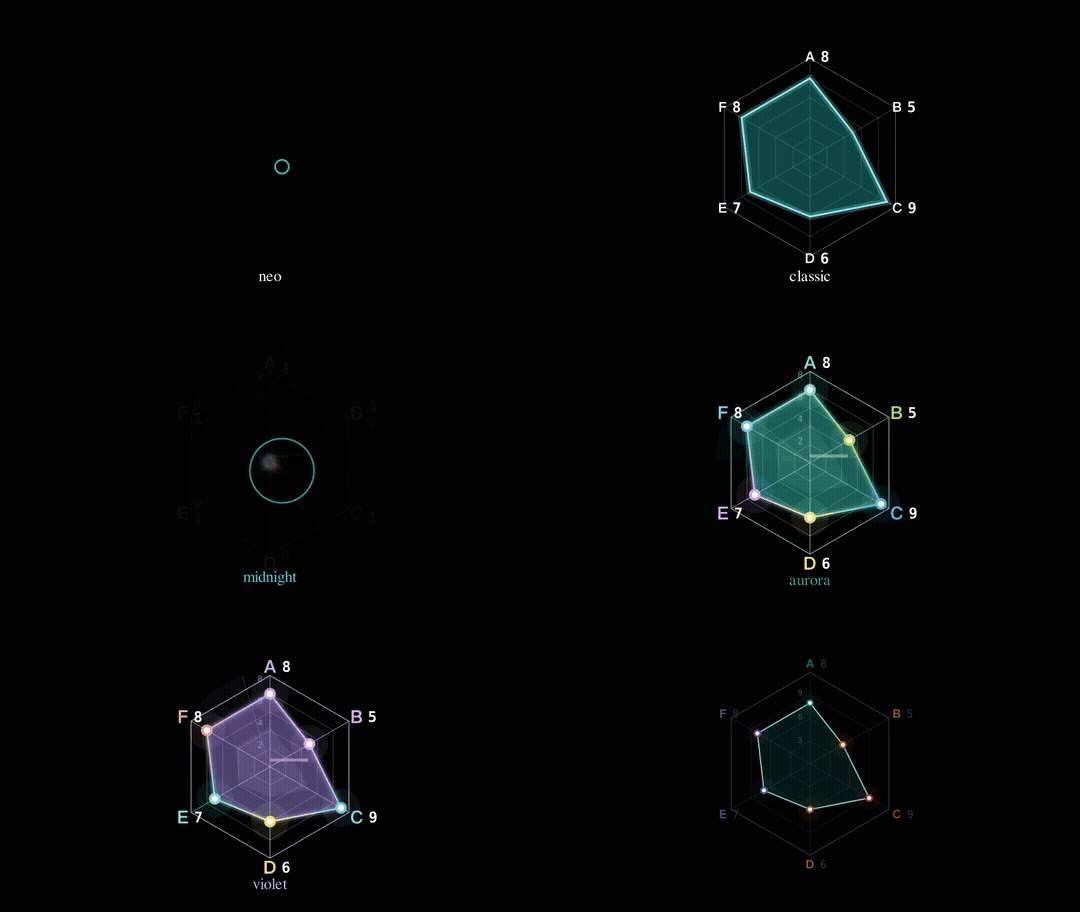 |
3 styles × 5 themes — from neo glow to a light paper report. examples/04_styles_themes.py |
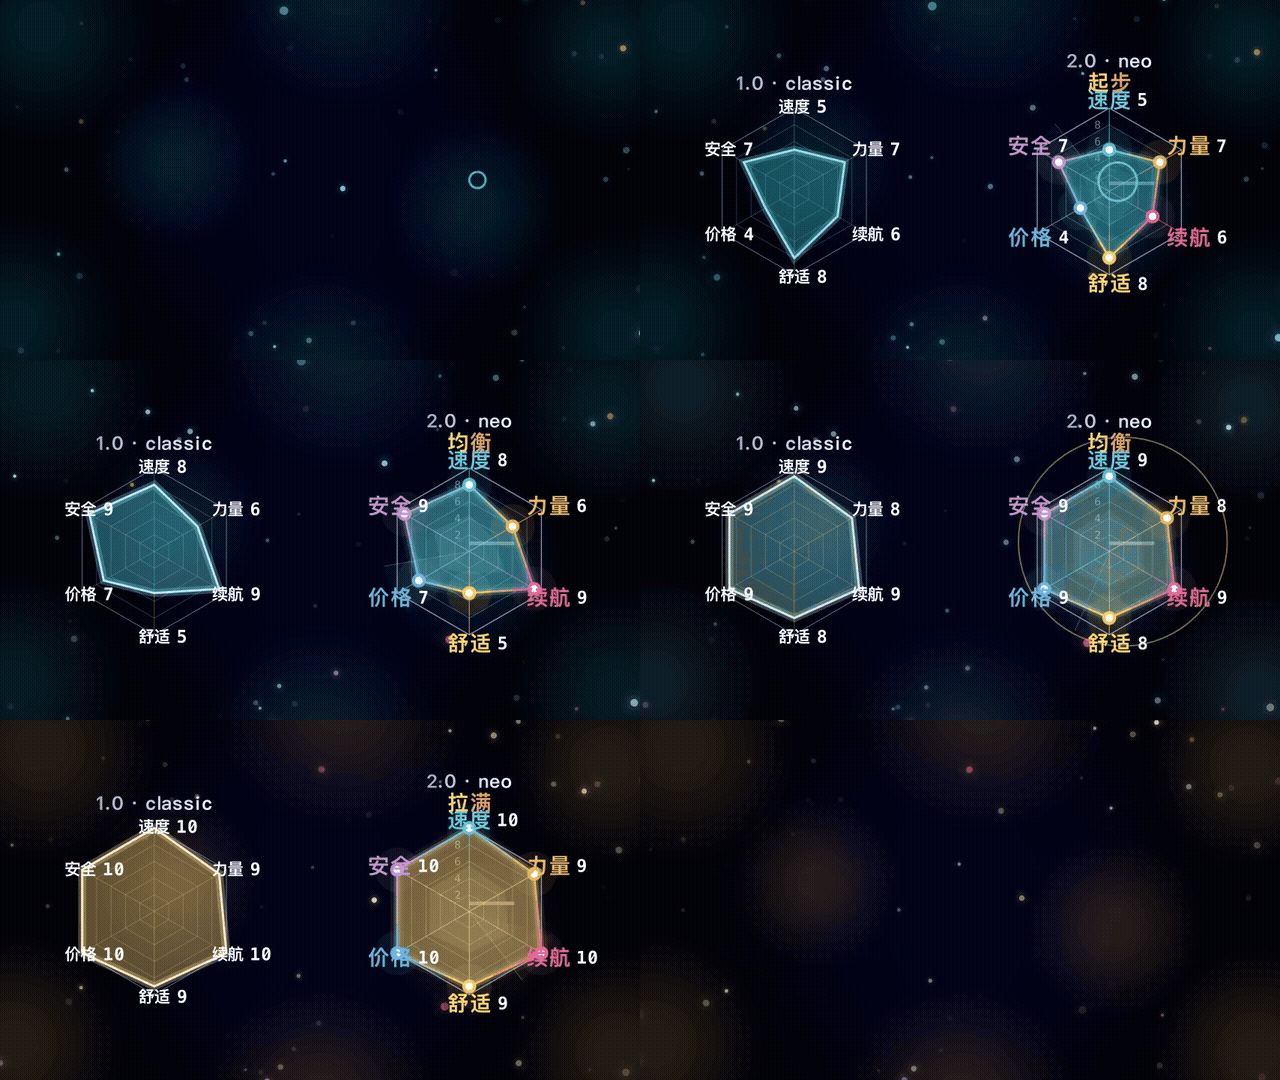 |
The two generations — classic (1.0) vs neo (2.0), same data. examples/05_two_styles.py |
New in 0.1.1
Multi-dataset comparison
A 0.1.0 chart carried a single dataset; 0.1.1 charts can compare two inequalities — two game builds, two models — on one grid:
holder = RadarData(axes=AXES, values=[8, 9, 10, 4, 9, 7], name="Hölder",
                   color="#17B8BA", max_value=10)
basic  = RadarData(axes=AXES, values=[10, 6, 5, 10, 7, 9], name="AM–GM",
                   color="#E868C8", max_value=10)

chart = RadarChart(datasets=[holder, basic], radius=2.4)
self.play(chart.reveal())

# morph every dataset at once (stagger = per-dataset wave delay)
self.play(chart.morph_to([holder_next, basic_next], stagger=0.15))

chart.focus(0)              # highlight dataset 0, dim the rest
chart.highlight_gap(0, 1)   # tint the crescent gap, each lobe in the winner's colour
chart.clear_gap()
- Comparisons draw a legend (colour chip + name pills, auto-wrapped).
- Per-axis numbers have four modes via
compare_numbers=:"legend"(default — cleanest),"all"(small coloured numbers at every vertex),"first","focus"(followschart.focus(i)). - The full scale is the largest of the snapshots', so all datasets read from the same ruler.
RadarReelaccepts comparison steps — pass a list ofRadarDataper step and the reel morphs them together.
OverflowRadarChart (the boundary-breaking chart)
Values above the full scale are no longer clamped to "10+" — they stab
beyond the outer ring:
from manim_radar import OverflowRadarChart

chart = OverflowRadarChart(axes=AXES, values=[8, 6, 14, 9, 5, 8],
                           max_value=10, name="Berserker", color="#F040E0")
self.play(chart.burst_in())                     # stab out of the centre
self.play(chart.morph_to([7, 9, 17, 6, 8, 5]))  # burst transition by default
- overflowing axes grow a dashed track; the polygon stays filled;
- a glowing breach marks where the spike pierces the ring;
- overflow read-outs show the true value (14, 17…) riding the spike;
transition="burst": values gather low, then stab past the target and settle back — plain charts can use it too;- comparisons overflow as well:
OverflowRadarChart(datasets=[dA, dB], max_value=10)— every dataset gets its own spikes, tracks, breaches and read-outs (seeexamples/10_showcase.py, the promo reel).
Camera language
# plain Scene: the chart scales about its own centre
self.play(chart.push_in(factor=1.35, run_time=0.8))
self.play(chart.pull_out(factor=1.35, run_time=0.8))

# MovingCameraScene: a true camera (the starfield breathes too)
from manim_radar import CameraRig

class MyScene(MovingCameraScene):
    def construct(self):
        rig = CameraRig(self)
        self.play(rig.push_in(chart, factor=1.4))
        self.play(rig.focus_point(peak_vertex, factor=1.6))
        self.play(rig.pull_out())
        chart.attach_camera(rig)   # burst morphs now auto-push towards the spike
See examples/07_compare.py, examples/08_overflow.py, examples/09_camera.py.
The three objects
from manim_radar import RadarChart, RadarData, RadarReel
RadarData — one snapshot: the axes and the value on each of them.
RadarData(
    axes=["A", "B", "C", "D", "E", "F"],
    values=[8, 6, 7, 9, 5, 8],
    name="Model A",        # optional nameplate (morphed on every transition)
    color="#17B8BA",       # optional main colour (else the theme palette cycles)
    max_value=10,          # optional full scale; above it values render as "10+"
    emphasis="rim",        # "zoom" | "gap" | "rim" — used by RadarReel
    hold=0.6,              # seconds to hold on this snapshot (RadarReel)
    transition="glitch",   # per snapshot transition override
)
RadarChart — the mobject.
chart = RadarChart(data_or_axes=..., style="neo", theme="midnight", radius=3.2)

chart.set_values([1, 2, 3, 4, 5, 6])   # instant, no animation
chart.set_main_color("#E868C8")
chart.set_rim(1.0)                     # orange/cyan emphasis outline
chart.set_radius(2.4)
chart.attach_backdrop(self)            # shortcut for DeepSpace().link(chart)

self.play(chart.reveal())              # intro
self.play(chart.morph_to(other))       # the money shot
self.play(chart.glitch_in())           # glitchy re-entrance
self.play(chart.disappear())           # outro
RadarReel — the whole sequence in one line.
RadarReel(
    chart,
    snapshots=[d1, d2, d3, d4],   # list[RadarData]
    hold=0.6,                     # default hold per snapshot
    transition="shockwave",       # default transition
    backdrop=True,                # starfield, auto-tinted
    gap_hold=1.5,                 # length of a snapshot's "gap" black-out
).play_on(self)
Transitions
transition= |
What it does |
|---|---|
None (default) |
dip below the target, then roll up (the signature neo move) |
"smooth" |
straight tween, no dip |
"shockwave" |
dip + an expanding ring that covers the shape change |
"zoom" |
shockwave + zoom & dim, then snap back (the "big transition") |
"glitch" |
chromatic split + flicker while the values change |
"stepped" |
values snap in integer steps (the classic feel) |
self.play(chart.morph_to(target, transition="zoom", run_time=1.6))
Styles and themes
chart = RadarChart(data, style="neo",       theme="midnight")
RadarChart(data, style="classic")           # the 1.0 look
RadarChart(data, style="minimal", theme="paper")   # light background
- Styles change structure:
neo,classic,minimal(seeSTYLES). - Themes change colours:
midnight,aurora,ember,violet,paper.
Everything is a dataclass, so you can start from a preset and tweak:
from manim_radar import RadarChart, RadarConfig, RadarTheme

cfg = RadarConfig(radius=2.4, levels=4, numbers="swap", sweep=False, rainbow_edges=False)
theme = RadarTheme(name="mine", grid="#8899AA", axis_colors=("#5EEAD4", "#F0ABFC") * 3)
chart = RadarChart(data, config=cfg, theme=theme)
RadarConfig() has ~60 documented fields: geometry, grid, polygon layers, fonts and
sizes, decorations, transition timings, title/nameplate placement. RadarTheme
holds every colour (grid, per-axis colours, palette, rims, star accents…).
Reuse inside a bigger scene
Reveal a chart, then morph it while you write something else beside it:
chart = RadarChart(AXES_DATA, radius=2.2)
chart.move_to(LEFT * 3.4)
self.play(chart.reveal())
self.play(chart.morph_to(next_data), Write(my_formula))
Because the chart is a plain VGroup whose geometry is recomputed in its own
coordinate frame every frame, moving or scaling it never breaks the drawing.
Backdrop
from manim_radar import DeepSpace, set_scene_background

set_scene_background("midnight")           # flat background colour of the theme
backdrop = DeepSpace(theme="midnight", star_count=80, nebula_count=8)
backdrop.link(chart)                       # nebula / halos follow the chart colour
self.add(backdrop)
The two generations
Both original looks ship as ready-to-run scenes, built on the same library:
manim -qh examples/legacy_v1.py RadarV1Scene   # 1.0 : lean grid, snap-in numbers
manim -qh examples/legacy_v2.py RadarV2Scene   # 2.0 : glow, rainbow outline, shockwaves
They play the bundled 23-snapshot demo reel (manim_radar.legacy.REPLICA_TIMELINE).
CLI
manim-radar --version
manim-radar themes                  # list colour themes
manim-radar styles                  # list style presets
manim-radar template my_chart.py    # write a starter scene
manim-radar demo --render           # render the bundled demo reel
Rendering
manim -ql scene.py MyScene      # 480p15, fast preview
manim -qh scene.py MyScene      # 1080p60, final
If you are driving Manim from another tool, pass --media_dir to keep the render
cache out of your source tree.
Publishing notes
The package is a standard PEP 621 project using hatchling:
python -m build            # -> dist/manim_radar-<version>-py3-none-any.whl + .tar.gz
twine check dist/*         # optional sanity check
twine upload dist/*        # or use the Release workflow (PyPI Trusted Publishing)
The distribution is registered as a Manim plugin (manim.plugins entry point), so
manim plugins lists it once installed.
License
MIT — see LICENSE.
Also by the same author: manim-handdraw
(turn line art into progressive hand-drawn animation).
1 maintainer

Release files for manim-radar 0.1.1
For a detailed explanation of source distributions (sdists) and built distributions (wheels), please see the package formats documentation.
Source distribution (sdist)
| File | Size | Uploaded | |
|---|---|---|---|
| manim_radar-0.1.1.tar.gz | 71.0 kB | Details |
Built distribution (wheel)
| File | Interpreter | ABI | Platform | Reset |
|---|---|---|---|---|
| manim_radar-0.1.1-py3-none-any.whl | Python 3 | none | any | Details |
Total release size: 128.1 kB
Release files / manim_radar-0.1.1.tar.gz
| Download URL | manim_radar-0.1.1.tar.gz |
|---|---|
| Size | 71.0 kB |
| Tags | Source |
|
SHA-256 checksum How to use checksums |
8d47f3a83eb4117e79e7f36193dad8e4092f0432117baf137fc795fee62cb57c
|
|
BLAKE2b-256 checksum How to use checksums |
3ebaba939e3ef29226abd9dcc71e7cbb85578e4256179710d3c96b99a2061613
|
| Upload date | |
|
Uploaded using Trusted Publishing? What is trusted publishing? |
Yes |
| Uploaded via |
twine/7.0.0 CPython/3.13.14
|
Provenance
Provenance describes where a file came from. On PyPI, provenance is shared via attestations, which provide a verifiable record of the build or publishing details. View details, limitations and caveats.


PyPI Publish Attestation
PyPI verified that this artifact, at this checksum, originated from the publisher listed below.
Signed by GitHub Actions, verified by PyPI on Sep 25, 2026.
Transparency logRelease files / manim_radar-0.1.1-py3-none-any.whl
| Download URL | manim_radar-0.1.1-py3-none-any.whl |
|---|---|
| Size | 57.1 kB |
| Tags | Python 3 |
|
SHA-256 checksum How to use checksums |
2b5fcfd9cb5af29a50768a0efbb5ada1aae1cf465a58446dba2477457a854de7
|
|
BLAKE2b-256 checksum How to use checksums |
9df6534a83a30f8712519168e08d18ae4b1352276030597bfe20dc9026bee486
|
| Upload date | |
|
Uploaded using Trusted Publishing? What is trusted publishing? |
Yes |
| Uploaded via |
twine/7.0.0 CPython/3.13.14
|
Provenance
Provenance describes where a file came from. On PyPI, provenance is shared via attestations, which provide a verifiable record of the build or publishing details. View details, limitations and caveats.
PyPI Publish Attestation
PyPI verified that this artifact, at this checksum, originated from the publisher listed below.
Signed by GitHub Actions, verified by PyPI on Sep 25, 2026.
Transparency log













