
mapcraft





Your map is probably a population map.
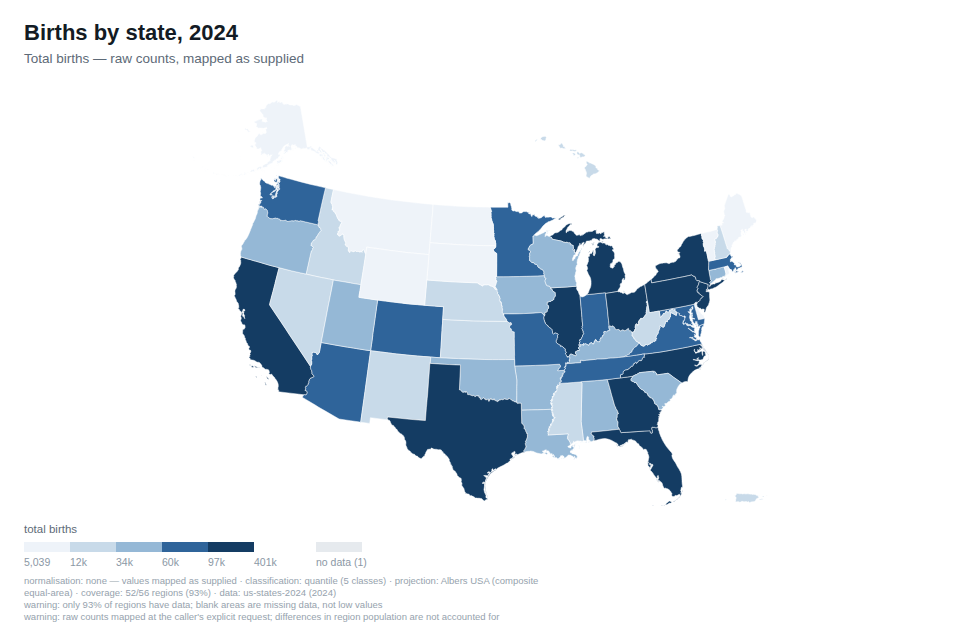
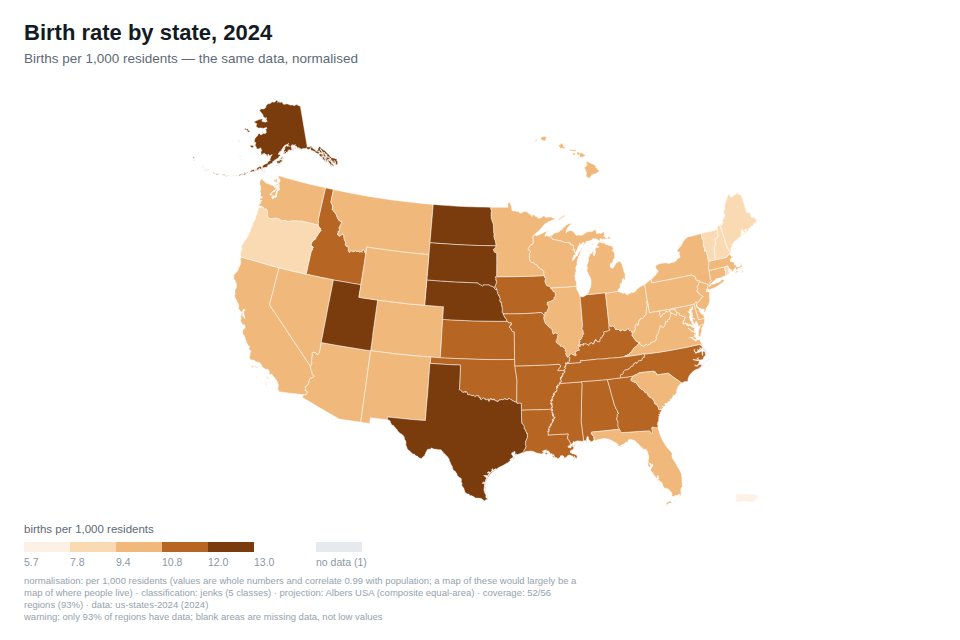
Same US Census file. Same states. Same projection. The only difference is that the right-hand map divides by population.
On the left, California, Texas, Florida, New York and Ohio are darkest — because that is where people live. On the right, Utah, the Dakotas, Nebraska and Alaska lead. Only one of the top six states survives the change.
The numbers, from public-domain Census data you can re-derive yourself:
| correlation(raw births, population) | 0.9921 — the left map is 99.2% a population map |
| correlation(birth rate, population) | 0.0616 — the right map is independent of population |
| top-6 states in common | 1 of 6 |
Mapping raw counts across regions of different size is the most common error in thematic mapping, and it is invisible: the map renders cleanly, looks authoritative, and answers a question nobody asked.
mapcraft makes that decision, and the several others a choropleth needs,
correctly — and prints every one of them on the map.
pip install mapcraft
import mapcraft

svg = mapcraft.choropleth(
    {"01001": 12.4, "01003": 11.8, ...},   # or "CA", "California", 1001, "IND"
    pack="us-counties-2021",
    title="Birth rate by county, 2021",
    unit="births per 1,000 residents",
    normalize=True,
)
What it refuses to draw
Most libraries draw whatever you give them. This one raises instead, because each of these produces a map that misleads while looking finished.
>>> mapcraft.choropleth(births_by_county, pack="us-counties-2021")
UnnormalizedCounts: These values look like raw counts: values are whole numbers
and correlate 0.99 with population; a map of these would largely be a map of
where people live. Pass normalize=True to map a rate, or normalize=False if the
absolute magnitude is genuinely what you mean to show.
| Refusal | Why |
|---|---|
UnnormalizedCounts |
Counts across unequal populations draw a population map — or the sample is too small to tell counts from rates, in which case it asks rather than guesses |
DuplicateRegion |
"CA" and "California" are one state — keeping the last row silently discards data |
AmbiguousKey |
"Orange" names counties in eight states; guessing attributes data to the wrong place |
CoverageTooLow |
Under 95% coverage, blank regions read as zero rather than as missing |
Every refusal has an explicit override. None of them is the default.
The decisions it makes, and shows
Every map carries a footer stating exactly what was done:
normalisation: per 1,000 residents  ·  classification: jenks (5 classes)
projection: Albers USA (composite equal-area)  ·  coverage: 3141/3231 regions (97%)
data: us-counties-2021 (2021)
Normalisation — counts are detected by evidence, not by guessing at column names: whole numbers, plus either a high correlation with population or a large drop in spread once population is divided out. On real data those signals separate cleanly — county births reduce spread 14×, while sex ratio and population density stay below 1×.
Where this is honest about its limits: below about 20 regions, a
correlation estimate is too wide to conclude anything. Eight hand-picked
Indian states of genuine count data score 0.64 correlation and 0.37× reduction
— both of which read as "rate". Rather than guess, mapcraft says it cannot
tell and asks you to state which it is. It never quietly assumes.
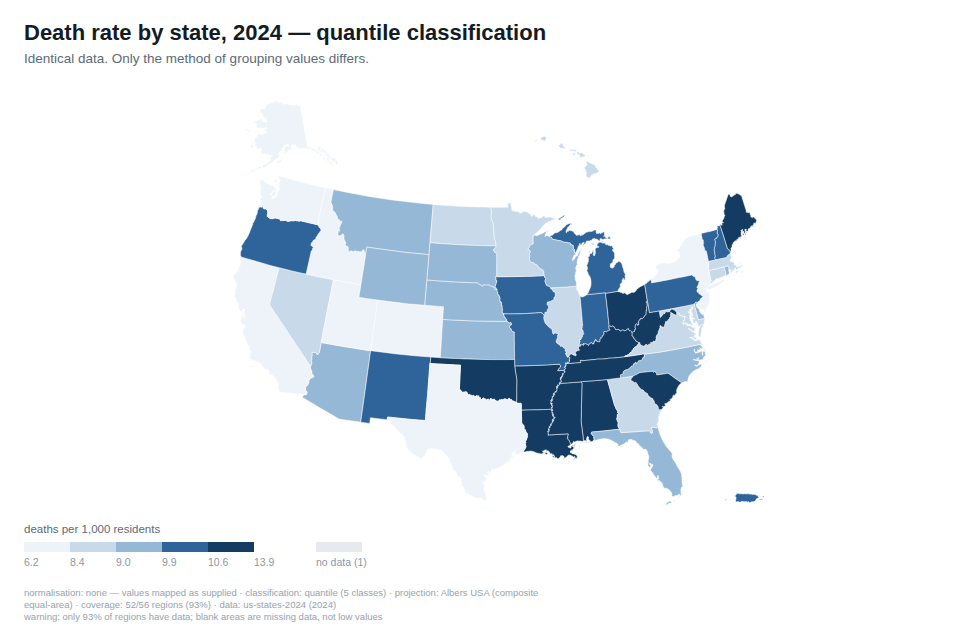
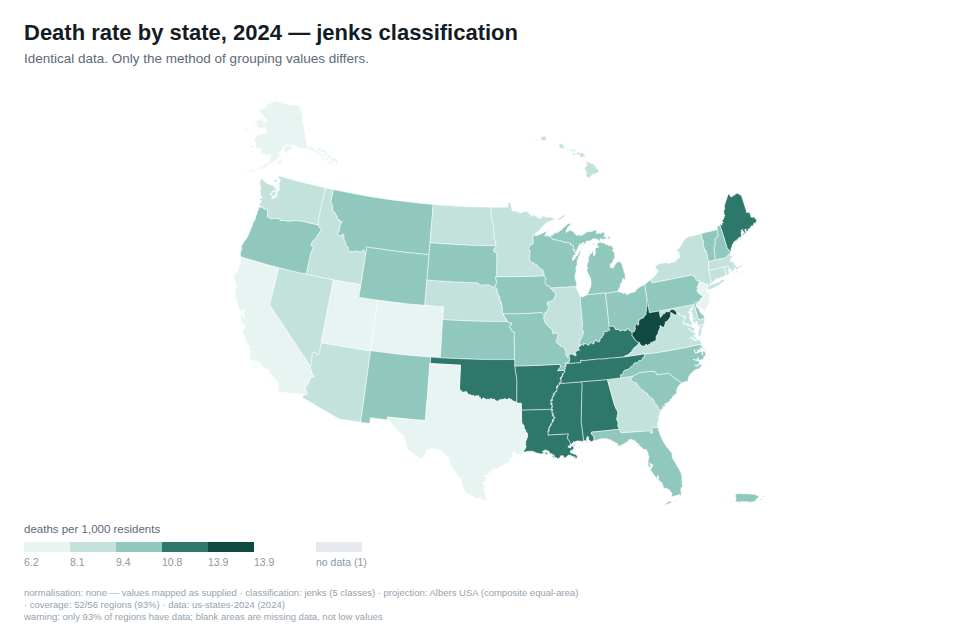
Classification — jenks by default, because natural breaks follow the
grouping the data actually has. quantile and equal_interval are available;
the choice is always stated, because it changes the conclusion.
Projection — always equal-area, because a choropleth asks the reader to compare coloured regions. Mercator inflates a region at 49°N to 1.92× the size of an equal one at 25°N; Albers and Mollweide measure 1.0000.
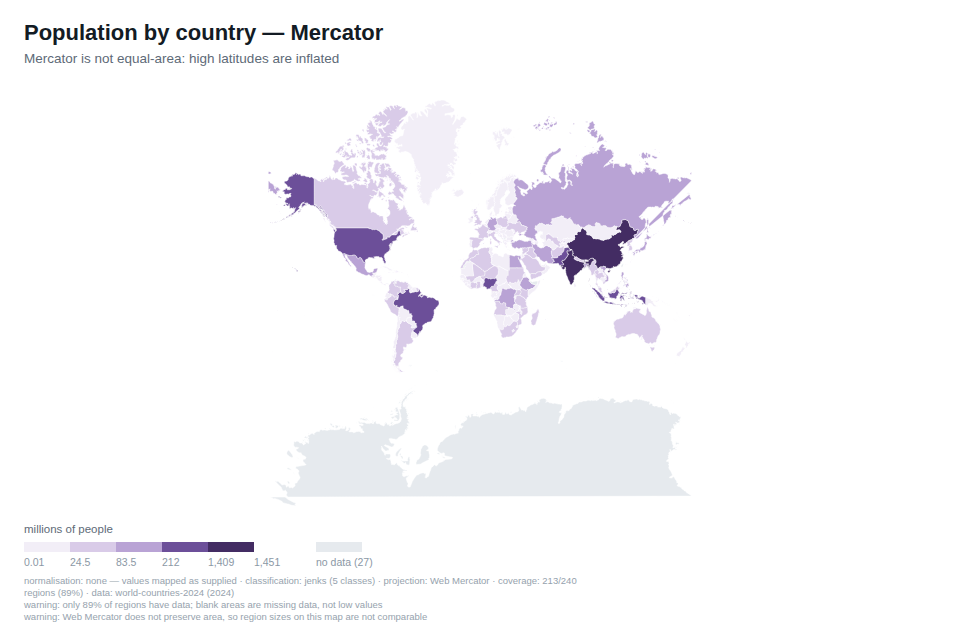
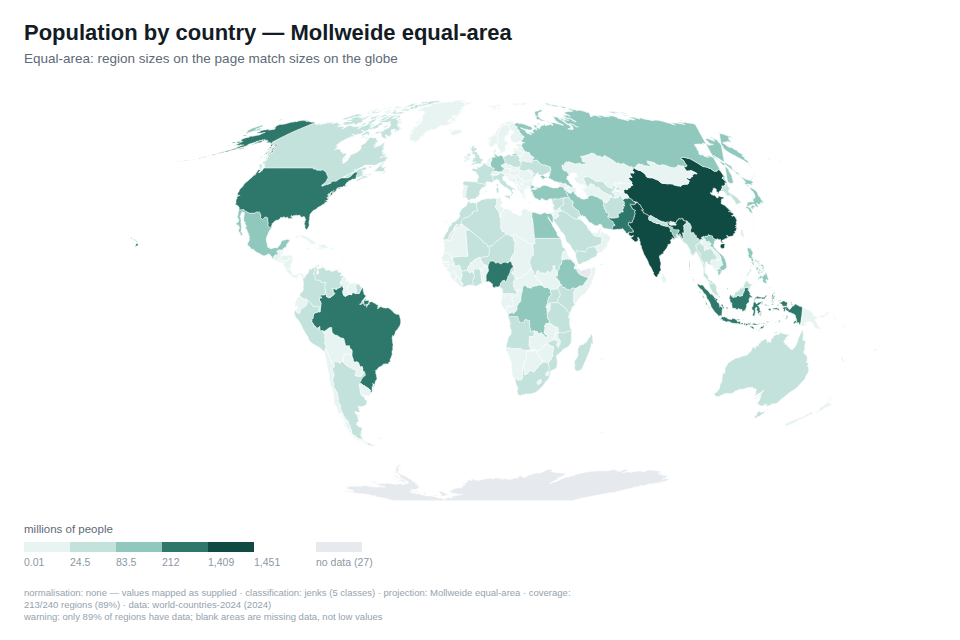
Colour — single-hue sequential ramps that stay readable with any colour vision deficiency, in greyscale, and in dark mode. There is no rainbow option, because rainbow ramps invent boundaries the data does not contain.
Keys just work
"06"  "CA"  "California"  6          # all resolve to California
"01001"  1001  "Autauga County, AL"  # all resolve to Autauga County
"IN"  "IND"  356  "India"            # all resolve to India
A key that lost its leading zero — a spreadsheet reading 01001 as 1001 —
is repaired and reported. Left unrepaired, that single quirk silently drops
every county in states 01–09 while the map still renders as a complete
United States.
Beyond the US
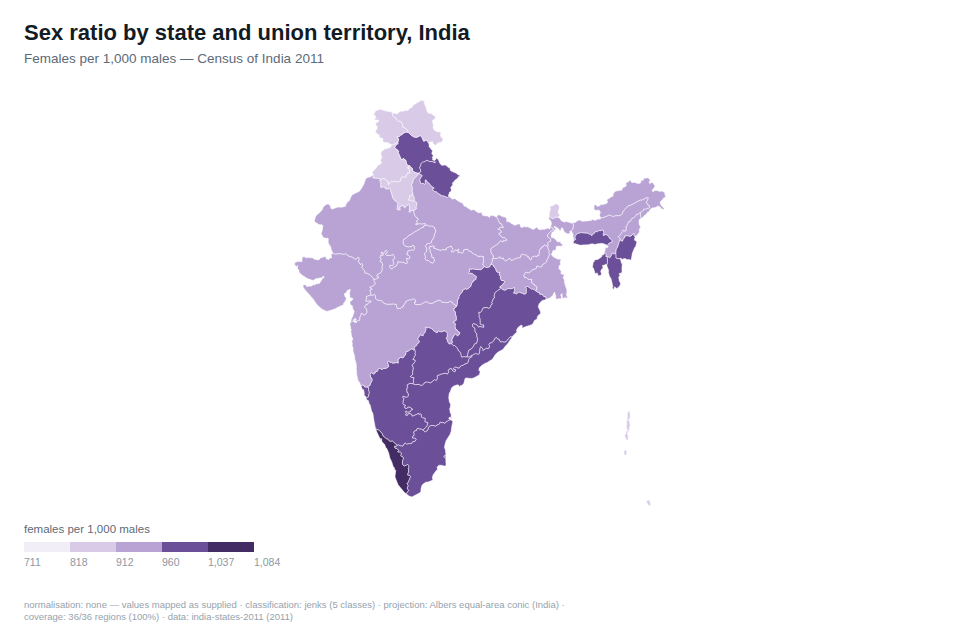
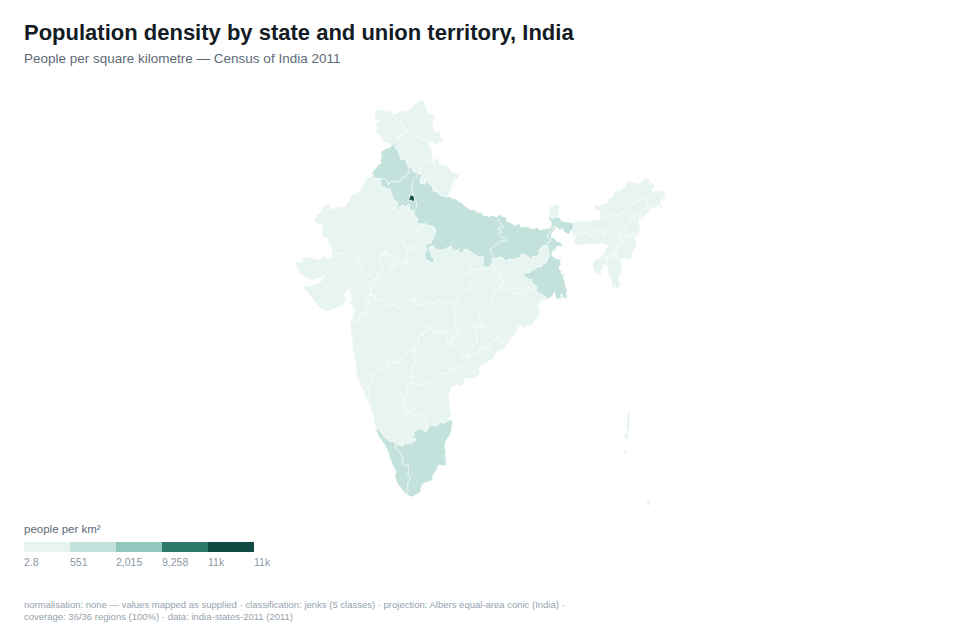
india-states-2011 covers all 36 states and union territories, keyed by ISO
3166-2 (IN-MH), short code (MH), or name — including the misspelling
"Telengana" that the population source uses. Boundaries follow the post-2019
reorganisation, with Ladakh separate and Dadra & Nagar Haveli merged with Daman
& Diu, and the population table matches that vintage, so every one of the 36
regions has a denominator.
Boundaries come from Natural Earth, whose depiction of disputed areas including Jammu & Kashmir and Arunachal Pradesh does not necessarily match the official position of the Government of India. This pack is not suitable for any use where the exact boundary is the subject.
Every county in the US
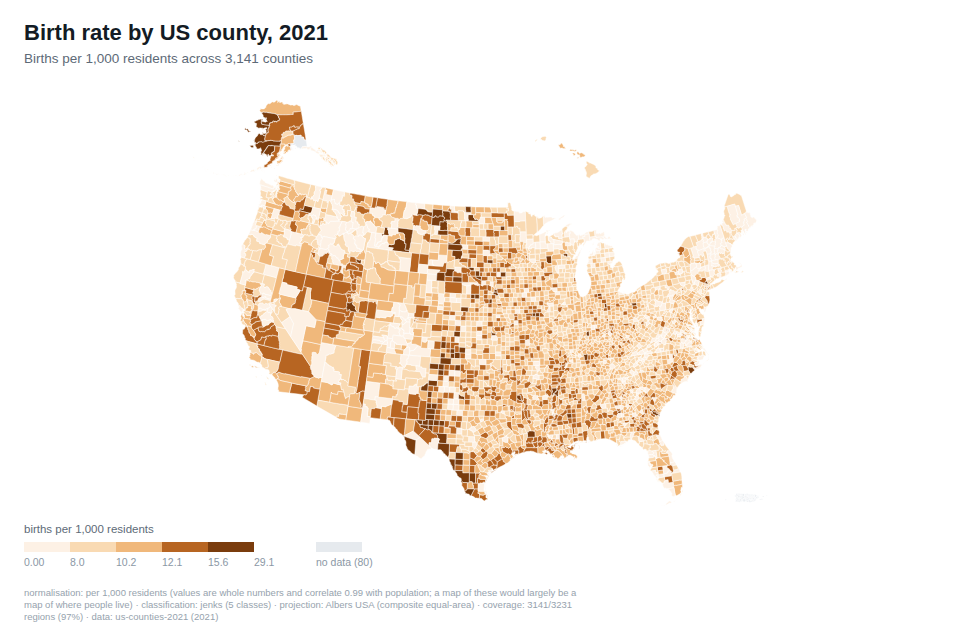
3,141 counties, normalised automatically, Alaska/Hawaii/Puerto Rico placed, 90 regions without population data drawn as explicit no-data and counted in the legend.
Command line
mapcraft births.csv --pack us-states-2024 --normalize yes \
  --title "Birth rate by state" --unit "per 1,000 residents" -o map.svg

mapcraft --list-packs
Use with a coding agent
SKILL.md in this repo is a ready-made agent skill. Point Claude Code, Codex,
or any agent at it and ask for a map; it will call the library rather than
writing its own drawing code.
Data
Bundled packs are built only from public-domain sources — US Census TIGER and Population Estimates, Natural Earth, World Bank. See DATA_SOURCES.md.
tools/build_pack.py rebuilds them byte-identically, so you can verify the
shipped packs came from the sources named:
SOURCE_DATE_EPOCH=1700000000 python tools/build_pack.py
md5sum mapcraft/packs/*.gz
Boundary and population vintages are pinned together. us-counties-2021
uses 2021 population with 2021 boundaries deliberately, not the newest
available: Connecticut replaced its counties with planning regions and Alaska
split Valdez–Cordova, so newer population with older boundaries would leave
those regions blank and divide some rates by the wrong denominator — silently.
GADM is excluded: its licence forbids redistribution and commercial use.
Install and test
pip install mapcraft            # no dependencies
python -m pytest                # 47 tests, numeric assertions only
Tests assert on break values, projected coordinates of known landmarks, coverage counts, and the equal-area invariant — not on rendered pixels.
Licence
MIT.
1 maintainer

Download files
Download the file for your platform. If you're not sure which to choose, learn more about installing packages.
Source Distribution
Built Distribution
Filter files by name, interpreter, ABI, and platform.
If you're not sure about the file name format, learn more about wheel file names.
Copy a direct link to the current filters
File details
Details for the file mapcraft-0.1.1.tar.gz.
File metadata
- Download URL: mapcraft-0.1.1.tar.gz
- Upload date:
- Size: 676.9 kB
- Tags: Source
- Uploaded using Trusted Publishing? No
- Uploaded via:
twine/7.0.0 CPython/3.12.3
File hashes
| Algorithm | Hash digest | |
|---|---|---|
| SHA256 |
cd8e229cf7678c4ec2646e824316acb4f791af87a25f2c96ad66cf4578c45e62
|
|
| MD5 |
02386e121418d93065a9f83266ff5daa
|
|
| BLAKE2b-256 |
f18208bffffc1b382cf9be64349c98d057c95053095c2525e59fdb2d699b3973
|
File details
Details for the file mapcraft-0.1.1-py3-none-any.whl.
File metadata
- Download URL: mapcraft-0.1.1-py3-none-any.whl
- Upload date:
- Size: 657.6 kB
- Tags: Python 3
- Uploaded using Trusted Publishing? No
- Uploaded via:
twine/7.0.0 CPython/3.12.3
File hashes
| Algorithm | Hash digest | |
|---|---|---|
| SHA256 |
348698dbcacf95e89e41c6977f16d06665f9e39851946ea23b8dd3628652ce90
|
|
| MD5 |
5fb7f245368e28ce469a740fa0433b90
|
|
| BLAKE2b-256 |
a98b4e2d160c5abab6eed8c6a84f5fe0d5fc0cd49757034af6efb9bc5f31e648
|














