
marimo-chem-widgets
Structure viewers for chemistry notebooks, built as anywidget widgets — they run in marimo, Jupyter, VS Code, and anywhere else ipywidgets render.
| Widget | What it is |
|---|---|
MolGrid |
a mols2grid-style paginated grid of depictions |
MolScatter |
a chemical-space scatter plot whose hover tooltip is the structure |
MolList |
a scrollable single-select column of structures |
MolMasterDetail |
cluster centers on the left, their members on the right |
They compose: a scatter selection can feed a grid, and a master column can drive one. Depictions are drawn by RDKit in the kernel, on demand — one page, one hovered point — so a large DataFrame costs no more to display than a small one.
Install
uv pip install git+https://github.com/PatWalters/marimo-chem-widgets   # from GitHub
uv pip install -e .                                                    # from a checkout
Needs Python 3.10+, rdkit, pandas, and anywidget. polars frames work too
(anything with a to_pandas()).
Demo notebooks
Three demos come with it. Each one runs in the cloud on molab with nothing to install — click a badge:
| Notebook | What it shows | Run it |
|---|---|---|
demo_molgrid.py |
the grid, 46 drugs |  |
demo_molscatter.py |
a 256-compound library in t-SNE space | |
demo_master_detail.py |
Butina clusters → members | |
Each notebook's script header installs the widgets straight from this repo, so molab needs no setup. To run them from a checkout instead:
uv run marimo edit demo_molgrid.py         # the grid, 46 drugs
uv run marimo edit demo_molscatter.py      # a 256-compound library in t-SNE space
uv run marimo edit demo_master_detail.py   # Butina clusters -> members
MolGrid
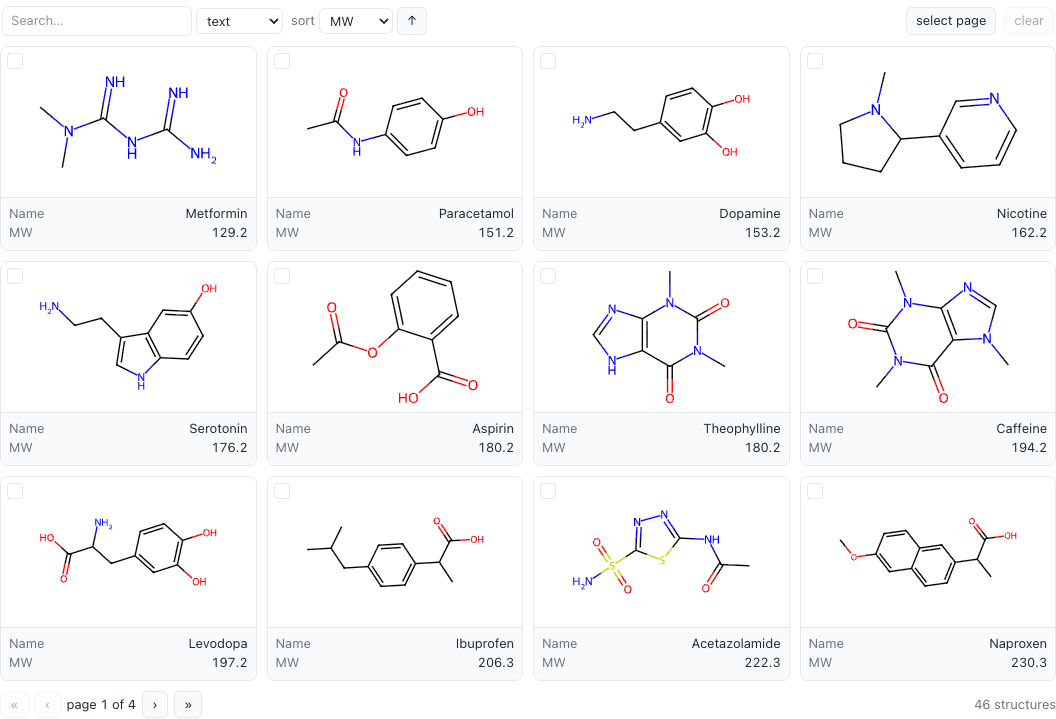
import marimo as mo
import pandas as pd
from marimo_chem_widgets import MolGrid

df = pd.read_csv("compounds.csv")   # SMILES, Name, MW, cLogP, ...

grid = mo.ui.anywidget(
    MolGrid(
        df,
        smiles_col="SMILES",
        subset=["Name", "MW"],           # printed under each structure
        tooltip=["cLogP", "TPSA"],       # revealed on hover
        n_cols=4,
        n_rows=3,                        # 12 per page; the footer paginates
        sort_by="MW",
        format={"MW": ".1f"},
    )
)
grid
Then, in another cell:
grid.widget.get_selection() # the rows the user clicked
What it does
- Pagination —
n_rows×n_colsper page, a pager for the rest. Only the visible page is drawn. - Selection — click a card to toggle it; the selection survives paging,
sorting, and searching.
get_selection()returns those DataFrame rows. - Search — substring search across the fields, or switch the toolbar dropdown to SMARTS for a substructure query, with the match highlighted in every depiction. A malformed SMARTS reports itself instead of throwing.
- Sort — any column, either direction, from the toolbar or from Python.
- Alignment —
align_smarts=orients every depiction on a shared core, which is what makes an R-group series readable. - Coloring —
color_by=paints each card from one of its columns, with a colorbar or legend in the toolbar (see below). - Copy — each card has a button that puts its SMILES on the clipboard.
Arguments
| Argument | Default | Meaning |
|---|---|---|
df |
— | pandas or polars DataFrame |
smiles_col |
"SMILES" |
column holding SMILES strings |
mol_col |
None |
column of RDKit Mol objects; wins over smiles_col |
subset |
first data column | fields printed under each structure |
tooltip |
everything else | fields shown on hover |
n_cols, n_rows |
4, 3 |
page shape |
image_size |
(200, 150) |
depiction size in pixels |
sort_by, sort_ascending |
"", True |
initial sort |
align_smarts |
None |
common core to orient depictions on |
format |
None |
per-column format spec (".1f") or callable |
color_by |
None |
column to color the cards by |
color_mode |
"footer" |
"footer", "tint", or "border" |
colormap |
"viridis" |
ramp name or list of colors, for a numeric color_by |
palette |
Okabe-Ito | colors for a categorical color_by |
color_range |
None |
(vmin, vmax) to fix the numeric scale |
selectable, selection |
True, [] |
click-to-select and its initial state |
substruct_highlight |
True |
highlight SMARTS matches in the depiction |
Methods: get_selection(), get_filtered(), select_all(),
clear_selection(), set_dataframe(), refresh(), plus the dataframe
property.
Every piece of state is a traitlet, so the grid can be driven from Python too:
grid.widget.page = 2
grid.widget.search_mode = "smarts"
grid.widget.search = "c1ccc2ncncc2c1"
grid.widget.n_cols = 6
set_dataframe() swaps in a new set of molecules while keeping the layout and
fields — that is how the other widgets feed a live grid.
Coloring cards by value
MolGrid(
    df,
    subset=["Name", "pIC50"],
    color_by="pIC50",           # numeric -> ramp + colorbar
    color_mode="footer",        # "footer" | "tint" | "border"
    colormap="rdylgn",          # low red, high green
    color_range=(4, 9),         # optional: fix the scale
)
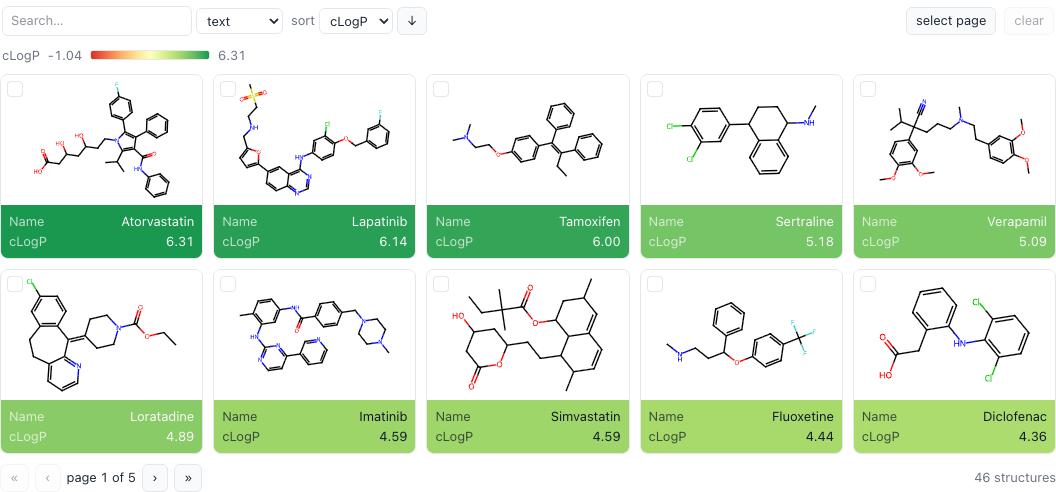
A numeric color_by gets a ramp and a colorbar; anything else is treated as
categorical and gets a legend. Built-in ramps are viridis (default), magma,
rdylgn, rdbu, and blues, or pass your own list of colors. Categorical
colors come from palette (Okabe-Ito by default).
The three modes differ only in where the color lands:
color_mode |
Effect |
|---|---|
"footer" |
the field strip under the structure; the text flips to light or dark for contrast |
"tint" |
the whole card, softly, with a stronger field strip |
"border" |
the card border |
The depiction panel is never painted — RDKit draws dark-on-light, and tinting behind a structure costs more legibility than it buys.
The scale is fixed when the grid is built, so set_dataframe() recolors the new
rows on the original scale instead of rescaling to whatever is on screen —
which is what makes colors comparable when a scatter selection or a cluster
feeds the grid. Pass color_range=(vmin, vmax) to fix it explicitly, e.g. to
share one scale across several grids. A frame that doesn't carry the color
column simply isn't colored.
MolScatter
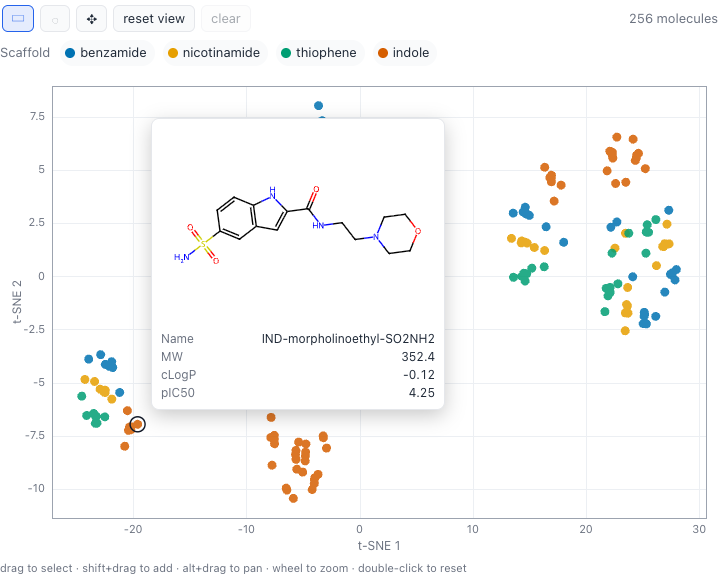
from marimo_chem_widgets import MolGrid, MolScatter

scatter = mo.ui.anywidget(
    MolScatter(
        df,
        x="tsne_x",
        y="tsne_y",
        color_by="Scaffold",             # numeric -> viridis ramp + colorbar
        tooltip=["Name", "MW", "pIC50"],
        x_label="t-SNE 1",
        y_label="t-SNE 2",
    )
)
scatter
Any two columns work as coordinates: a t-SNE or UMAP embedding, two computed properties, predicted vs. measured.
| Gesture | Effect |
|---|---|
| hover a point | draws that structure in a tooltip (cached after the first visit) |
| drag | box or lasso select, depending on the toolbar mode |
| shift+drag | add to the selection |
| click a point / empty space | toggle that point / clear |
| alt+drag, or pan mode | pan |
| wheel | zoom at the cursor |
| double-click, or reset view | back to the full extent |
| click a legend chip | select that whole series (shift to add) |
Selection into a grid
The reactive way, in a downstream cell:
scatter.value["selection"]                     # makes this cell reactive
mo.ui.anywidget(MolGrid(scatter.widget.get_selection(), subset=["Name"]))
Or link the two directly, in which case the grid updates in place with no cell re-running — which is what you want when they sit side by side:
scatter = MolScatter(df, x="tsne_x", y="tsne_y", mode="lasso")
grid = MolGrid(df, subset=["Name", "pIC50"], n_cols=3, n_rows=2)
scatter.link_grid(grid)

mo.hstack([scatter, grid])
Arguments
| Argument | Default | Meaning |
|---|---|---|
df |
— | pandas or polars DataFrame |
x, y |
"x", "y" |
coordinate columns |
smiles_col / mol_col |
"SMILES" / None |
where the structures come from |
color_by |
None |
numeric → viridis ramp + colorbar; anything else → categorical legend |
tooltip |
first 4 other columns | fields listed under the structure on hover |
width, height |
700, 480 |
plot size in pixels |
point_size, opacity |
4.5, 0.85 |
point appearance |
image_size |
(280, 200) |
size of the tooltip depiction |
palette |
Okabe-Ito | colors for a categorical color_by |
colormap |
"viridis" |
ramp name or list of colors, for a numeric color_by |
color_range |
None |
(vmin, vmax) to fix the numeric scale |
format |
None |
per-column format spec or callable |
x_label, y_label |
column names | axis labels |
mode |
"box" |
"box", "lasso", or "pan" |
Methods: get_selection(), select(), clear_selection(), link_grid(grid),
plus the dataframe and selected_smiles properties.
MolList
A vertical, scrolling column of structures where exactly one row is current — the master half of a master/detail view, and useful on its own as a picker. Every row is drawn up front, so it is meant for tens to a few hundred representatives, not a whole library.
from marimo_chem_widgets import MolList

picker = mo.ui.anywidget(
    MolList(
        centers_df,
        subset=["Cluster", "Amine"],   # fields beside each structure
        badge_col="N",                 # pill in the corner
        width=240,
        height=420,
        selected=0,
    )
)
picker
picker.value["selected"]          # row position, -1 for none
picker.widget.selected_row        # that row as a Series
Click a row to make it current; once the column has focus the up/down arrow keys walk it.
Arguments
| Argument | Default | Meaning |
|---|---|---|
df |
— | pandas or polars DataFrame |
smiles_col / mol_col |
"SMILES" / None |
where the structures come from |
subset |
first data column | fields beside each structure |
badge_col |
None |
column rendered as a pill |
image_size |
(150, 110) |
depiction size in pixels |
width, height |
260, 520 |
list width, and the height it scrolls past |
selected |
-1 |
row current on first render |
align_smarts, format |
None |
as elsewhere |
Methods: select(), clear_selection(), plus the dataframe, selected_row,
and selected_smiles properties.
MolMasterDetail
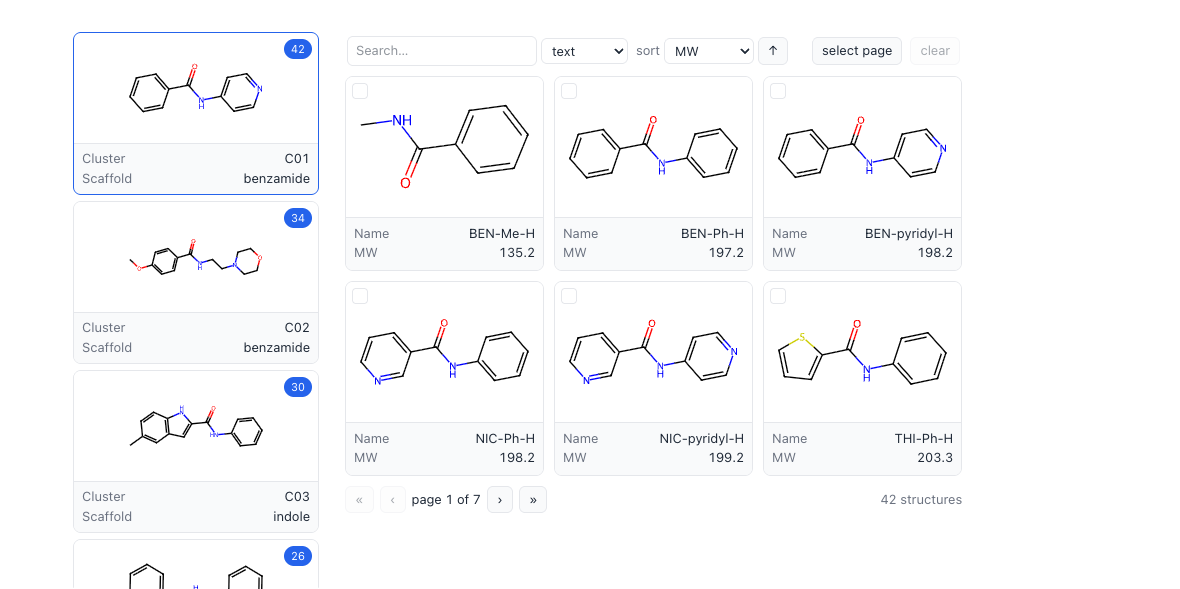
from marimo_chem_widgets import MolMasterDetail

view = MolMasterDetail(
    df,                        # SMILES, Name, MW, Cluster, is_center, ...
    group_col="Cluster",
    center_col="is_center",    # Butina's centroid, say; omit to use the first member
    master_subset=["Cluster", "Scaffold"],
    subset=["Name", "MW"],
    n_cols=3,
    n_rows=2,
)
view
Each master row carries its group's member count as a badge and groups are
ordered largest first. The detail side is an ordinary MolGrid, so it searches,
sorts, paginates, and its ticked structures come back through
view.get_selection().
Representatives come from center_col (a boolean column), an explicit centers
frame, or — with neither — the first member of each group.
This one is a display helper rather than an AnyWidget: it owns two real
widgets and keeps them in step.
view.master            # the MolList
view.grid              # the MolGrid
view.selected_group    # "C03"
view.get_detail()      # that group's rows
view.select_group("C07")
mo.hstack([view.master, view.grid])   # or lay them out yourself
Because it is a helper, a cell that reads view.selected_group reports what
was current when that cell last ran. For a cell that reacts to every click,
drive the two halves yourself:
picker = mo.ui.anywidget(MolList(centers_df, subset=["Cluster"], badge_col="N"))

# ...in another cell
cluster = centers_df.Cluster[picker.value["selected"]]
mo.ui.anywidget(MolGrid(df[df.Cluster == cluster], subset=["Name"]))
Arguments
| Argument | Default | Meaning |
|---|---|---|
df |
— | every molecule, with a group column |
group_col |
— | the grouping column |
smiles_col / mol_col |
"SMILES" / None |
where the structures come from |
center_col |
None |
boolean column marking each group's representative |
centers |
None |
an explicit representatives frame instead of center_col |
master_subset |
[group_col] |
fields beside each master structure |
badge_col |
"count" |
the pill on each master row |
sort_groups |
"size" |
"size", "name", or None for order of appearance |
subset, tooltip, n_cols, n_rows, image_size, sort_by, sort_ascending, format, selectable |
— | forwarded to the detail grid |
color_by, color_mode, colormap, palette, color_range |
— | forwarded to the detail grid; the scale spans every group, so colors mean the same thing in each |
master_image_size, master_width, height |
(150, 110), 250, 520 |
the master column's size |
align_smarts |
None |
common core to orient every depiction on |
selected |
0 |
group showing on first render (-1 for none) |
Attributes and methods: master, grid, centers, dataframe,
selected_group, get_detail(), get_selection(), select_group(),
layout().
Notes
- Drawing is lazy where it matters.
MolGriddraws the current page,MolScatterdraws the hovered molecule; both cache what they have drawn.MolListdraws every row up front, which is why it is scoped to representatives. - Invalid SMILES are never dropped. They get a placeholder tile, so row positions still line up with the DataFrame you passed in.
- Selections are positional. Row positions into the frame as given (its
index is reset), so
get_selection()is alwaysdf.iloc[...]. - Light and dark. The chrome follows the notebook's own theme rather than the OS preference — marimo marks its theme inside the widget's shadow root, and the stylesheets honour that. The depiction panel deliberately stays light in both, because RDKit draws dark-on-light and recoloring the SVG would fight the element colors.
- Structures are rendered server-side as SVG by RDKit, so there is no JavaScript chemistry toolkit to load and depictions match what RDKit would give you anywhere else.
Development
marimo_chem_widgets/
  _color.py         shared value-to-color mapping (ramps, palettes, legends)
  _draw.py          shared RDKit depiction helpers (parse, align, highlight, draw)
  mol_grid.py       MolGrid
  mol_scatter.py    MolScatter
  mol_list.py       MolList
  master_detail.py  MolMasterDetail
  static/           one .js + .css per widget
uv pip install -e ".[dev]"
python -m pytest -q          # 73 tests
The tests cover the Python side — payloads, paging, search, selection, coloring, linking, and the constructor's error messages. The interactive behaviour lives in the demo notebooks.
License
MIT — see LICENSE.
1 maintainer

Download files
Download the file for your platform. If you're not sure which to choose, learn more about installing packages.
Source Distribution
Built Distribution
Filter files by name, interpreter, ABI, and platform.
If you're not sure about the file name format, learn more about wheel file names.
Copy a direct link to the current filters
File details
Details for the file marimo_chem_widgets-0.5.0.tar.gz.
File metadata
- Download URL: marimo_chem_widgets-0.5.0.tar.gz
- Upload date:
- Size: 356.5 kB
- Tags: Source
- Uploaded using Trusted Publishing? No
- Uploaded via:
uv/0.9.17 {"installer":{"name":"uv","version":"0.9.17","subcommand":["publish"]},"python":null,"implementation":{"name":null,"version":null},"distro":{"name":"macOS","version":null,"id":null,"libc":null},"system":{"name":null,"release":null},"cpu":null,"openssl_version":null,"setuptools_version":null,"rustc_version":null,"ci":null}
File hashes
| Algorithm | Hash digest | |
|---|---|---|
| SHA256 |
0d7d4aa5d68b0b388d26b19598f3316a493c8408a492e4f33ad762cb9da7416e
|
|
| MD5 |
a3dce2be618476f49900eaca0fd50391
|
|
| BLAKE2b-256 |
febed74795431ac55ac64bd8a7e76e525becf6c8bb06f7d35b490904062b61f2
|
File details
Details for the file marimo_chem_widgets-0.5.0-py3-none-any.whl.
File metadata
- Download URL: marimo_chem_widgets-0.5.0-py3-none-any.whl
- Upload date:
- Size: 46.4 kB
- Tags: Python 3
- Uploaded using Trusted Publishing? No
- Uploaded via:
uv/0.9.17 {"installer":{"name":"uv","version":"0.9.17","subcommand":["publish"]},"python":null,"implementation":{"name":null,"version":null},"distro":{"name":"macOS","version":null,"id":null,"libc":null},"system":{"name":null,"release":null},"cpu":null,"openssl_version":null,"setuptools_version":null,"rustc_version":null,"ci":null}
File hashes
| Algorithm | Hash digest | |
|---|---|---|
| SHA256 |
571087a5caddb93aa72d602fb568d1fa9f99b52cd374feb539f6c86a0d759548
|
|
| MD5 |
dd290cfa6d0efed8b4cab8f96409f4ef
|
|
| BLAKE2b-256 |
6fa658aabcdccf6fa7d9e535d20c5cd78661e606a88aa106a280b2bbd99f6bec
|













