Meaningful OHLCV datasets
Verified details
These details have been verified by PyPIProject links
GitHub Statistics
Maintainers

Project description
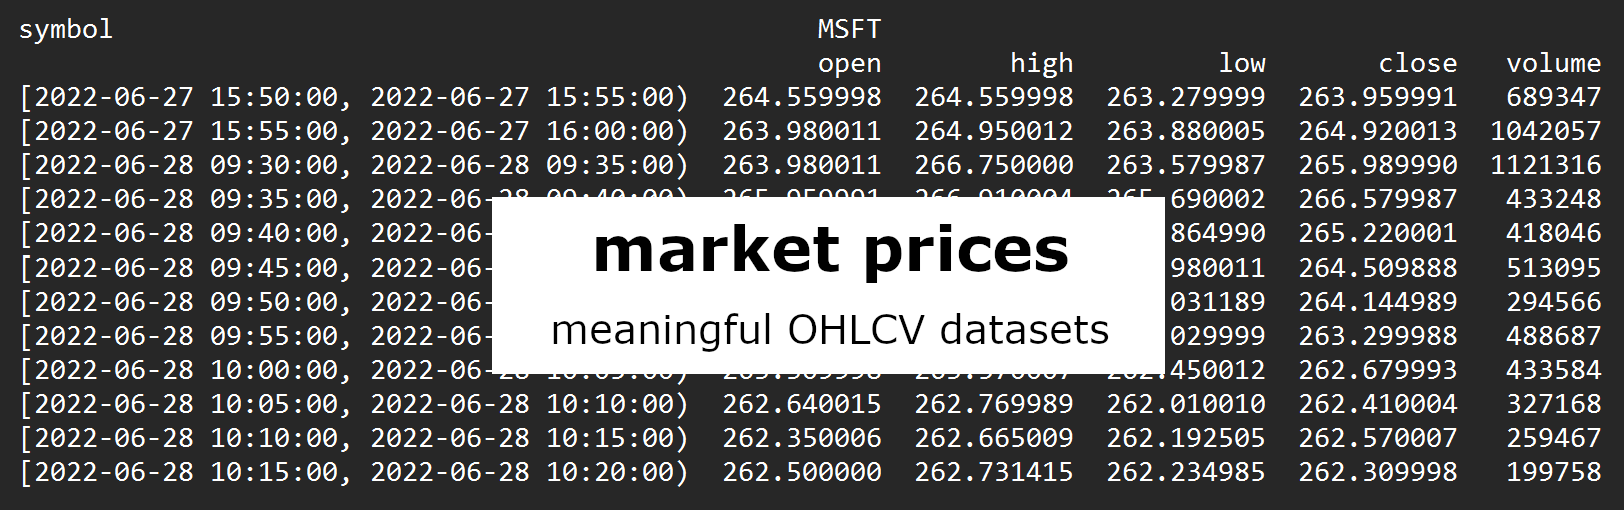
market_prices


A python library to create meaningful OHLCV datasets for financial instruments.
market_prices provides for enhanced querying and post-processing of financial price data.
Works out-the-box with prices from the Yahoo Finance API via yahooquery (see Disclaimers) or from locally stored .csv files.
Installation
$ pip install market-prices
Quickstart
>>> from market_prices import PricesYahoo
>>> prices = PricesYahoo("MSFT")  # prices for a single instrument, Microsoft
>>> # OR if Yahoo API endpoints are not all currently available in your region...
>>> prices = PricesYahoo("MSFT", calendars="XNYS", delays=0)
>>> prices.get("5min", minutes=40)  # last 40 minutes of prices at 5 minute intervals
symbol                                            MSFT
                                                  open        high         low       close     volume
[2022-06-27 15:45:00, 2022-06-27 15:50:00)  264.774994  265.108612  264.320007  264.600006   340111.0
[2022-06-27 15:50:00, 2022-06-27 15:55:00)  264.559998  264.559998  263.279999  263.959991   689347.0
[2022-06-27 15:55:00, 2022-06-27 16:00:00)  263.980011  264.950012  263.880005  264.920013  1042057.0
[2022-06-28 09:30:00, 2022-06-28 09:35:00)  263.980011  266.750000  263.579987  265.989990  1121316.0
[2022-06-28 09:35:00, 2022-06-28 09:40:00)  265.959991  266.910004  265.700012  266.579987   353441.0
[2022-06-28 09:40:00, 2022-06-28 09:45:00)  266.589996  266.869995  264.880005  265.220001   418320.0
[2022-06-28 09:45:00, 2022-06-28 09:50:00)  265.225006  265.350006  263.980011  264.509888   512821.0
[2022-06-28 09:50:00, 2022-06-28 09:55:00)  264.509888  264.509888  264.509888  264.509888        0.0
The above call was made 21 minutes after the NYSE open. Notice that the call returns the last 40 trading minutes of data, NOT the arbitrary number of trading minutes that may have fallen within the last 40 minutes according to the clock on the wall.
Any interval can be evaluated (limited only by the availability of underlying data).
>>> # prices over a specific session at 68 minute intervals
>>> prices.get("68min", start="2022-06-27", end="2022-06-27", force=True)
symbol                                            MSFT
                                                  open        high         low       close     volume
[2022-06-27 09:30:00, 2022-06-27 10:38:00)  267.929993  267.929993  264.829987  266.049988  4988476.0
[2022-06-27 10:38:00, 2022-06-27 11:46:00)  266.070007  267.190002  265.130005  266.144989  2516274.0
[2022-06-27 11:46:00, 2022-06-27 12:54:00)  266.160004  266.230011  264.640015  265.614990  2207186.0
[2022-06-27 12:54:00, 2022-06-27 14:02:00)  265.600006  265.714996  264.329987  264.559998  1777625.0
[2022-06-27 14:02:00, 2022-06-27 15:10:00)  264.570007  265.451599  263.855011  264.269989  1849430.0
[2022-06-27 15:10:00, 2022-06-27 16:00:00)  264.260010  265.108612  263.279999  264.920013  3504532.0
NB Here the force option forced the right side of the last indice back to the session close.
For daily data...
>>> prices.get("1D", start="2022-02-15", months=3)
symbol            MSFT
                  open        high         low       close    volume
2022-02-15  300.010010  300.799988  297.019989  300.470001  27058300
2022-02-16  298.369995  300.869995  293.679993  299.500000  29982100
2022-02-17  296.359985  296.799988  290.000000  290.730011  32461600
2022-02-18  293.049988  293.859985  286.309998  287.929993  34264000
2022-02-22  285.000000  291.540009  284.500000  287.720001  41736100
...                ...         ...         ...         ...       ...
2022-05-09  270.059998  272.359985  263.320007  264.579987  47726000
2022-05-10  271.690002  273.750000  265.070007  269.500000  39336400
2022-05-11  265.679993  271.359985  259.299988  260.549988  48975900
2022-05-12  257.690002  259.880005  250.020004  255.350006  51033800
2022-05-13  257.350006  263.040009  255.350006  261.119995  34925100

[62 rows x 5 columns]
Above the period has been defined in calendar months ('years' and 'weeks' are also valid arguments).
Daily data can be easily resampled to a higher interval.
>>> prices.get("3D", days=12) # 12 trading days of data at intervals of 3 sessions
symbol                          MSFT
                                open        high         low       close       volume
[2022-06-10, 2022-06-15)  260.579987  260.579987  241.509995  244.490005  106210100.0
[2022-06-15, 2022-06-21)  248.309998  255.300003  243.020004  247.649994  109081300.0
[2022-06-21, 2022-06-24)  250.259995  259.369995  249.509995  258.859985   81729600.0
[2022-06-24, 2022-06-29)  261.809998  268.299988  261.720001  264.369995   61089133.0
Although some indices are longer than three calendar days, they all comprise of three trading days (sessions) of data (all indices are closed on the 'right', such that data includes the session that represents the left side of the interval but NOT any session that might be represented by the right side.). Also, the period the dataset covers is 12 sessions, NOT the arbitrary number of sessions that fell within the last 12 days according to the calendar hanging on the wall.
market_prices comes into its own with the creation of datasets comprising instruments that trade on different exchanges.
>>> # Get a prices instance for Microsoft in New York, Alibaba in Hong Kong and 24/7 Bitcoin
>>> prices_mult = PricesYahoo("MSFT, 9988.HK, BTC-USD")
>>> # OR if Yahoo API endpoints are not all currently available in your region...
>>> prices_mult = PricesYahoo(
    "MSFT, 9988.HK, BTC-USD", calendars=["XNYS", "XHKG", "24/7"], delays=[0, 15, 0]
)
>>> # lead_symbol determines the exchange against which the period will be evaluated and
>>> # the default output time zone (which for Bitcoin is UTC).
>>> prices_mult.get("90min", hours=9, lead_symbol="BTC-USD")
symbol                                            MSFT                                                    9988.HK                                                       BTC-USD
                                                  open        high         low       close     volume        open        high         low       close      volume          open          high           low         close       volume
[2022-06-28 06:00:00, 2022-06-28 07:30:00)         NaN         NaN         NaN         NaN        NaN  115.400002  119.099998  115.199997  118.000000  16137193.0  20751.832031  20908.732422  20751.832031  20894.144531  643196928.0
[2022-06-28 07:30:00, 2022-06-28 09:00:00)         NaN         NaN         NaN         NaN        NaN  118.000000  119.699997  117.099998  118.199997   6600305.0  20885.277344  21070.208984  20846.593750  21070.208984  616460288.0
[2022-06-28 09:00:00, 2022-06-28 10:30:00)         NaN         NaN         NaN         NaN        NaN         NaN         NaN         NaN         NaN         NaN  21087.283203  21162.541016  21030.169922  21054.451172  376852480.0
[2022-06-28 10:30:00, 2022-06-28 12:00:00)         NaN         NaN         NaN         NaN        NaN         NaN         NaN         NaN         NaN         NaN  21047.083984  21069.363281  20958.353516  20995.970703  249643008.0
[2022-06-28 12:00:00, 2022-06-28 13:30:00)         NaN         NaN         NaN         NaN        NaN         NaN         NaN         NaN         NaN         NaN  20996.517578  21089.582031  20913.453125  20993.925781  319698944.0
[2022-06-28 13:30:00, 2022-06-28 15:00:00)  263.980011  266.910004  263.210205  263.529999  3027945.0         NaN         NaN         NaN         NaN         NaN  20990.644531  21084.759766  20990.644531  21084.759766   88373248.0
By default prices are shown as missing when the exchange is closed (the time zone of the above output is UTC). Indices that would cover periods during which no symbol trades are excluded. (Scroll right on the output to see all the returned data.)
Within any session missing prices between the open and the close are always filled with contiguous data. This happens even for illiquid instruments where the price data alone may give no indication of a session's open or close. (See the exchange_calendars section for how market_prices 'knows' the trading times of each symbol.)
The get method has plenty of options to customize the output, including fill to fill in indices when an exchange is closed...
>>> # as before, only now filling in prices when exchanges are closed
>>> prices_mult.get("90min", hours=9, lead_symbol="BTC-USD", fill="both")
symbol                                            MSFT                                                    9988.HK                                                       BTC-USD
                                                  open        high         low       close     volume        open        high         low       close      volume          open          high           low         close       volume
[2022-06-28 06:00:00, 2022-06-28 07:30:00)  263.980011  263.980011  263.980011  263.980011        0.0  115.400002  119.099998  115.199997  118.000000  16137193.0  20751.832031  20908.732422  20751.832031  20894.144531  643196928.0
[2022-06-28 07:30:00, 2022-06-28 09:00:00)  263.980011  263.980011  263.980011  263.980011        0.0  118.000000  119.699997  117.099998  118.199997   6600305.0  20885.277344  21070.208984  20846.593750  21070.208984  616460288.0
[2022-06-28 09:00:00, 2022-06-28 10:30:00)  263.980011  263.980011  263.980011  263.980011        0.0  118.199997  118.199997  118.199997  118.199997         0.0  21087.283203  21162.541016  21030.169922  21054.451172  376852480.0
[2022-06-28 10:30:00, 2022-06-28 12:00:00)  263.980011  263.980011  263.980011  263.980011        0.0  118.199997  118.199997  118.199997  118.199997         0.0  21047.083984  21069.363281  20958.353516  20995.970703  249643008.0
[2022-06-28 12:00:00, 2022-06-28 13:30:00)  263.980011  263.980011  263.980011  263.980011        0.0  118.199997  118.199997  118.199997  118.199997         0.0  20996.517578  21089.582031  20913.453125  20993.925781  319698944.0
[2022-06-28 13:30:00, 2022-06-28 15:00:00)  263.980011  266.910004  263.049988  263.148987  3063273.0  118.199997  118.199997  118.199997  118.199997         0.0  20990.644531  21084.759766  20990.644531  21084.759766   88373248.0
The 'workback' anchor option offers an alternative to anchoring indices on each session's open. The following call requests two trading days of data to a specific minute, at 3 hour intervals, with data evaluated by working back from the last indice.
>>> df = prices.get("3h", end="2022-06-27 15:44", days=2, anchor="workback")
>>> df
symbol                                            MSFT
                                                  open        high         low       close      volume
[2022-06-24 10:14:00, 2022-06-24 13:14:00)  265.750000  266.459991  263.410004  264.399994   6864301.0
[2022-06-24 13:14:00, 2022-06-27 09:44:00)  264.390015  267.980011  263.640015  265.160004  10765130.0
[2022-06-27 09:44:00, 2022-06-27 12:44:00)  265.149994  267.190002  264.640015  265.100006   7239582.0
[2022-06-27 12:44:00, 2022-06-27 15:44:00)  265.109985  265.714996  263.760010  264.570007   5237309.0
The second indice can be seen to cross sessions. It partly covers the end of a Friday session and partly the start of the subsequent Monday session...
>>> df.index.length
TimedeltaIndex(['0 days 03:00:00', '2 days 20:30:00', '0 days 03:00:00',
                '0 days 03:00:00'],
               dtype='timedelta64[ns]', freq=None)
Although that indice still comprises only the requested interval of 3 trading hours...
>>> calendar = prices.calendar_default
>>> df.pt.indices_trading_minutes(calendar)
[2022-06-24 10:14:00, 2022-06-24 13:14:00)    180
[2022-06-24 13:14:00, 2022-06-27 09:44:00)    180
[2022-06-27 09:44:00, 2022-06-27 12:44:00)    180
[2022-06-27 12:44:00, 2022-06-27 15:44:00)    180
Name: trading_mins, dtype: int64
The indices_trading_minutes method called above is available via the .pt accessor. (market_prices uses the .pt accessor to make available a host of properties and methods to directly interrogate the price data.)
Whereas the above examples used the get method to create a dataset, the following methods provide for more specific queries.
close_at returns the most recent close price as of a specific date.
>>> prices_mult.close_at("2022-06-27")
symbol            MSFT     9988.HK       BTC-USD
2022-06-27  264.890015  118.099998  20735.478516
price_at returns prices as at a specific minute.
>>> prices_mult.price_at("2022-06-27 16:22", tz="MSFT")
symbol                           MSFT     9988.HK       BTC-USD
2022-06-27 16:22:00-04:00  264.920013  118.099998  20922.904297
price_range returns OHLCV data over a period defined with the same arguments as get.
>>> # ohlcv data for period comprising 3 sessions to a specific time
>>> prices_mult.price_range(end="2022-06-07 15:22", days=3, lead_symbol="MSFT", stack=True)
                                                            open          high           low         close        volume
                                           symbol
(2022-06-02 15:22:00, 2022-06-07 15:22:00] 9988.HK     92.800003    101.800003     91.250000     98.800003  1.818390e+08
                                           BTC-USD  30084.296875  31693.291016  29311.683594  30366.656250  6.989303e+10
                                           MSFT       273.535004    274.649994    266.029999    272.149994  5.853911e+07
The quickstart.ipynb tutorial offers a fuller introduction. Here you'll find links to all the tutorials which collectively cover all that market_prices offers.
Features include:
- Get price data out-the-box:
PricesYahooto get live and historic prices from the Yahoo Finance API via yahooquery (see Disclaimers).PricesCsvto get price data from locally stored .csv files.
- Include securities trading on different exchanges with differing opening hours across different time zones.
- Request the period covered by a dataset in terms of either:
- trading time (minutes and hours).
- number of sessions (days).
- calendar time (weeks, months and years).
- Request data at ANY interval (pretty much).
- Use properties and functions of the
pd.DataFrame.ptaccessor to interrogate and operate directly on price tables. - Anchor indices either:
- on each (sub)session open.
- on the period end and work back (crossing sessions).
- Price tables indexed with a pandas
IntervalIndexthat defines both sides of the time interval covered by each row. - Respects breaks in exchanges that observe separate morning and afternoon subsessions.
- Indices excluded for any periods when no underlying exchange is open.
- Fills missing prices, by security, within the bounds of trading hours (zero leakage).
- Optionally fills missing values outside of trading hours (for multiple securities with different opening hours).
- Efficient data-usage (only requests data required and only requests any data point once).
- Data source flexibility (use any data source by concreting the ABC).
Tutorials / Documentation
market_prices comes with a host of notebook tutorials that show example usage and explain every aspect of what's on offer. Check out quickstart.ipynb for a taster.
All tutorials and other documentation are indexed here.
Each method's own documentation is also pretty comprehensive.
market_analy
The market_analy library uses prices data from market_prices to undertake analyses and create interactive bqplot charts. The demo video covers usage of both libraries.
exchange_calendars
market_prices is nothing without exchange_calendars.
exchange_calendars provides market_prices:
- Knowledge of underlying exchanges' opening times.
- A wealth of functionality to interrogate exchanges' sessions and trading minutes.
This knowledge and functionality allows market_prices to:
- Index prices according to exchanges' opening hours.
- Evaluate periods defined in terms of trading minutes or sessions.
Data sources
The functionality offered by market_prices is not reliant on any particular data source, but it does need one!
The default prices class, PricesYahoo, employs the yahooquery library to fetch raw price data. A different data source can be used by simply concreting a subclass of the Abstract Base Class PricesBase (see the developer docs).
:information_source: yahooquery offers broad pythonic access to the Yahoo API - check it out if you're after other financial data!
Calendar maintenance
If you come across missing prices or sessions then the first port of call is to check that the associated calendar is accurate - it may need updating.
- If prices are not included for a session, the calendar may be assuming that day is a holiday.
- If prices are included on a day when the exchange was closed, the calendar is probably assuming that day represents a trading session. In this case prices for the non-trading day will have a constant value and a
errors.PricesMissingWarningwill have been raised when the prices were requested.
All calendars are maintained by user-contributions. If you find one that needs updating, PR the required changes over at exchange_calendars and it'll filter into market_prices on the next exchange_calendars release. Links to the workflow to update calendars can be found here.
The prices tutorial covers how market_prices associates calendars with symbols.
Release schedule, bugs, development and feedback
The first beta version of market_prices was released May 2022.
Whilst the test suite is pretty comprehensive, there will inevitably be bugs. Please do raise an issue with any that you come across. Even better, offer a PR! Contributions welcome.
The package is actively maintained to work with the latest versions of its dependencies, which include numpy and pandas. Only limited consideration is given to backwards compatibility with earlier versions of dependencies - no guarantees are offered in this regard. Of note, whilst the latest release works with pandas v3 and v2, support for pandas v1 was dropped some time ago.
Please use discussions to make any suggestions and offer general feedback.
Disclaimers
market_prices should not be assumed sufficiently reliable to undertake market analysis intended to inform investment decisions. Users should inspect the source code and the test suite of the library and its dependencies in order to make their own assessment of the packages' suitability for their purposes. market_prices is used entirely at the user's own risk.
Yahoo APIs
The default PricesYahoo class requests data from publically available Yahoo APIs via the yahooquery package.
market_prices is NOT in any way affiliated, partnered, sponsored or endorsed by Yahoo. Users of the PricesYahoo class should make enquiries to satisfy themselves that they are eligible to receive data from Yahoo APIs and are in compliance with the license requirements and Terms of Service under which the Yahoo APIs may be accessed, to include restrictions concerning NO COMMERCIAL USE.
Users may find the following references useful in this respect. (These references should not be considered to definitively cover all terms and conditions related to the use of Yahoo APIs.)
Further, it should NOT be assumed that price data returned by the PricesYahoo class will accurately reflect data as provided by Yahoo APIs. In this respect users should make their own inspection of the source code and test suites of market_prices and its dependencies.
License
Project details
Verified details
These details have been verified by PyPIProject links
GitHub Statistics
Maintainers
Release history Release notifications | RSS feed


Download files
Download the file for your platform. If you're not sure which to choose, learn more about installing packages.
Source Distribution
Built Distribution
Filter files by name, interpreter, ABI, and platform.
If you're not sure about the file name format, learn more about wheel file names.
Copy a direct link to the current filters
File details
Details for the file market_prices-0.12.14.tar.gz.
File metadata
- Download URL: market_prices-0.12.14.tar.gz
- Upload date:
- Size: 1.8 MB
- Tags: Source
- Uploaded using Trusted Publishing? Yes
- Uploaded via: uv/0.11.17 {"installer":{"name":"uv","version":"0.11.17","subcommand":["publish"]},"python":null,"implementation":{"name":null,"version":null},"distro":{"name":"Ubuntu","version":"24.04","id":"noble","libc":null},"system":{"name":null,"release":null},"cpu":null,"openssl_version":null,"setuptools_version":null,"rustc_version":null,"ci":true}
File hashes
| Algorithm | Hash digest | |
|---|---|---|
| SHA256 |
3a45da206f7dbe237f8723a10d830d5bc368daea4352d4f68274f5055cf9a5f1
|
|
| MD5 |
79f4093a0e8de8322ac67a0a2e939003
|
|
| BLAKE2b-256 |
315768125dabd4b1b1ff320dd6117796211e0d0b813161c80dddff8ea1f320a1
|
File details
Details for the file market_prices-0.12.14-py3-none-any.whl.
File metadata
- Download URL: market_prices-0.12.14-py3-none-any.whl
- Upload date:
- Size: 161.7 kB
- Tags: Python 3
- Uploaded using Trusted Publishing? Yes
- Uploaded via: uv/0.11.17 {"installer":{"name":"uv","version":"0.11.17","subcommand":["publish"]},"python":null,"implementation":{"name":null,"version":null},"distro":{"name":"Ubuntu","version":"24.04","id":"noble","libc":null},"system":{"name":null,"release":null},"cpu":null,"openssl_version":null,"setuptools_version":null,"rustc_version":null,"ci":true}
File hashes
| Algorithm | Hash digest | |
|---|---|---|
| SHA256 |
47578b7fdc02bf80460d4c7456357080bef5066a74dee1cc379a50fddf239a95
|
|
| MD5 |
cefa54d81e1400605fc17fe14ca1c2bf
|
|
| BLAKE2b-256 |
ec272902c781b200f5f98ae5512d3498aff9858fcd5b285cefddc6e1d0ad639b
|


