Declarative creation of composable visualizations
Verified details
These details have been verified by PyPIProject links
GitHub Statistics
Maintainers

Project description


Marsilea: Declarative creation of composable visualization!
Documentation
You can read the documentation on Read the Docs.
Installation
Using PIP
pip install marsilea
Using Conda/Mamba
conda install -c conda-forge marsilea
# or
mamba install -c conda-forge marsilea
What is Composable Visualization?

When we do visualization, we often need to combine multiple plots to show different aspects of the data. For example, we may need to create a heatmap to show the expression of genes in different cells, and then create a bar chart to show the expression of genes in different cell types. A visualization contains multiple plots is called a composable visualization. In Marsilea, we employ a declarative approach for user to create composable visualization incrementally.
Citation
If you use Marsilea in your research, please cite the following:
Marsilea: an intuitive generalized paradigm for composable visualizations
Yimin Zheng, Zhihang Zheng, André F. Rendeiro & Edwin Cheung
Genome Biology 2025 Jan 06. DOI: 10.1186/s13059-017-1382-0
Get helps
- Open an issue
- Join us on Gitter
Examples
| Bar Chart With Image | Stacked Bar | Arc Diagram |
|---|---|---|
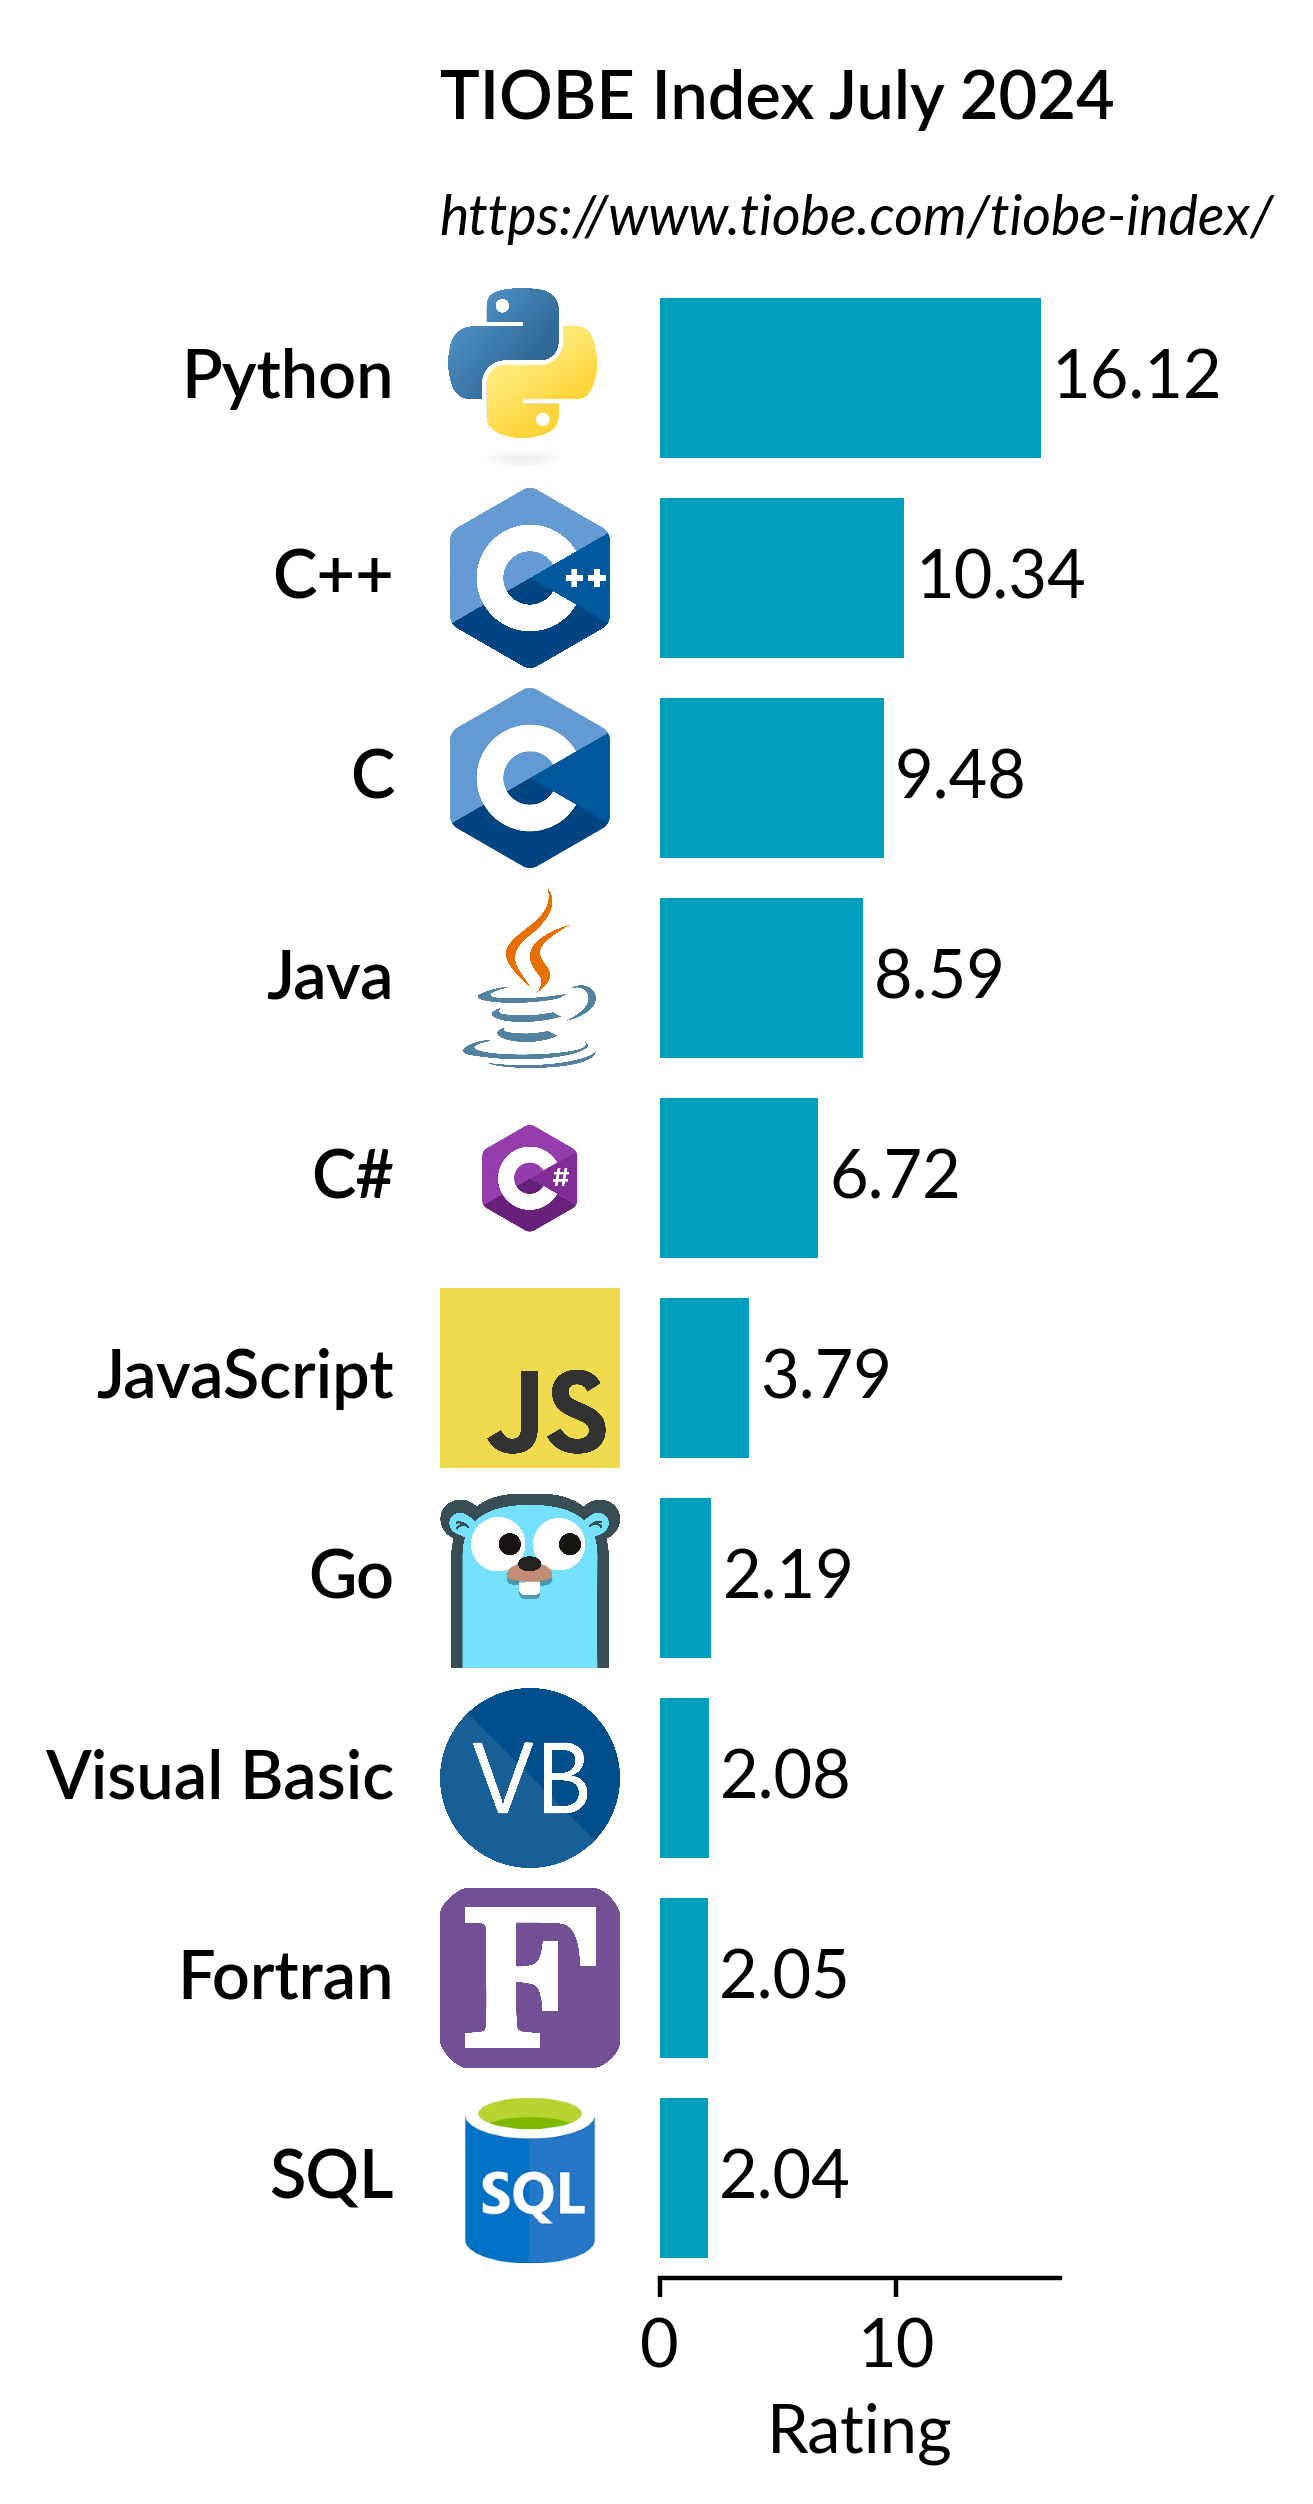
|
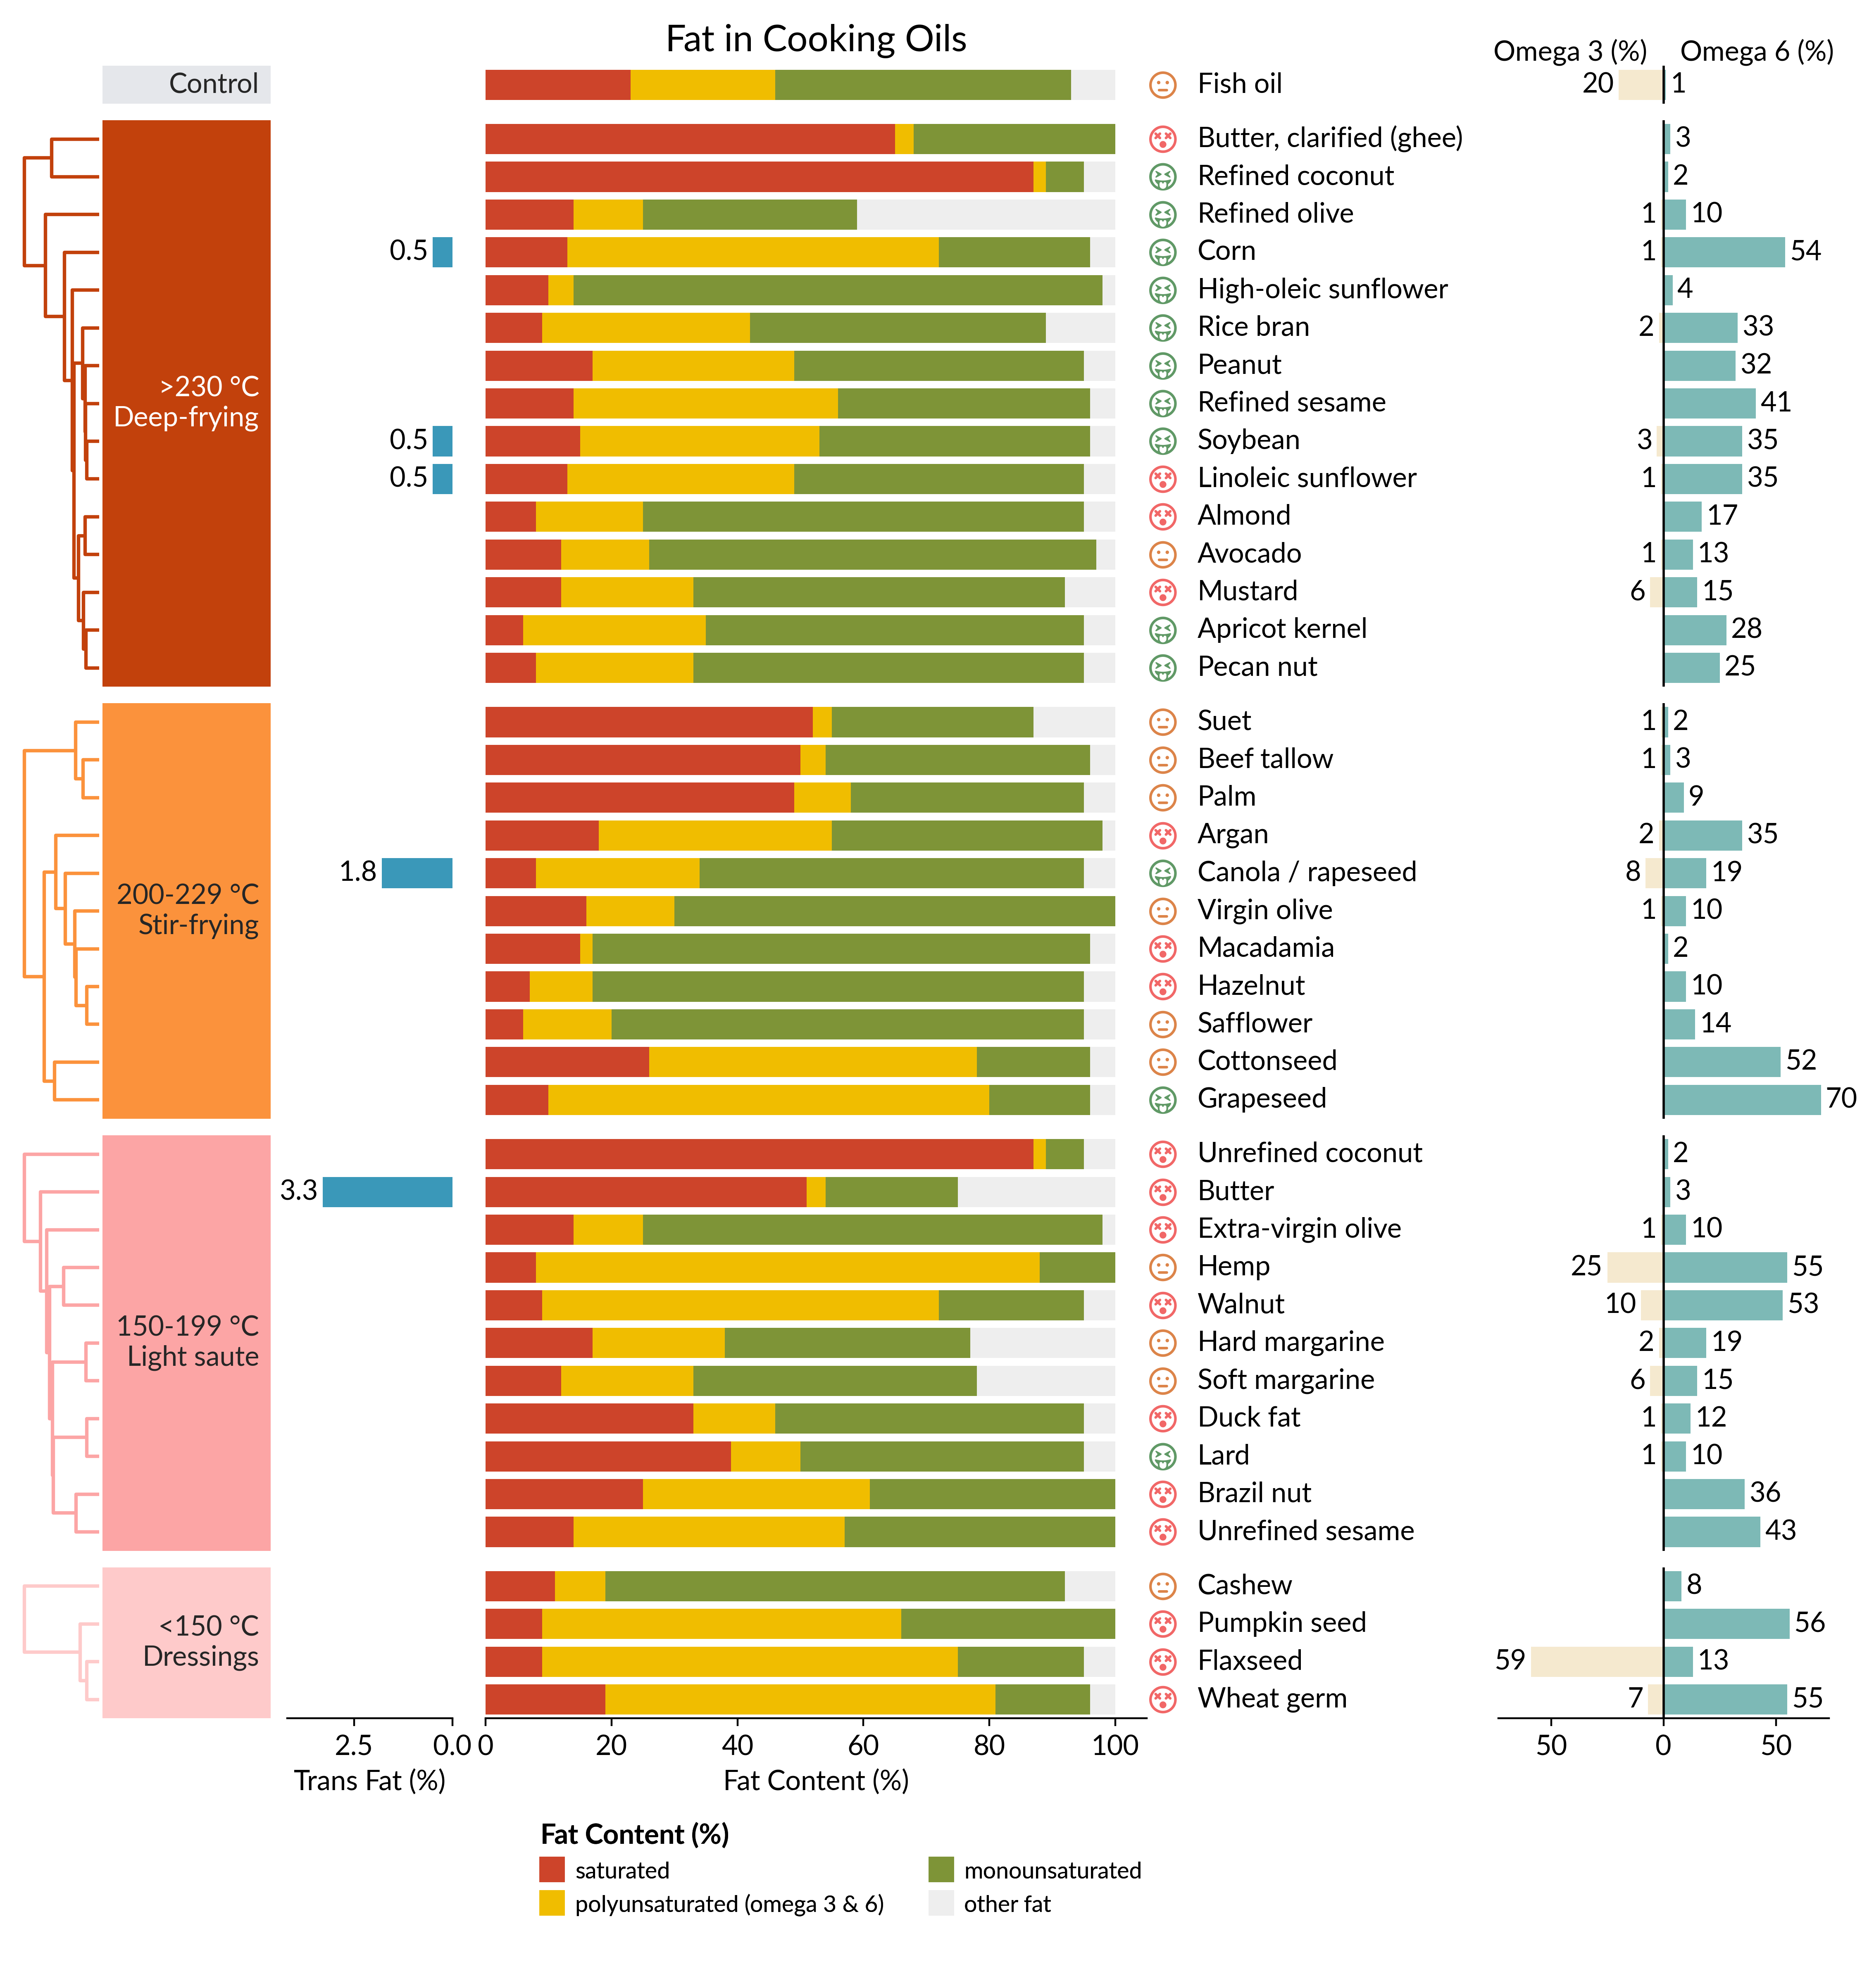
|
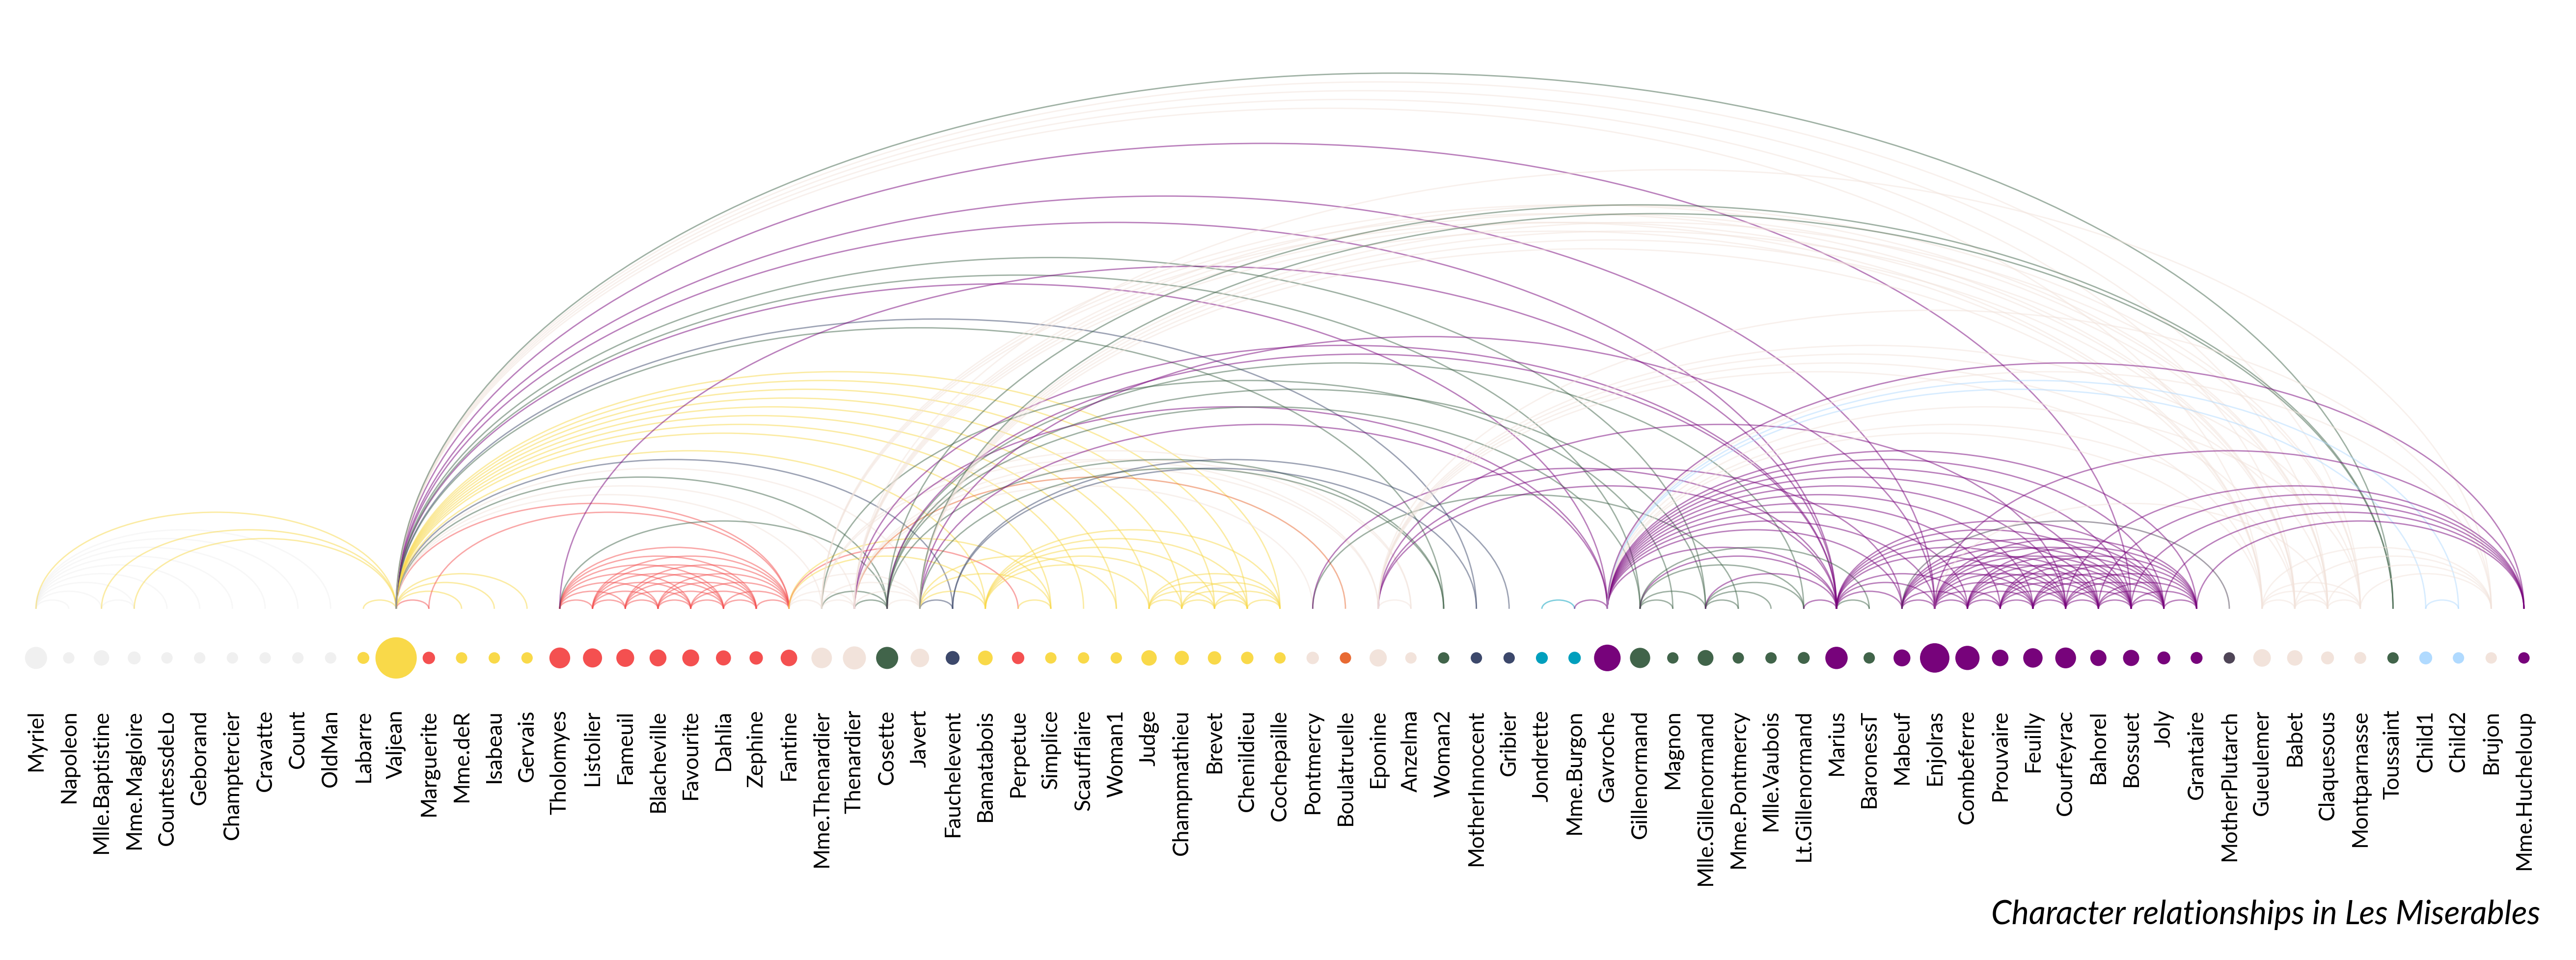
|
| Heatmap | Oncoprint | Upsetplot |
|---|---|---|
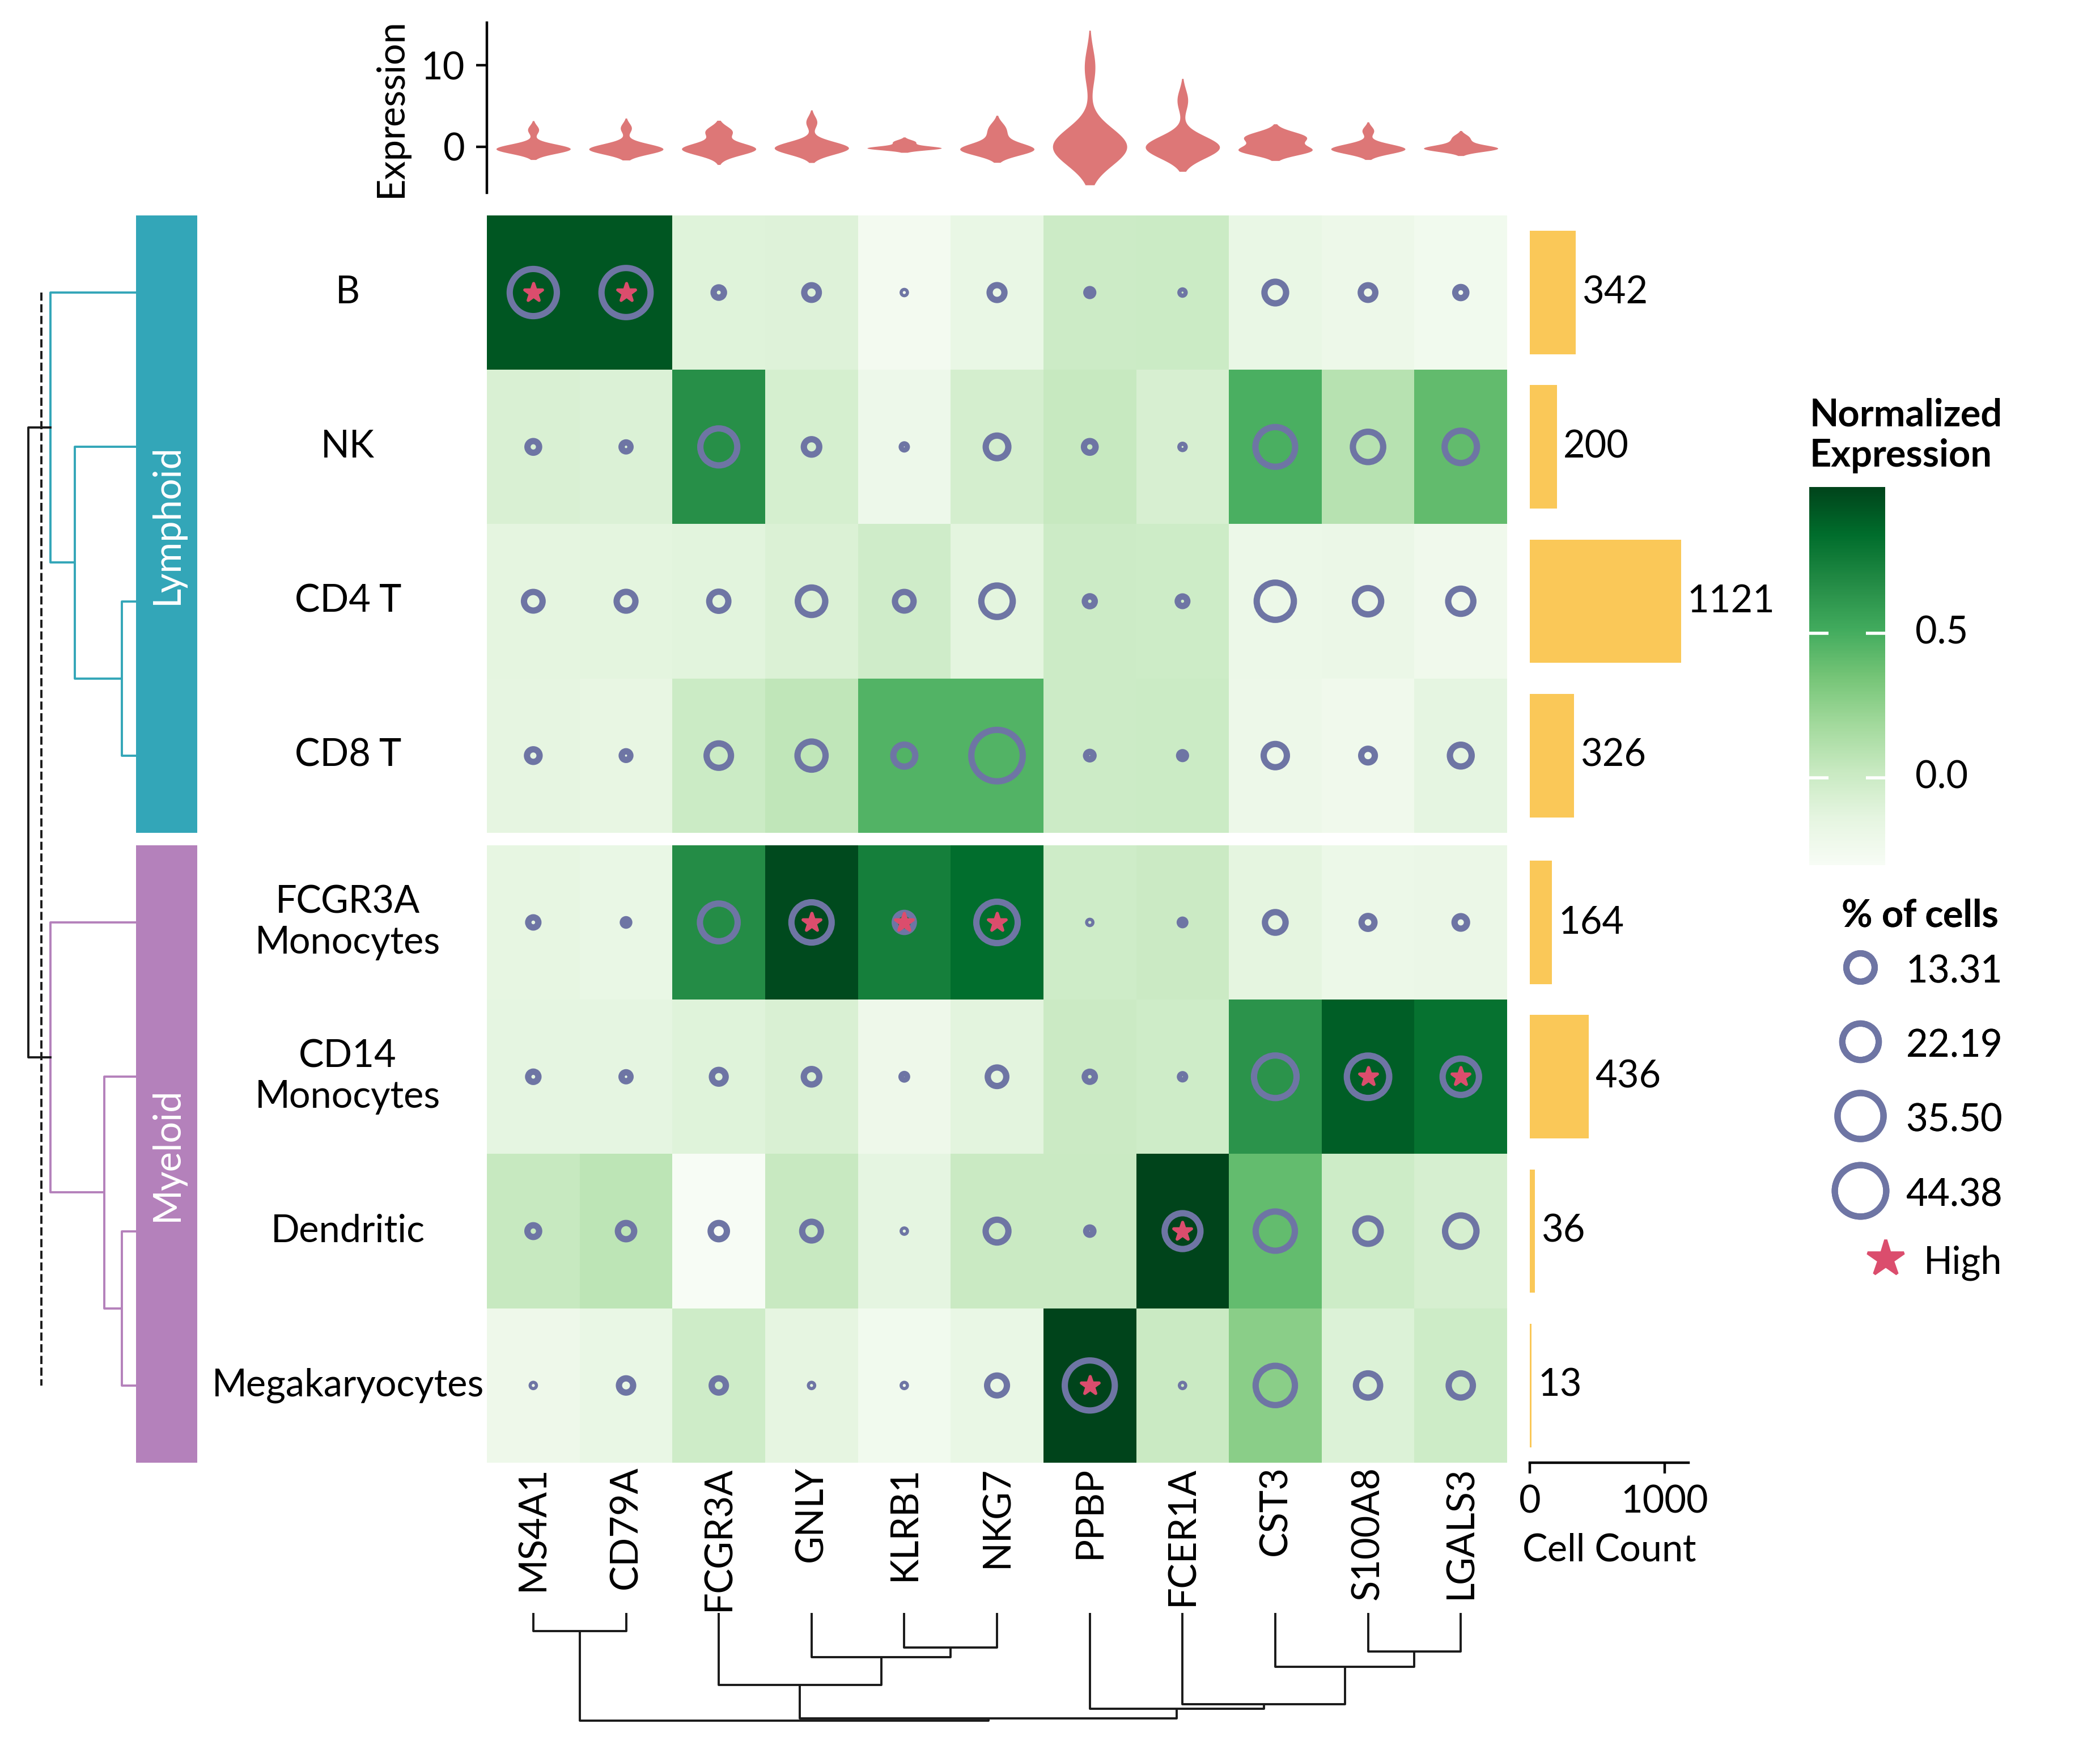
|
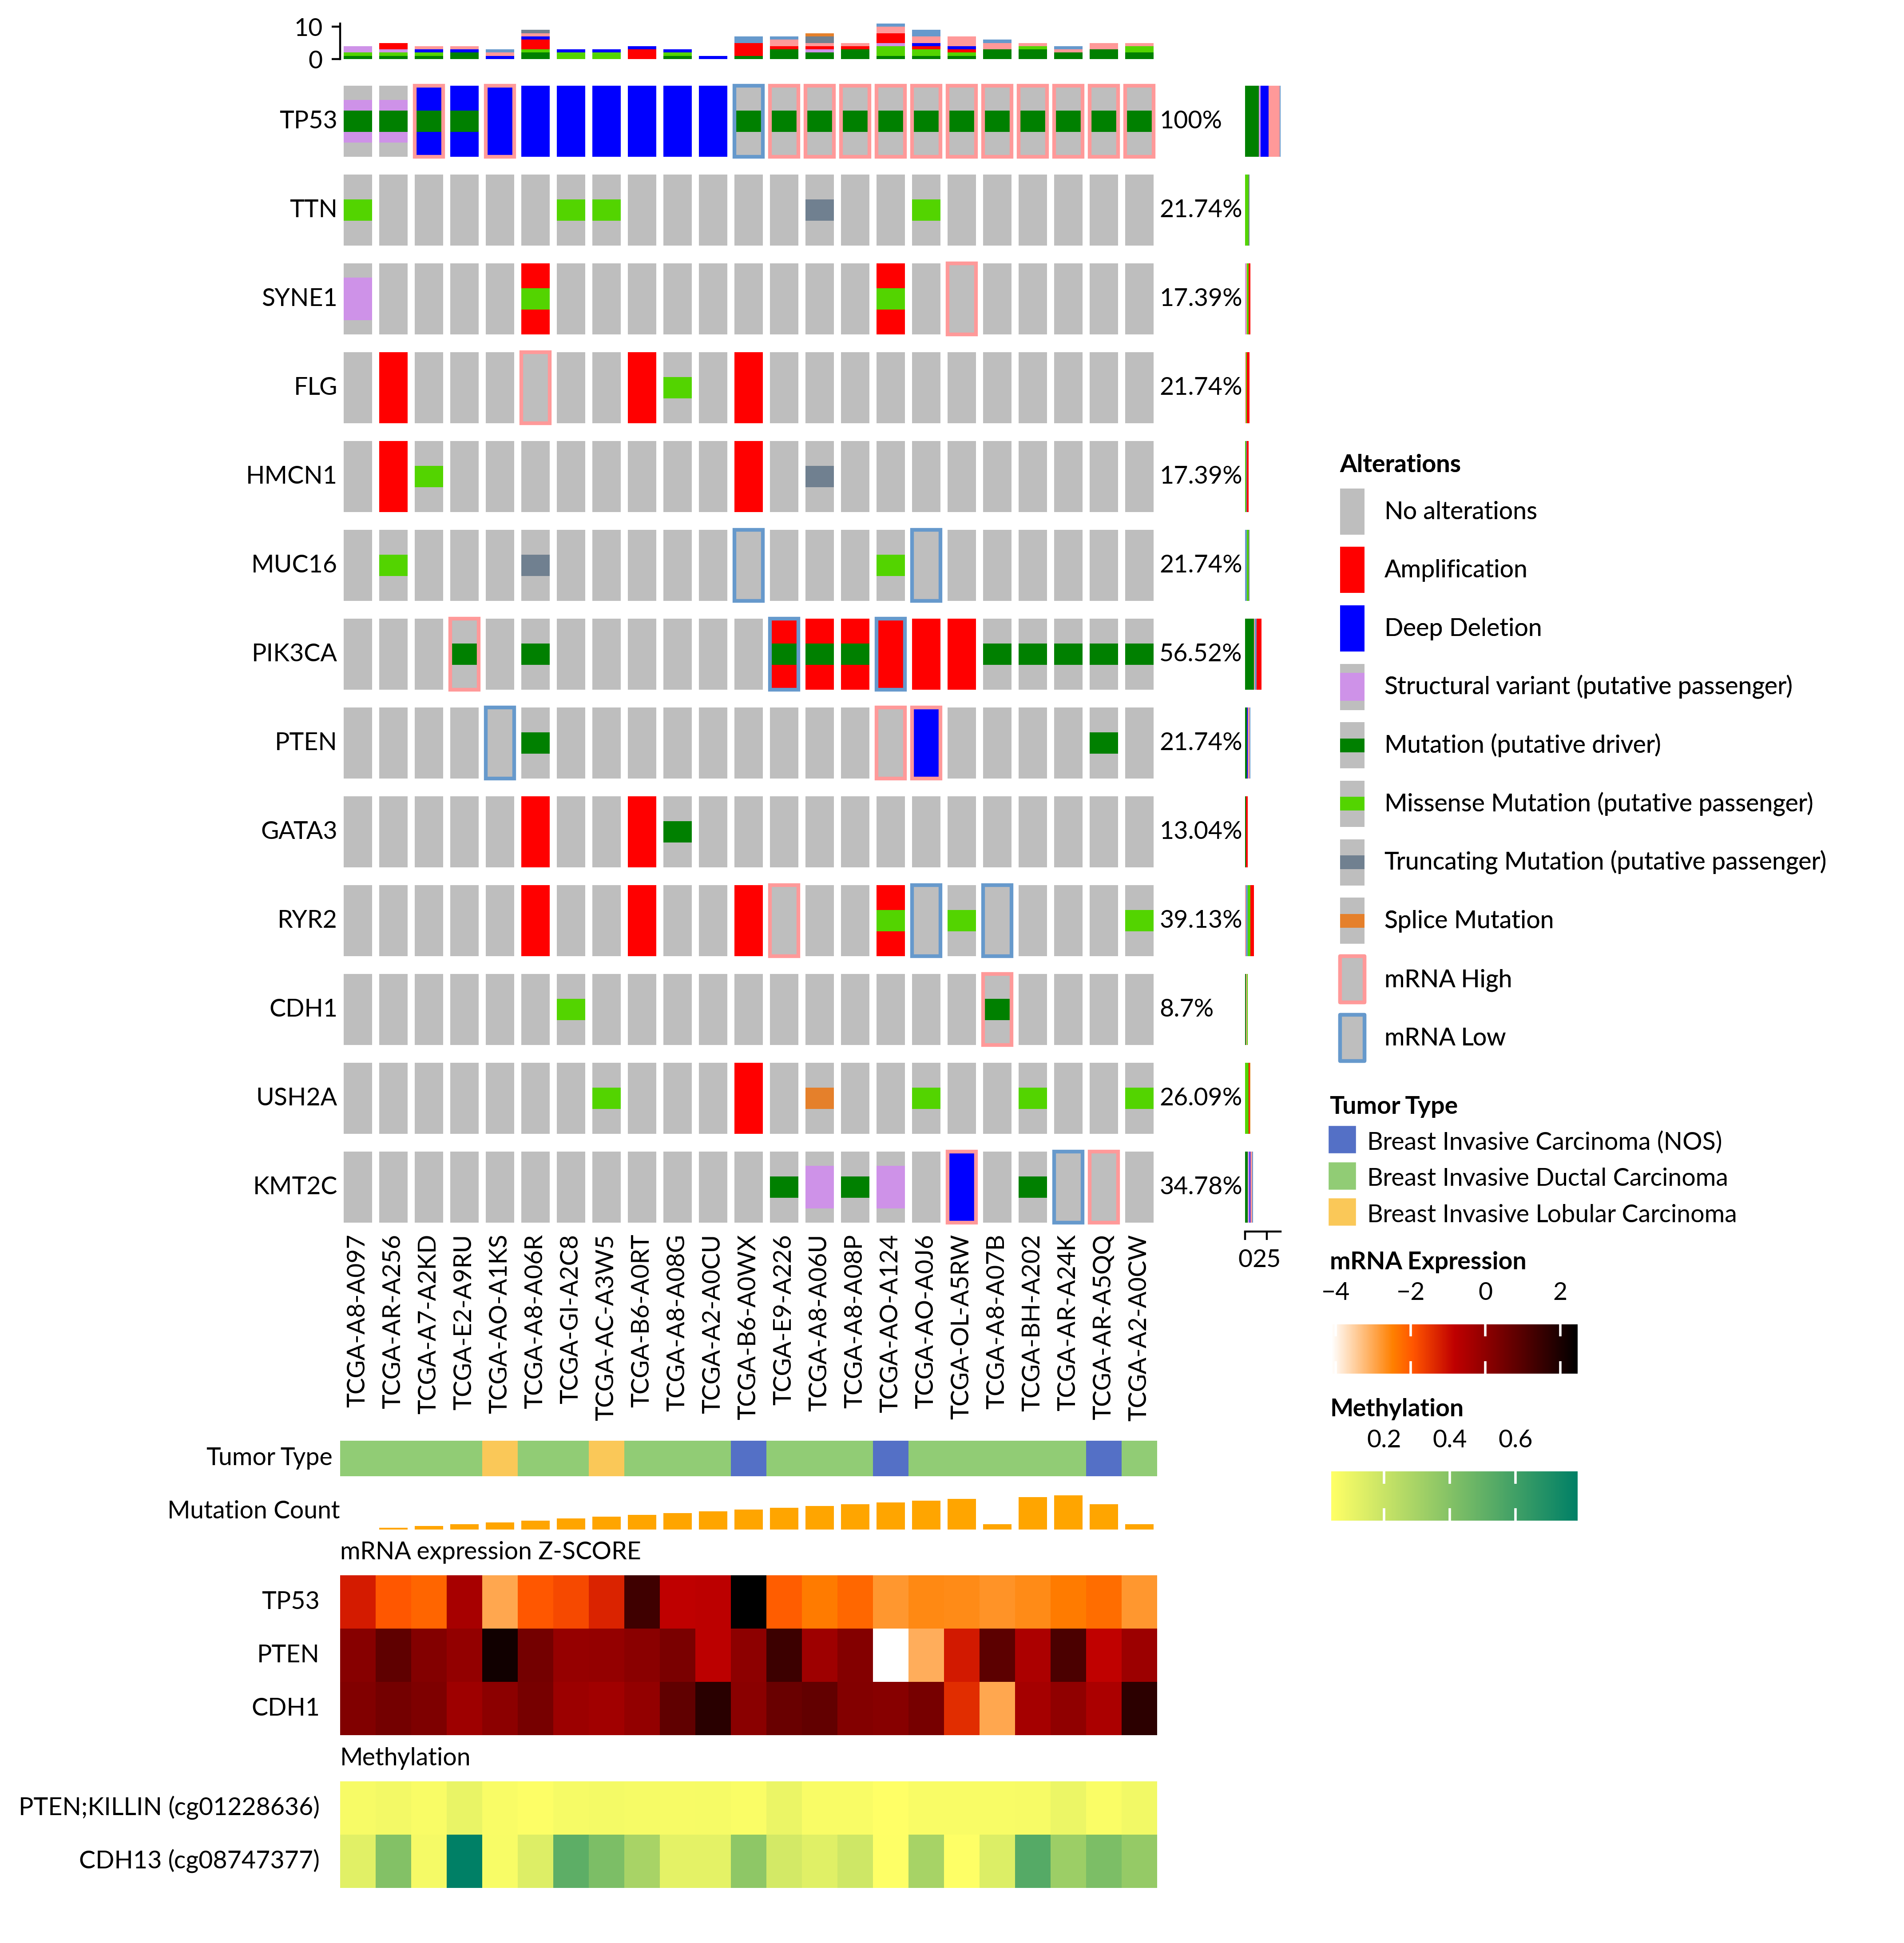
|
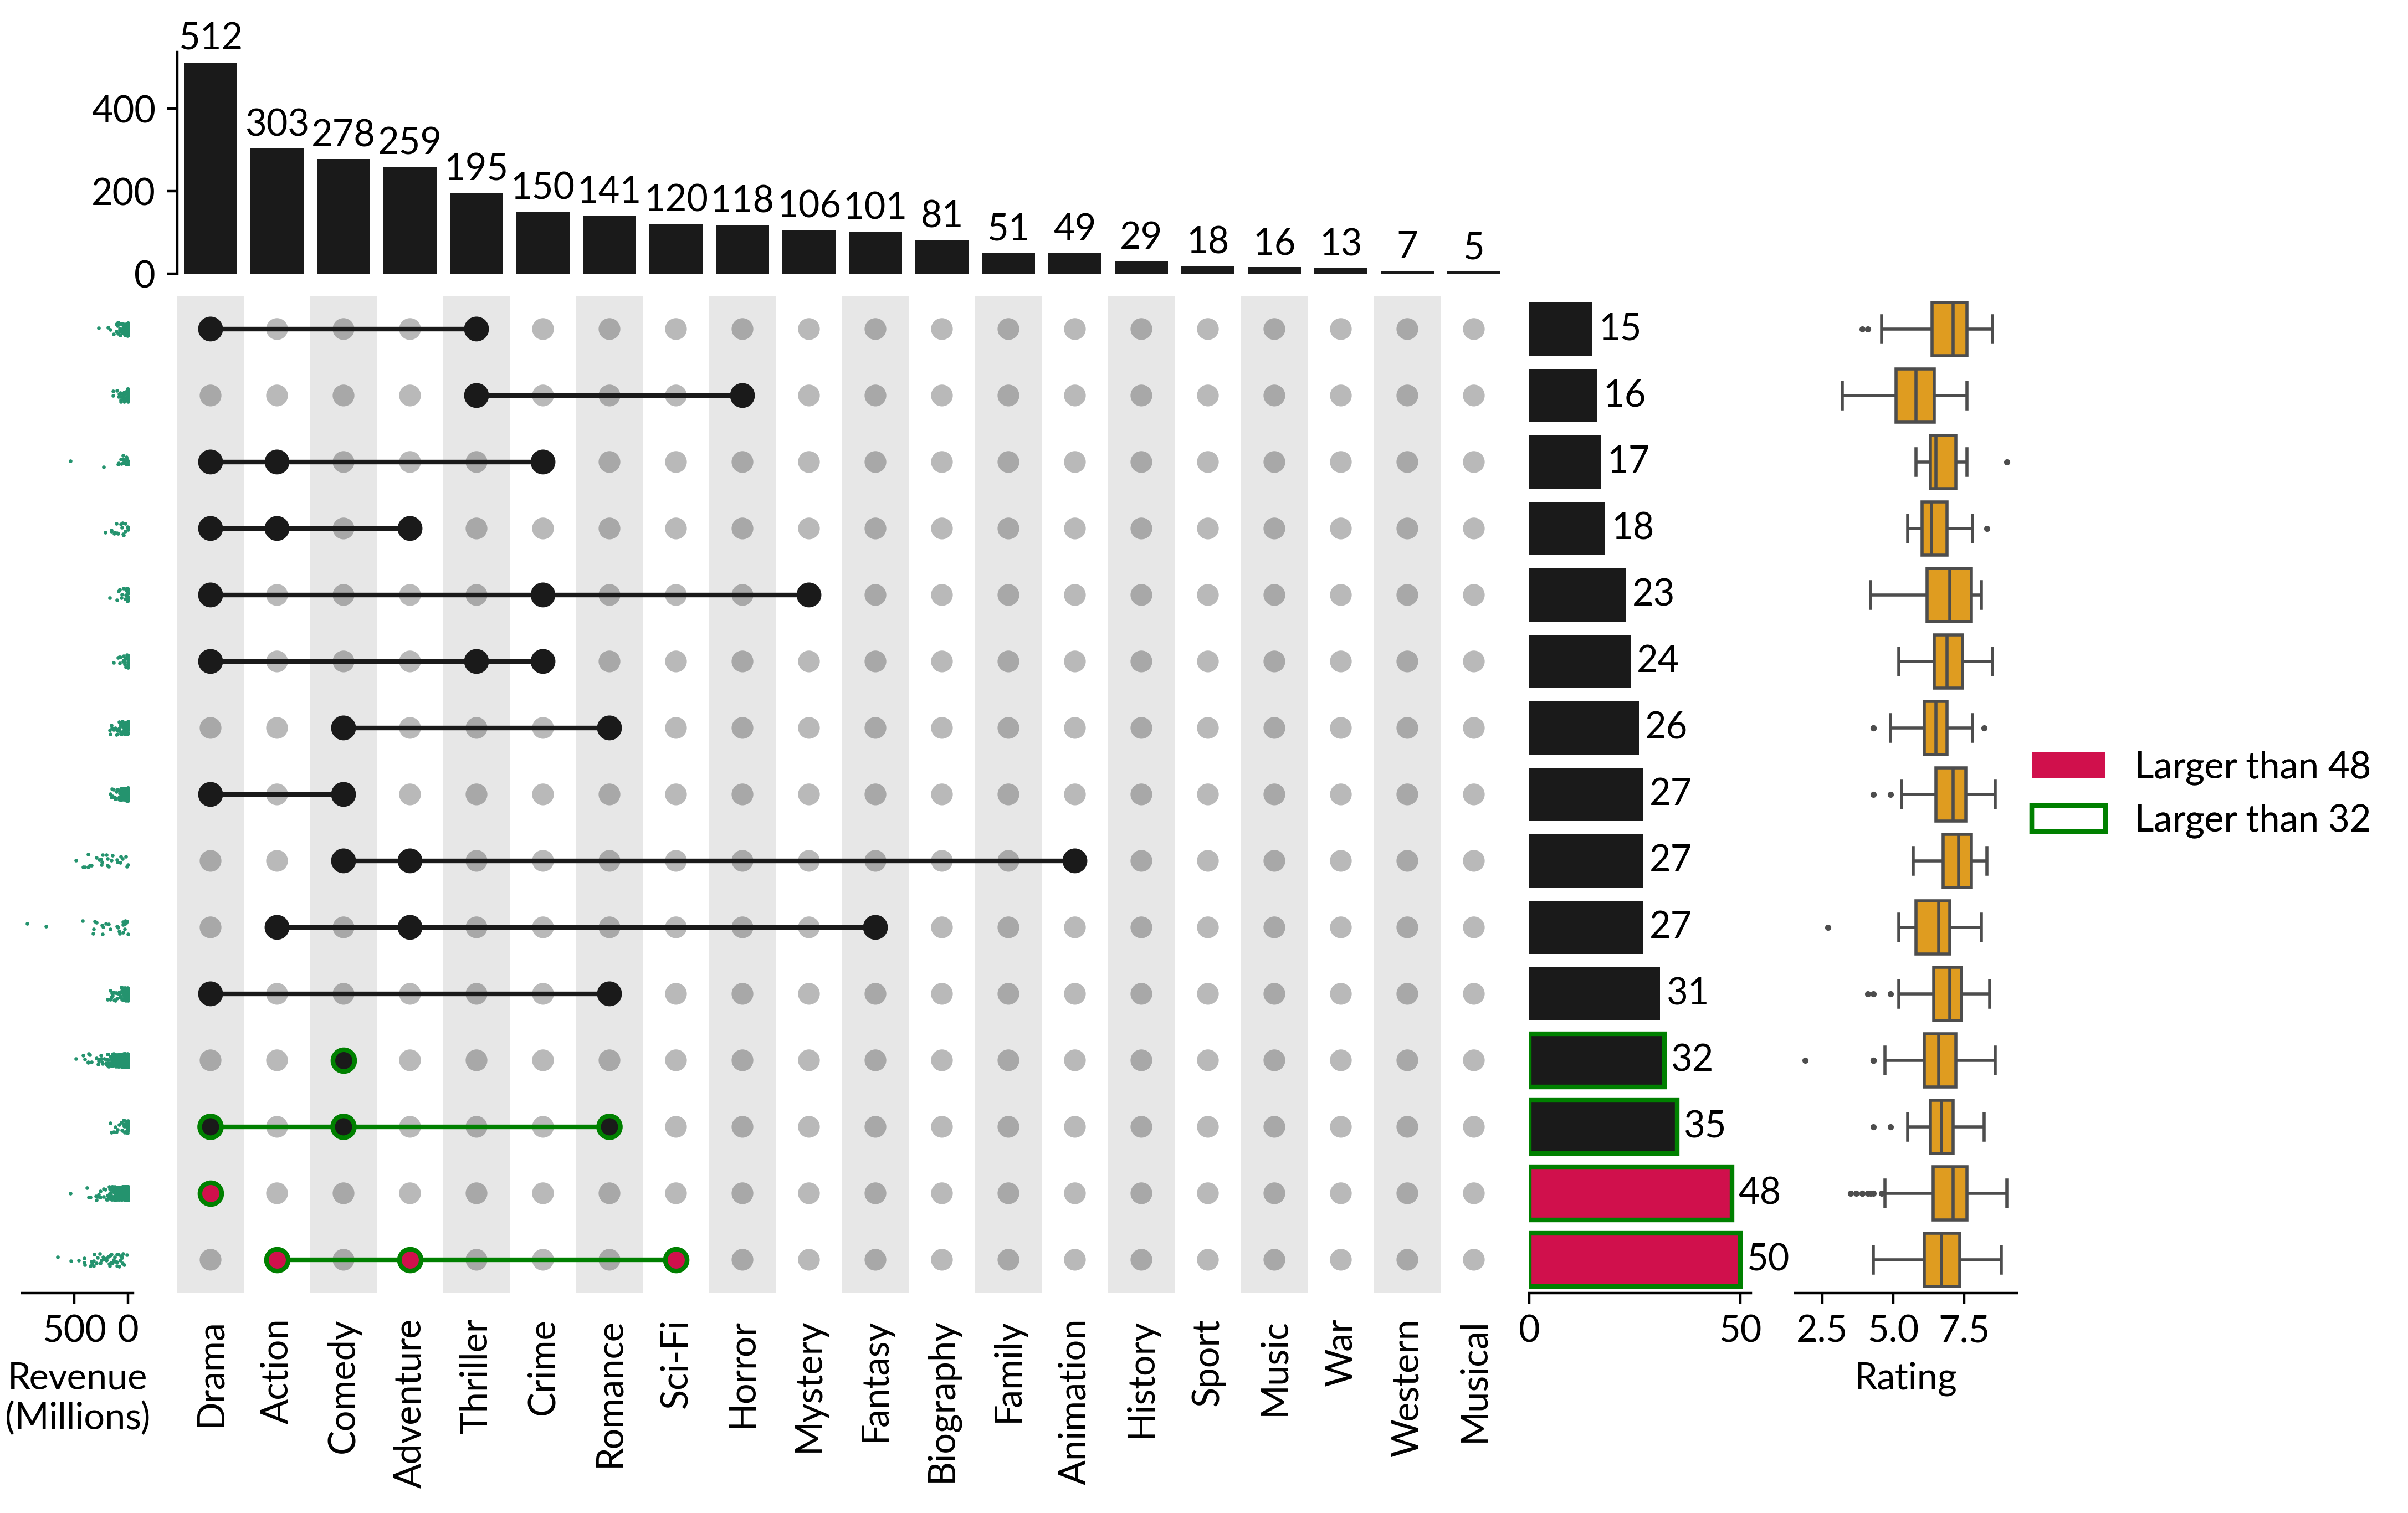
|
Project details
Verified details
These details have been verified by PyPIProject links
GitHub Statistics
Maintainers
Release history Release notifications | RSS feed


Download files
Download the file for your platform. If you're not sure which to choose, learn more about installing packages.
Source Distribution
Built Distribution
Filter files by name, interpreter, ABI, and platform.
If you're not sure about the file name format, learn more about wheel file names.
Copy a direct link to the current filters
File details
Details for the file marsilea-0.5.8.tar.gz.
File metadata
- Download URL: marsilea-0.5.8.tar.gz
- Upload date:
- Size: 73.6 kB
- Tags: Source
- Uploaded using Trusted Publishing? Yes
- Uploaded via: uv/0.9.28 {"installer":{"name":"uv","version":"0.9.28","subcommand":["publish"]},"python":null,"implementation":{"name":null,"version":null},"distro":{"name":"Ubuntu","version":"24.04","id":"noble","libc":null},"system":{"name":null,"release":null},"cpu":null,"openssl_version":null,"setuptools_version":null,"rustc_version":null,"ci":true}
File hashes
| Algorithm | Hash digest | |
|---|---|---|
| SHA256 |
9066e3004dbc1e980f4c24f37cf796d3cbaf05041eea6487edafb315959efc45
|
|
| MD5 |
a8273d5162142f8245277d15bc553131
|
|
| BLAKE2b-256 |
7a625619bd2898b12013886f0d0b1e5ea2a8658e77956606780fc8b8cdb94f23
|
File details
Details for the file marsilea-0.5.8-py3-none-any.whl.
File metadata
- Download URL: marsilea-0.5.8-py3-none-any.whl
- Upload date:
- Size: 85.0 kB
- Tags: Python 3
- Uploaded using Trusted Publishing? Yes
- Uploaded via: uv/0.9.28 {"installer":{"name":"uv","version":"0.9.28","subcommand":["publish"]},"python":null,"implementation":{"name":null,"version":null},"distro":{"name":"Ubuntu","version":"24.04","id":"noble","libc":null},"system":{"name":null,"release":null},"cpu":null,"openssl_version":null,"setuptools_version":null,"rustc_version":null,"ci":true}
File hashes
| Algorithm | Hash digest | |
|---|---|---|
| SHA256 |
0a0f0583c3bdd2a80375665a183f6b6240df47beae507aedf7d0810a917a8f52
|
|
| MD5 |
dcc1a51446e6f7b014fadac790d1a0a4
|
|
| BLAKE2b-256 |
a0e566b20fa7ce569b27c9de4974f5d3c2ffbfbfdd0330d0203d92feafd028d0
|


