Natural extensions to Matplotlib for multidimensional plotting.

Project description
Matplotlib-extensions
Extends standard matplotlib plotting functions to higher dimensions with convenient and intuitive APIs. Higher dimensions can mean e.g. including time, color or multiple figure axes.
Extended functions:
time_scatter
time_scatter extends plt.scatter(x, y, OPTIONAL: z) to accept temporally dependent spatial samples x(t), y(t), OPTIONAL: z(t) and animates it. The arguments to time_scatter, thus, has shape shape(x(t)) = (N,T), compared to the purely spatial samples of scatter with shape shape(x) = (N,).
import numpy as np
import matplotlib.pyplot as plt
from sklearn.datasets import make_swiss_roll
# sample some data (shape: (200,2))
data = make_swiss_roll(200, noise=0)[0][:, [0, 2]]
# sort data based on radial distance to origin
idxs = np.argsort(np.linalg.norm(data, axis=1))
data = data[idxs]

# Regular 2D scatter plot of data
fig, ax = plt.subplots()
ax.scatter(*data.T, alpha=0.2)

# Plot the same data, but over time using time_scatter
# the shape of data.T[:,None] is (2,1,200)
# meaning we display each sample at distinct timepoints
from mplextensions import time_scatter
time_scatter(*data.T[:,None], fps=24, fig=fig, ax=ax)
time_plot
time_plot extends plt.plot(x, y, OPTIONAL: z) to accept temporally dependent spatial samples x(t), y(t), OPTIONAL: z(t) and animates it. The arguments to time_plot, thus, has shape shape(x(t)) = (N,T), compared to the purely spatial samples of scatter with shape shape(x) = (N,).
import numpy as np
from mplextensions import time_plot

# Create a 2D sine wave
T = 100
x = np.linspace(0, 2 * np.pi, 200) # N=200
x_2d = np.tile(x[:, np.newaxis], (1, T))  # Shape: (N, T)
t_values = np.linspace(0, 2 * np.pi, T)
y_2d = np.sin(x_2d + t_values)  # Shape: (N, T)

time_plot(x_2d, y_2d)
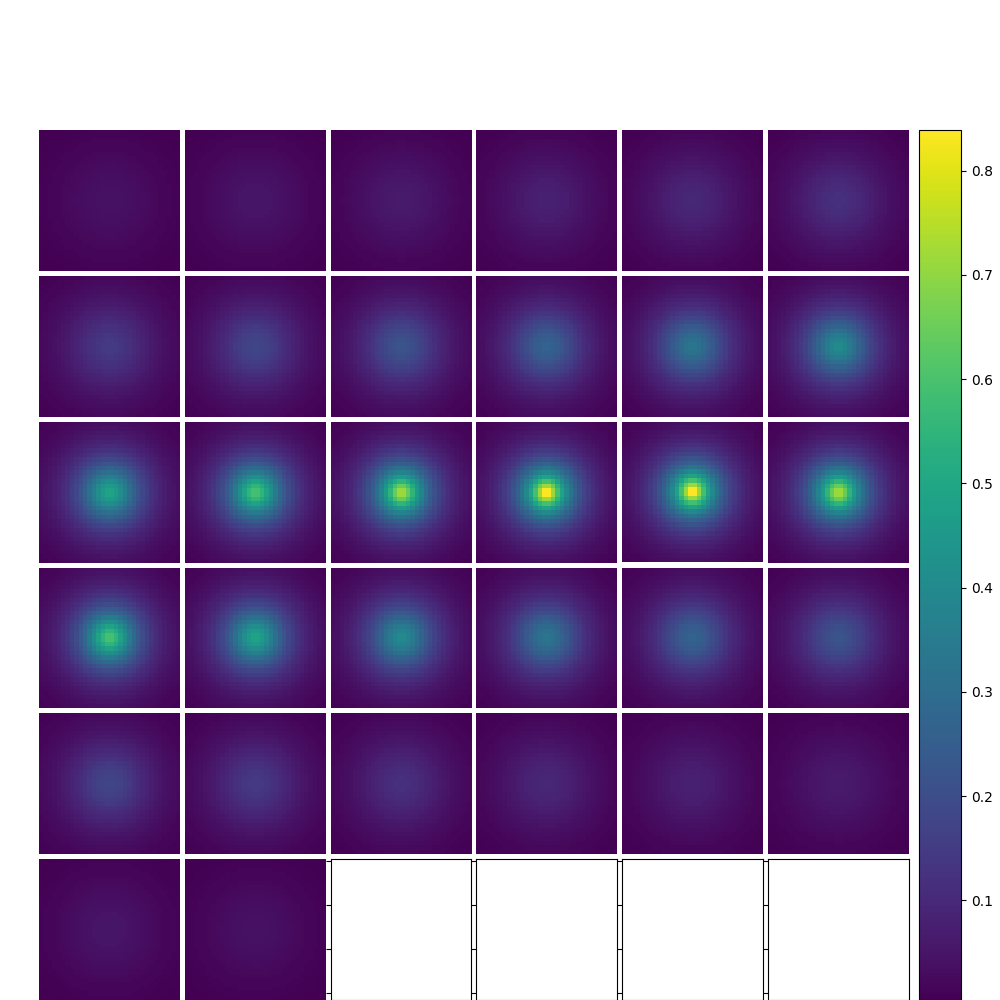
multi_imshow
multi_imshow extends plt.imshow(X) to accept 3D images and shows the slices of the first dimension on a 2D grid. The argument X has shape (N, H, W) or (N, H, W, C). number of images, height, width, and optionally channels.
import numpy as np
from mplextensions import multi_imshow

# create some 3D data
mesh = np.stack(np.meshgrid(*[np.linspace(-np.pi, np.pi, 32)]*3), axis=-1) # Shape: (32, 32, 32, 3)
mesh = np.exp(-np.linalg.norm(mesh, axis=-1)) # Shape: (32, 32, 32) => 3D Gaussian in (T, X, Y)

multi_imshow(mesh)
time_imshow
time_imshow extends plt.imshow(X) to accept 3D images and animates it along the first dimension. The argument X to time_imshow, thus, has shape (T, H, W) or (T, H, W, C). Time, height, width, and optionally channels.
import numpy as np
from mplextensions import time_imshow

# create some 3D data
mesh = np.stack(np.meshgrid(*[np.linspace(-np.pi, np.pi, 32)]*3), axis=-1) # Shape: (32, 32, 32, 3)
mesh = np.exp(-np.linalg.norm(mesh, axis=-1)) # Shape: (32, 32, 32) => 3D Gaussian in (T, X, Y)

time_imshow(mesh, add_colorbar=True)

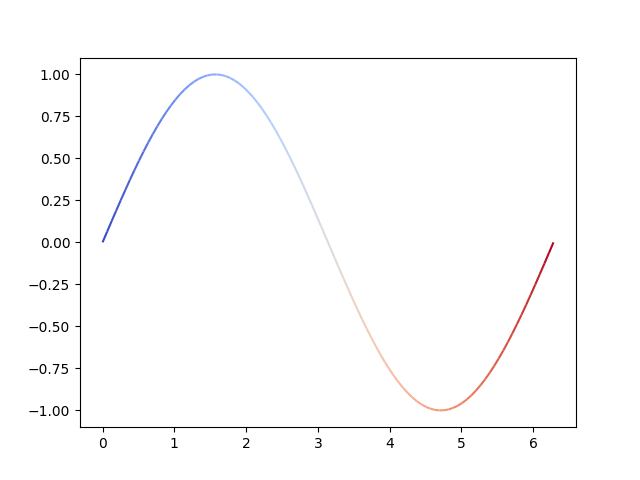
multicolor_plot
multicolor_plot extends plt.plot(X) to accept a "values" parameter which colors the plot continuously.
import numpy as np
from mplextensions import multicolor_plot

x = np.linspace(0, 2 * np.pi, 100)
y = np.sin(x)
values = y

multicolor_plot(x, y)


Download files
Download the file for your platform. If you're not sure which to choose, learn more about installing packages.
Source Distribution
Built Distribution
Filter files by name, interpreter, ABI, and platform.
If you're not sure about the file name format, learn more about wheel file names.
Copy a direct link to the current filters
File details
Details for the file matplotlib_extensions-0.2.2.tar.gz.
File metadata
- Download URL: matplotlib_extensions-0.2.2.tar.gz
- Upload date:
- Size: 7.9 kB
- Tags: Source
- Uploaded using Trusted Publishing? No
- Uploaded via: twine/6.1.0 CPython/3.13.1
File hashes
| Algorithm | Hash digest | |
|---|---|---|
| SHA256 |
4e5e2a486f17680f243a344081d5d61d34c6e5f6c48bc01c6f7f085e2995a86a
|
|
| MD5 |
defcb97a609871877b3779539e565fd0
|
|
| BLAKE2b-256 |
b8e7ebe6b3d6c087d9d4e51577986e6c6e6bb3b14a35529ddcc2edd5adb0d06f
|
File details
Details for the file matplotlib_extensions-0.2.2-py3-none-any.whl.
File metadata
- Download URL: matplotlib_extensions-0.2.2-py3-none-any.whl
- Upload date:
- Size: 8.8 kB
- Tags: Python 3
- Uploaded using Trusted Publishing? No
- Uploaded via: twine/6.1.0 CPython/3.13.1
File hashes
| Algorithm | Hash digest | |
|---|---|---|
| SHA256 |
6f1338e6fc10647ce228cb668604877f4663091853003f7bb52ca4b9ba823360
|
|
| MD5 |
7324565a6a3ee2736b9c23b5ca882eca
|
|
| BLAKE2b-256 |
4361eb805cb9c628b68edea9c45ef74a39c24246ab45fdaacc7f712e24253258
|


