
matplotobjlib
This module is a wrapper for matplotlib, that enables creating plots in an easier declarative, more object-oriented format.
All functions and types are importable directly from matplotobjlib. The easiest way to get started is with matplotoblib.draw(...). This function takes either a single Suplot object or a 2d sequence of Subplots where each inner sequence represents a row. Each Subplot consists of 1 or more Plotables, the most useful being Graph.
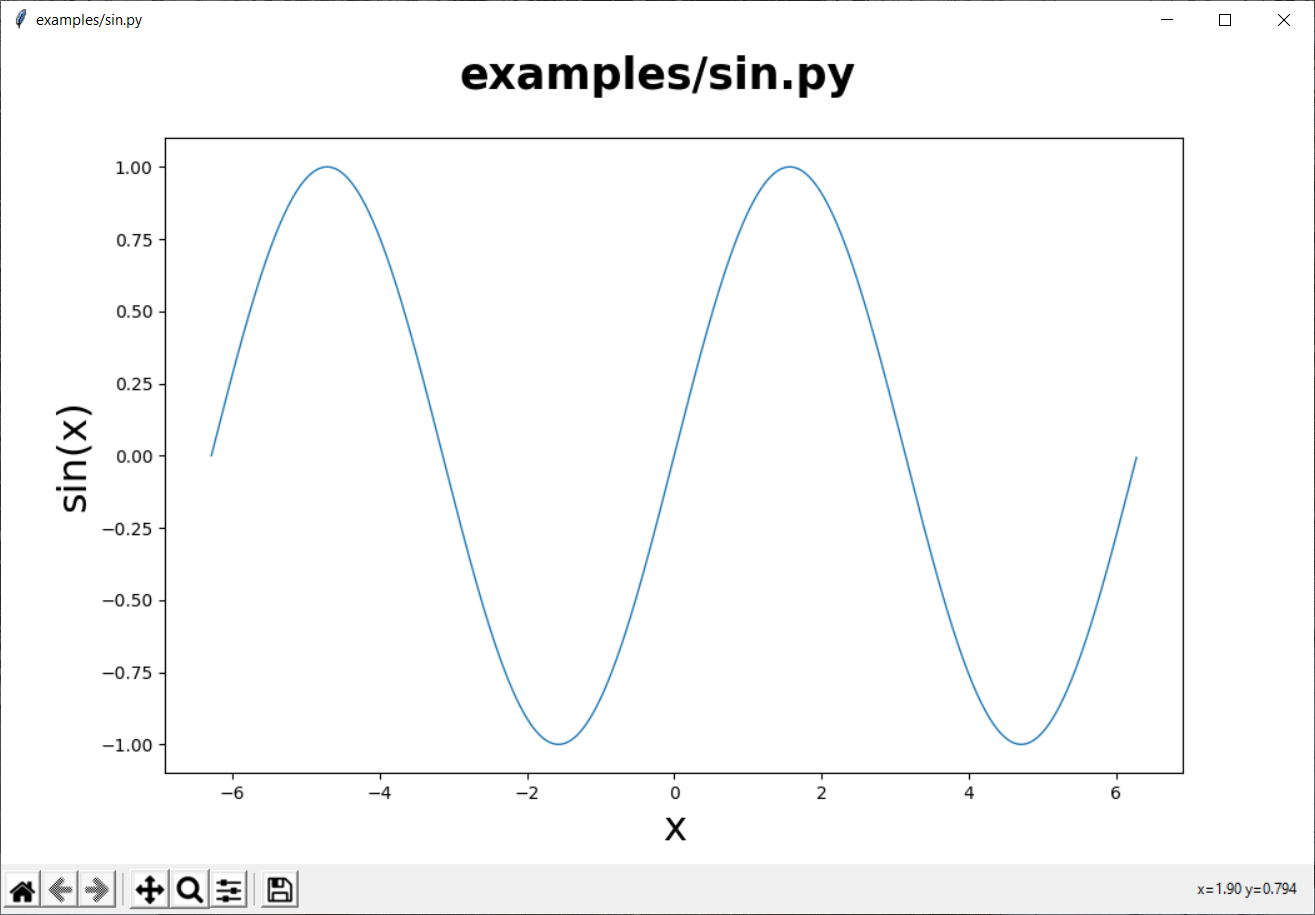
# examples/sin.py

from matplotobjlib import draw, Graph, SubPlot
import numpy as np

xs = np.arange(-2*np.pi, 2*np.pi, 0.01)
ys = np.sin(xs)
draw(SubPlot(Graph(xs, ys, plot_type="-"), x_label="x", y_label="sin(x)"), title="sin")
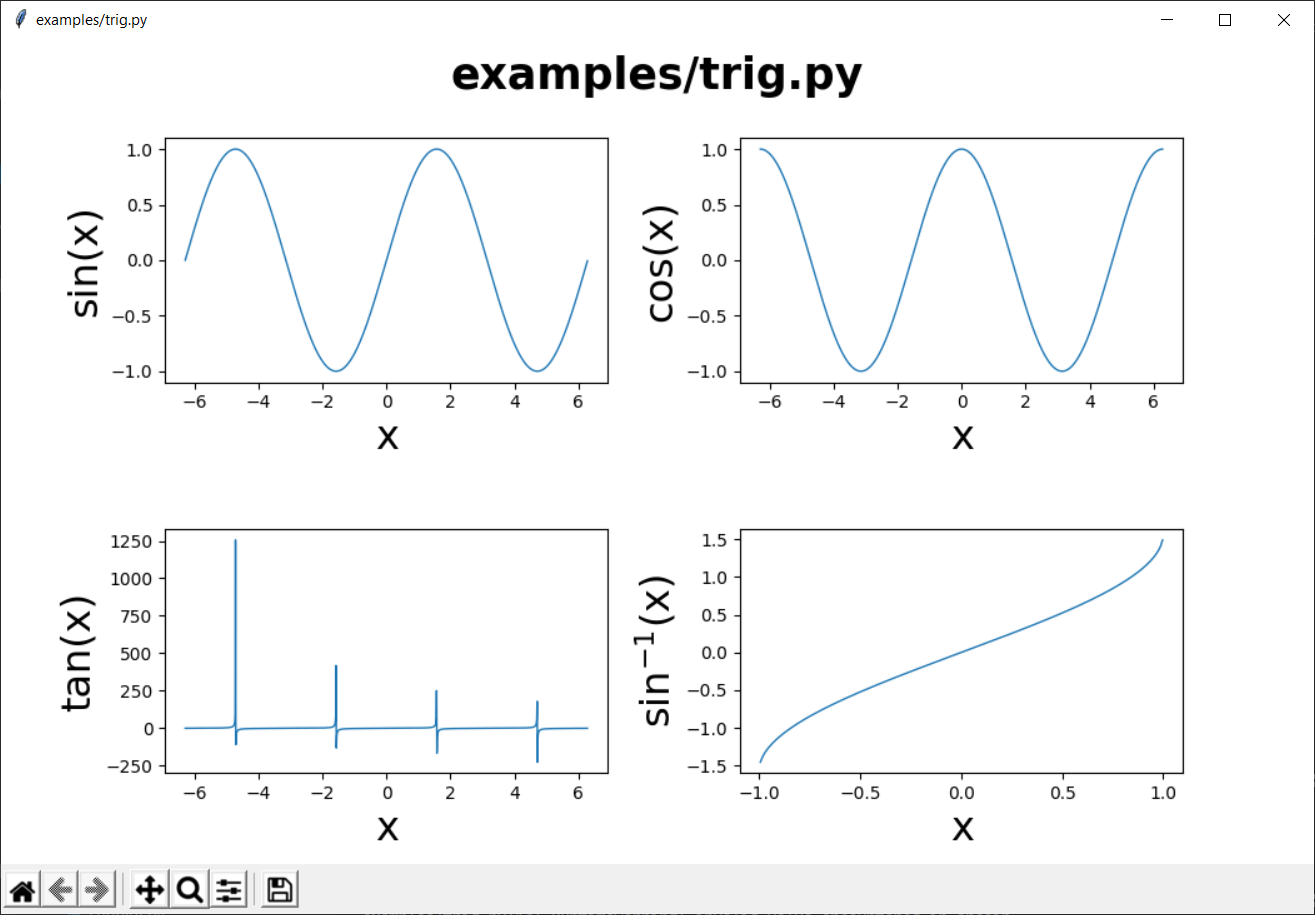
# examples/trig.py

from matplotobjlib import draw, Graph, SubPlot
import numpy as np

xs = np.arange(-2*np.pi, 2*np.pi, 0.01)
draw(
    [
        [
            SubPlot(Graph(xs, np.sin(xs), plot_type="-"), x_label="x", y_label="sin(x)"),
            SubPlot(Graph(xs, np.cos(xs), plot_type="-"), x_label="x", y_label="cos(x)"),
        ],
        [
            SubPlot(Graph(xs, np.tan(xs), plot_type="-"), x_label="x", y_label="tan(x)"),
            SubPlot(Graph(xs, np.arcsin(xs), plot_type="-"), x_label="x", y_label="sin$^{-1}$(x)"),
        ]
    ],
    title="Trigonometry",
)
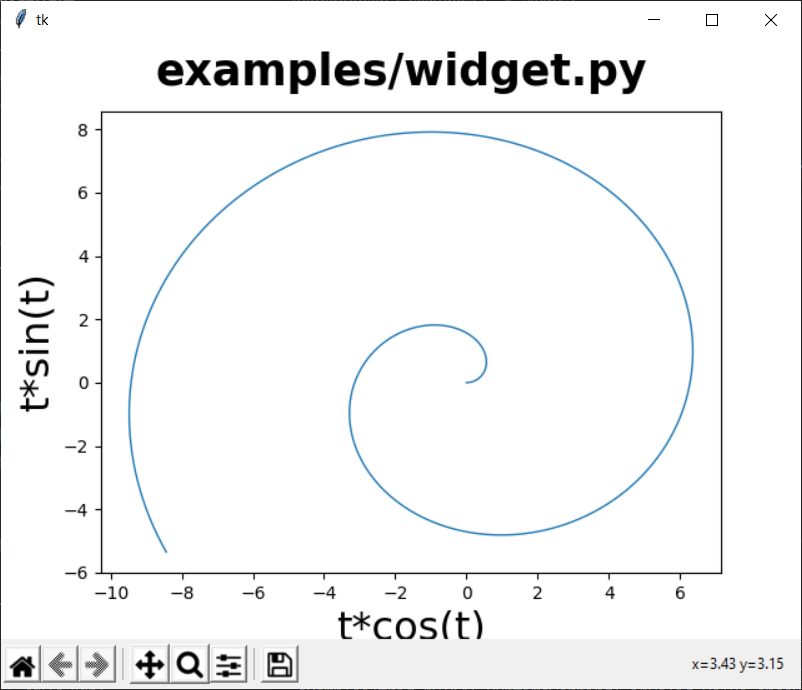
Additionally, for more control over the window, it can be accessed as a tkinter widget through TkFigure. The draw(...) function even uses this internally.
# examples/widget.py

import tkinter as tk
import numpy as np
from matplotobjlib import Graph, SubPlot, TkFigure

ts = np.arange(0, 10, 0.01)
xs = [t * np.cos(t) for t in ts]
ys = [t * np.sin(t) for t in ts]

root = tk.Tk()
widget = TkFigure(
    root, [[SubPlot(Graph(xs, ys, plot_type="-"), x_label="t*cos(t)", y_label="t*sin(t)")]], title="examples/widget.py"
)
widget.pack(expand=tk.YES, fill=tk.BOTH)
root.mainloop()
1 maintainer

Metadata
1 maintainer
Release files for matplotobjlib 1.0.1
For a detailed explanation of source distributions (sdists) and built distributions (wheels), please see the package formats documentation.
Source distribution (sdist)
| File | Size | Uploaded | |
|---|---|---|---|
| matplotobjlib-1.0.1.tar.gz | 9.4 kB | Details |
Built distribution (wheel)
| File | Interpreter | ABI | Platform | Reset |
|---|---|---|---|---|
| matplotobjlib-1.0.1-py3-none-any.whl | Python 3 | none | any | Details |
Total release size: 20.9 kB
Release files / matplotobjlib-1.0.1.tar.gz
| Download URL | matplotobjlib-1.0.1.tar.gz |
|---|---|
| Size | 9.4 kB |
| Tags | Source |
|
SHA-256 checksum How to use checksums |
fe902b0ed588fc57d9ffac051ecca9f34853a36a95293f4d0774da579340a8de
|
|
BLAKE2b-256 checksum How to use checksums |
04fe6c624ef98bdda26359be87a33f0d1a4c4d3a7db7119e4639928e5b4bf57a
|
| Upload date | |
|
Uploaded using Trusted Publishing? What is trusted publishing? |
No |
| Uploaded via |
twine/3.2.0 pkginfo/1.5.0.1 requests/2.24.0 setuptools/50.3.0 requests-toolbelt/0.9.1 tqdm/4.50.2 CPython/3.8.1
|
Release files / matplotobjlib-1.0.1-py3-none-any.whl
| Download URL | matplotobjlib-1.0.1-py3-none-any.whl |
|---|---|
| Size | 11.5 kB |
| Tags | Python 3 |
|
SHA-256 checksum How to use checksums |
1866d6ad2e010c7c832dc4569d2809112d334c0a3bf86f3df6f971d0491510e6
|
|
BLAKE2b-256 checksum How to use checksums |
14dba617ca5d8403639b55ce367fc2cc491111acfbc56e395003710842e62fb0
|
| Upload date | |
|
Uploaded using Trusted Publishing? What is trusted publishing? |
No |
| Uploaded via |
twine/3.2.0 pkginfo/1.5.0.1 requests/2.24.0 setuptools/50.3.0 requests-toolbelt/0.9.1 tqdm/4.50.2 CPython/3.8.1
|














