matviz: matrix data visualization

Project description
matviz


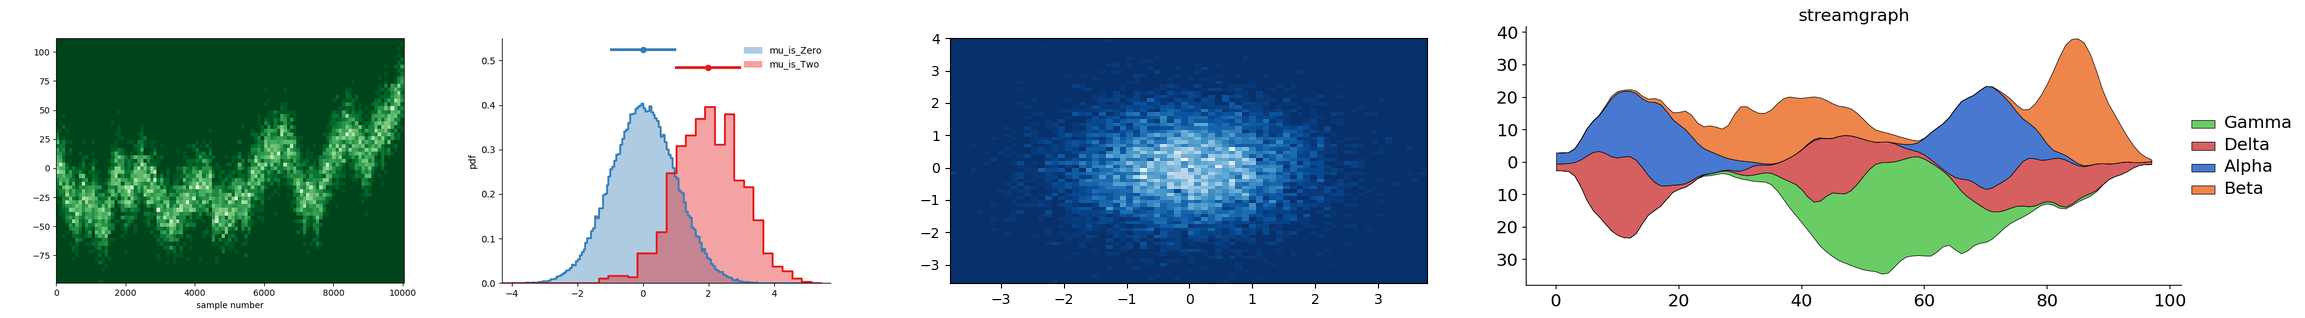
Data visualization for scientists, made easy. Smart histograms, publication-ready plots, and data wrangling utilities.
Installation
pip install matviz
Quick start
from matviz.helpers import *

# Compare distributions with automatic binning
data = {'Control': np.random.randn(10000), 'Treatment': np.random.randn(5000) + 1}
nhist(data)

# 2D histogram from complex numbers
z = (5 + np.random.randn(1000)) * np.exp(1j * np.random.randn(1000))
ndhist(z, smooth=1)
Modules
| Module | Description |
|---|---|
histogram_utils |
Smart 1D (nhist) and 2D (ndhist) histograms with automatic binning |
viz |
Plot ranges, streamgraphs, log-fitting, polar grids, complex plots, nicefy |
etl |
nan_smooth, cross-correlation, JSON with complex numbers, time utilities |
cbrt_scale |
Cube-root axis scale for matplotlib |
circle_utils |
Smallest enclosing circle and convex hull area |
datetime_converter |
Reversible timestamp codec (DateCodec) |
doctools |
PDF image extraction and compression |
helpers |
MATLAB-like environment with all imports |
Documentation
Full documentation at matviz.readthedocs.io.
License
BSD-3-Clause
Release history Release notifications | RSS feed


Download files
Download the file for your platform. If you're not sure which to choose, learn more about installing packages.
Source Distribution
matviz-1.0.6.tar.gz
(1.5 MB
view details)
Built Distribution
Filter files by name, interpreter, ABI, and platform.
If you're not sure about the file name format, learn more about wheel file names.
Copy a direct link to the current filters
matviz-1.0.6-py3-none-any.whl
(45.8 kB
view details)
File details
Details for the file matviz-1.0.6.tar.gz.
File metadata
- Download URL: matviz-1.0.6.tar.gz
- Upload date:
- Size: 1.5 MB
- Tags: Source
- Uploaded using Trusted Publishing? No
- Uploaded via: twine/6.2.0 CPython/3.14.3
File hashes
| Algorithm | Hash digest | |
|---|---|---|
| SHA256 |
925f10d0cf9c811aa9bb9eeb19c865c0ffc4b99823de46b4c424b50c52352fbc
|
|
| MD5 |
4974a92effcc747371de450078385e5d
|
|
| BLAKE2b-256 |
18e1986cc0c26ab9472e178f4050ba0097e5408b6fcbf14eb12b75ab0781cb41
|
File details
Details for the file matviz-1.0.6-py3-none-any.whl.
File metadata
- Download URL: matviz-1.0.6-py3-none-any.whl
- Upload date:
- Size: 45.8 kB
- Tags: Python 3
- Uploaded using Trusted Publishing? No
- Uploaded via: twine/6.2.0 CPython/3.14.3
File hashes
| Algorithm | Hash digest | |
|---|---|---|
| SHA256 |
decb34c5c2bf12d285f3b8c4dd749330a444cfdba7706c00194c17e705ea94bb
|
|
| MD5 |
27f6c90a09e8fbba226bbe7712f3583c
|
|
| BLAKE2b-256 |
2f40d613f8c785a6f3cd3b20cb976015cb8f5d82320e5c6401ef047007dbf3a0
|


