
Lightweight observability for MCP agent interactions — capture every tool call, generate visual audit trails.

Project description
mcp-audit-trail
Your MCP agent just called 14 tools, accessed employee records, and submitted a PTO request. Do you know what actually happened?
This library sits between any MCP client and server as a transparent proxy, logs every JSON-RPC message, and spits out an HTML report you can actually read. Zero changes to your server code. Zero runtime dependencies.


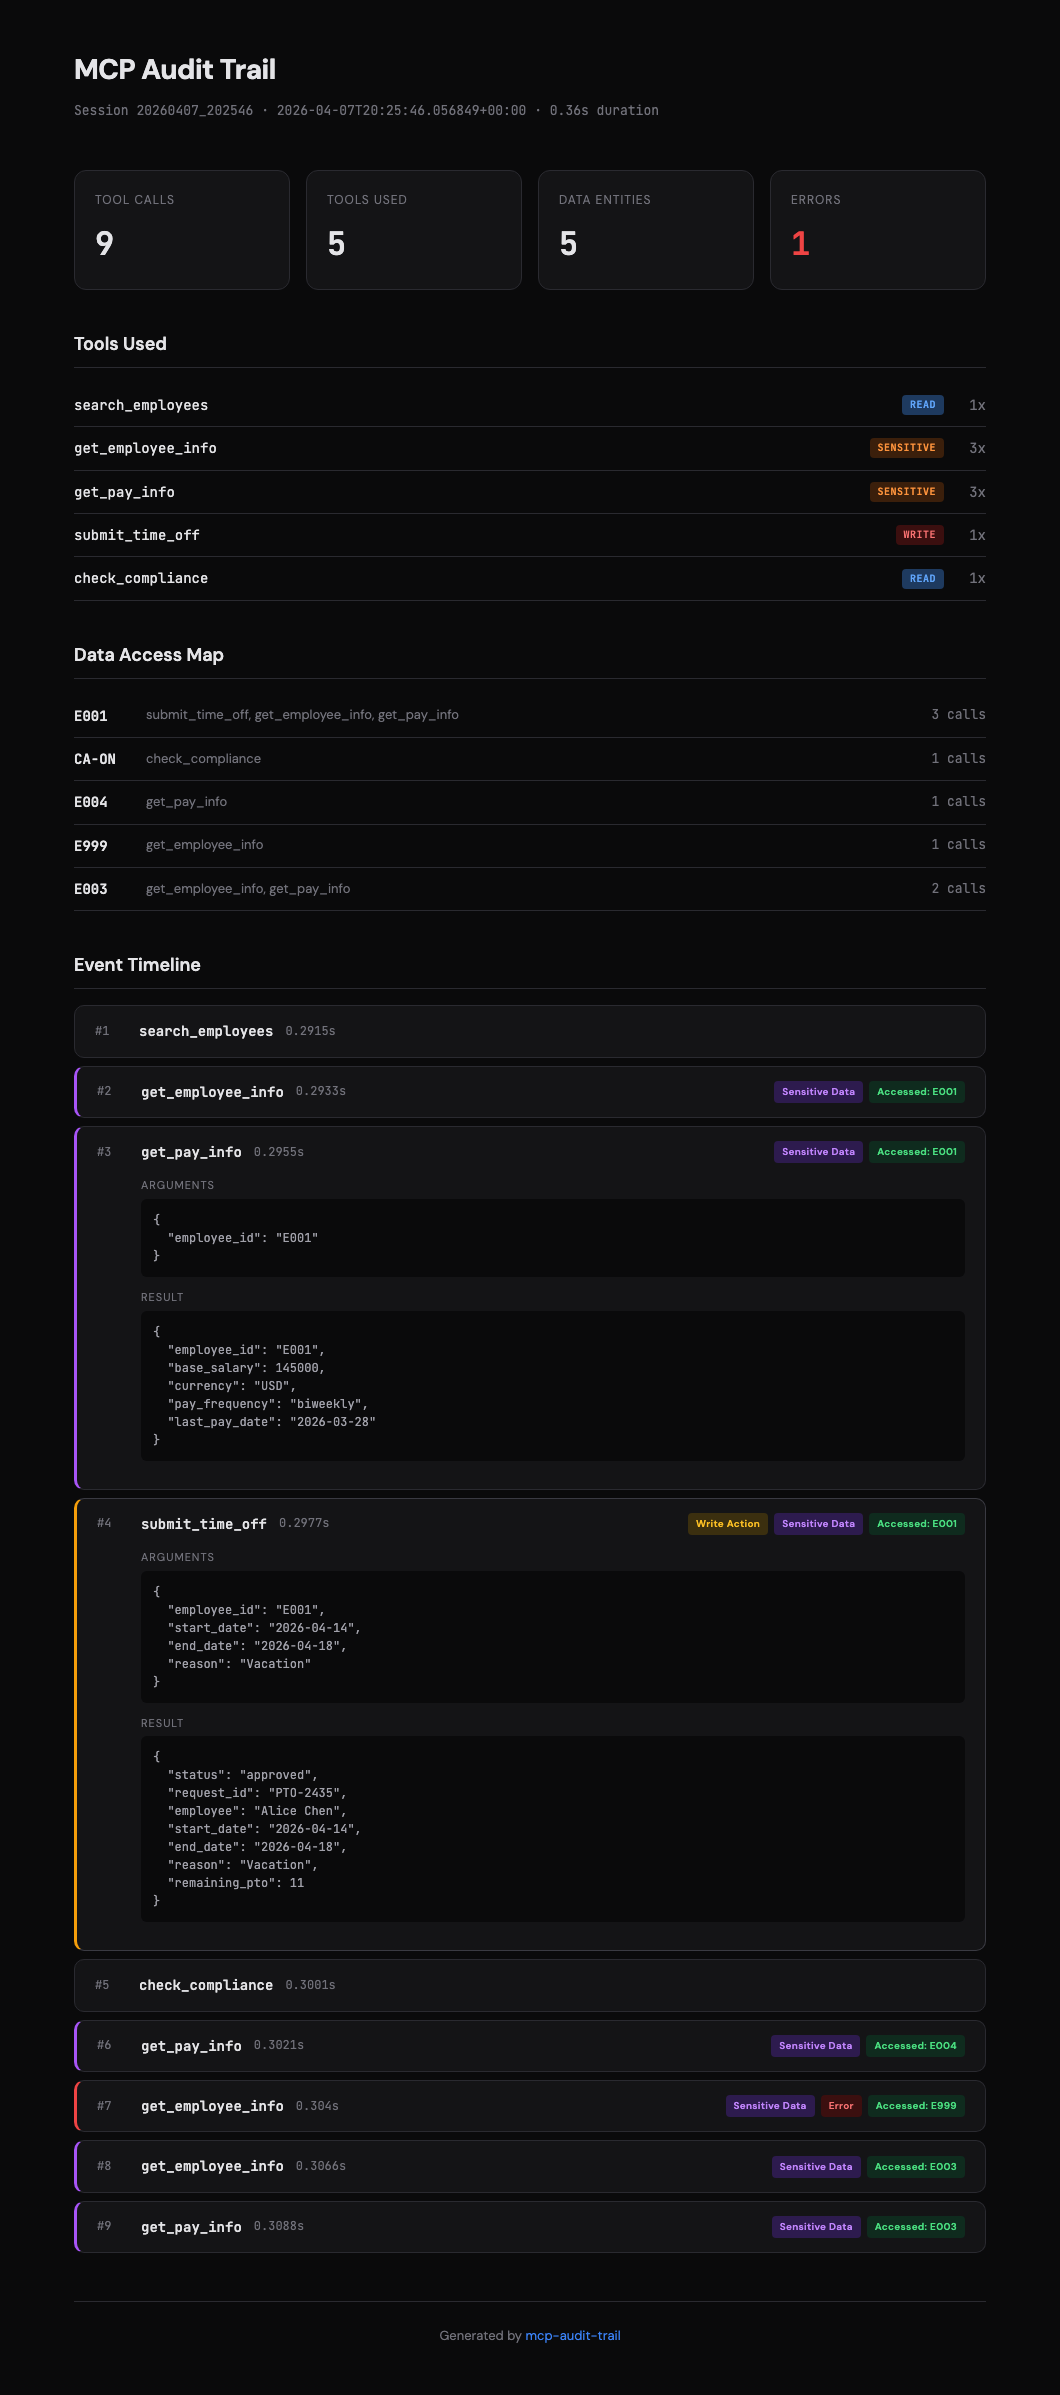
The problem
MCP gives agents the ability to call tools, query databases, and take real actions. That's great until you need to answer questions like:
- What data did the agent actually read?
- Did it access anything it shouldn't have?
- Which tool call failed, and what arguments did it pass?
- Who approved that PTO request — a human or the model?
Application logs won't tell you this. You need something that understands the MCP protocol itself.
Install
pip install mcp-audit-trail
No runtime dependencies. Seriously — the core library is pure Python stdlib. You only need the mcp SDK if you want to run the included demo server.
Quickstart
1. Proxy your server (nothing to change)
Stick the proxy between your client and server. Both sides think they're talking to each other directly.
mcp-audit-proxy \
  --server "python my_server.py" \
  --log audit.json \
  --sensitive-tools get_pay_info get_ssn \
  --write-tools submit_time_off delete_record
That's it. Every message flows through, gets logged to audit.json, and lands on the other side untouched.
2. Turn the log into something readable
mcp-audit-report --input audit.json --output report.html
Open report.html in a browser:
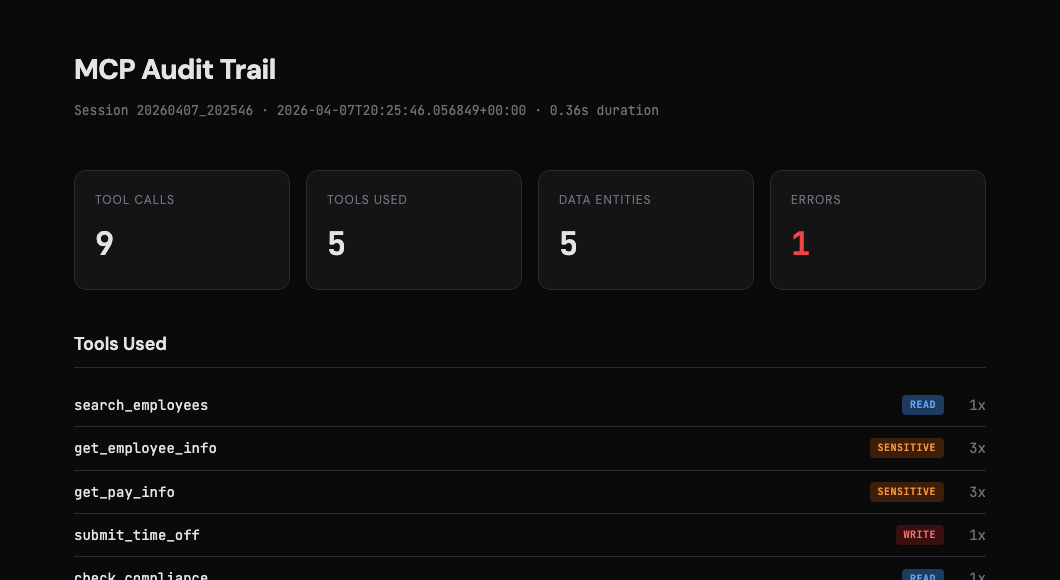
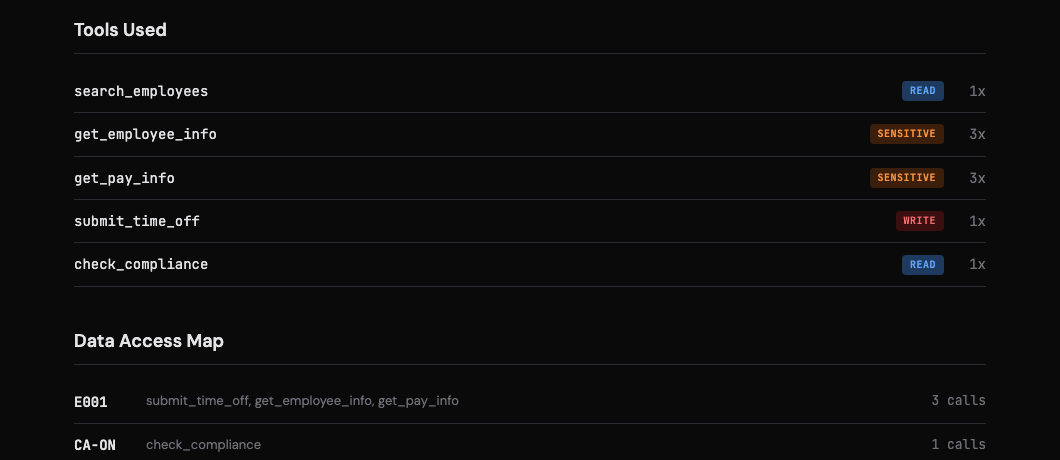
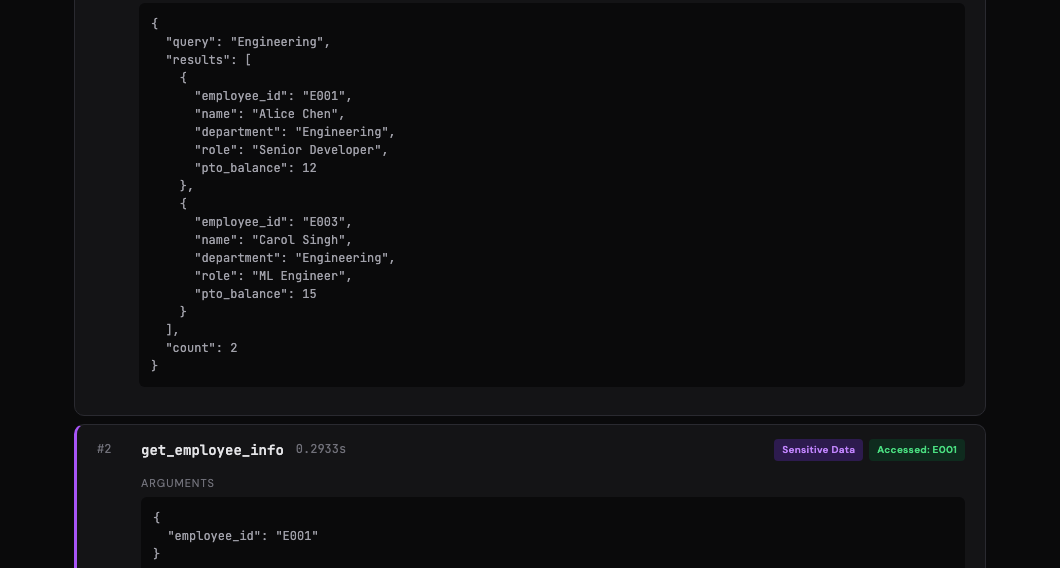
You get a session summary, tool classification (read/write/sensitive), a data access map, and an interactive timeline — click any event to expand the full arguments and results.
3. Or just use it from Python
from mcp_audit_trail import AuditLogger, generate_report

# log some events
logger = AuditLogger(
    "audit.json",
    sensitive_tools={"get_pay_info"},
    write_tools={"submit_time_off"},
)

logger.log("client_to_server", {
    "method": "tools/call",
    "id": 1,
    "params": {"name": "get_pay_info", "arguments": {"employee_id": "E001"}},
})

logger.save()

# render a report from any existing log
generate_report("audit.json", "report.html")
If you pass output_path=None to generate_report(), it returns the HTML string directly instead of writing to disk. Handy if you want to serve it from a web app or pipe it somewhere.
What gets logged
Every event in the audit log looks roughly like this:
{
  "timestamp": "2026-04-07T10:23:01.442Z",
  "elapsed_seconds": 1.2034,
  "direction": "client_to_server",
  "method": "tools/call",
  "tool_name": "get_pay_info",
  "tool_arguments": { "employee_id": "E001" },
  "flags": ["sensitive"]
}
The logger automatically pulls out tool names, arguments, and results from the JSON-RPC messages. It tracks:
- Tool calls — name, arguments, result (parsed from
tools/callrequests + responses) - Timestamps — both wall-clock ISO format and elapsed seconds since session start
- Data entities — any argument containing
idoremployeein the key name gets tracked as an accessed entity - Errors — flagged in both the event and the session summary
- Direction —
client_to_serverorserver_to_client - Custom flags — mark tools as
sensitiveorwriteand they show up tagged in the log and report
The final JSON file also includes a summary block at the top with aggregate stats, so you don't have to parse individual events for the common questions.
Flagging tools
Not all tool calls are equal. Reading a compliance rulebook is different from accessing someone's salary or approving a vacation request.
You can tell the logger (or the CLI) which tools are which:
mcp-audit-proxy \
  --server "python hr_server.py" \
  --sensitive-tools get_pay_info get_employee_info get_ssn \
  --write-tools submit_time_off delete_record update_profile
Or in Python:
logger = AuditLogger(
    "audit.json",
    sensitive_tools={"get_pay_info", "get_employee_info"},
    write_tools={"submit_time_off"},
)
Flagged events get tagged in the JSON log and highlighted in the HTML report. Sensitive tools show up in red, write actions in orange. Makes it easy to scan a long session for the stuff that matters.
CLI reference
mcp-audit-proxy — transparent stdio proxy
mcp-audit-proxy --server COMMAND [--log PATH] [--sensitive-tools TOOLS...] [--write-tools TOOLS...]
| Flag | Default | What it does |
|---|---|---|
--server |
(required) | Shell command to start the MCP server |
--log |
audit_log.json |
Where to write the JSON audit log |
--sensitive-tools |
(none) | Space-separated list of tools to flag as sensitive |
--write-tools |
(none) | Space-separated list of tools to flag as write actions |
mcp-audit-report — HTML report generator
mcp-audit-report --input PATH [--output PATH]
| Flag | Default | What it does |
|---|---|---|
--input |
audit_log.json |
Path to the JSON audit log |
--output |
audit_report.html |
Where to write the HTML report |
Python API
Three things are exported from the top-level package:
| Export | What it is |
|---|---|
AuditLogger |
The core logger class. Create one, call .log() for each message, call .save() when you're done. Thread-safe. |
run_proxy(server_command, log_path, ...) |
Starts a server subprocess and proxies all stdio through the logger. Blocking — runs until the server exits. |
generate_report(input_path, output_path, ...) |
Reads a JSON audit log, writes (or returns) an HTML report. |
from mcp_audit_trail import AuditLogger, run_proxy, generate_report
AuditLogger is probably what you want if you're integrating into existing code. run_proxy is more of a "start and forget" wrapper — it's what the CLI uses under the hood.
Try the demo
There's a sample HR server in the repo with fake employee data, pay info, compliance rules, and a PTO system. The demo script runs a bunch of tool calls against it and generates a report.
git clone https://github.com/khushidahi/mcp-audit-trail.git
cd mcp-audit-trail
pip install -e ".[demo]"
python -m examples.run_demo
Then open audit_report.html. The demo covers the main scenarios: regular reads, sensitive data access, write actions, cross-department lookups, and an error case (querying an employee that doesn't exist).
Running tests
pip install -e ".[dev]"
pytest
There are ~55 tests covering the logger, report generator, CLI, and a full integration test that runs real MCP tool calls against the sample server.
Project layout
mcp_audit_trail/
    __init__.py         → public API (AuditLogger, run_proxy, generate_report)
    proxy.py            → the audit logger + stdio proxy
    report.py           → HTML report generator
    cli.py              → CLI entry points
examples/
    sample_server.py    → demo MCP server with HR tools
    run_demo.py         → end-to-end demo script
tests/                  → pytest suite
pyproject.toml          → package config (hatchling)
Known limitations
- The proxy works over stdio only — no SSE/HTTP transport yet
- Entity detection is heuristic (looks for
id/employeein argument keys). Works well for common patterns but won't catch everything - The HTML report is self-contained (no external assets) but it's not designed for logs with thousands of events — it'll work, just gets long
- No built-in log rotation or multi-session merging
License
MIT — do whatever you want with it.
If you run into issues or have ideas, open an issue. PRs welcome.
Release history Release notifications | RSS feed


Download files
Download the file for your platform. If you're not sure which to choose, learn more about installing packages.
Source Distribution
Built Distribution
Filter files by name, interpreter, ABI, and platform.
If you're not sure about the file name format, learn more about wheel file names.
Copy a direct link to the current filters
File details
Details for the file mcp_audit_trail-0.1.1.tar.gz.
File metadata
- Download URL: mcp_audit_trail-0.1.1.tar.gz
- Upload date:
- Size: 279.5 kB
- Tags: Source
- Uploaded using Trusted Publishing? No
- Uploaded via: twine/6.2.0 CPython/3.13.11
File hashes
| Algorithm | Hash digest | |
|---|---|---|
| SHA256 |
07856ce6559f5a3e3f477ee74d072d504c29d4b5971a6f2c0c0af3f4dcf3d919
|
|
| MD5 |
c0a7afacebc8553eed87c2bf671093b6
|
|
| BLAKE2b-256 |
563ee875e63f07ede270a1f89298e036b3714fa911edcf5de0952e8d345fb662
|
File details
Details for the file mcp_audit_trail-0.1.1-py3-none-any.whl.
File metadata
- Download URL: mcp_audit_trail-0.1.1-py3-none-any.whl
- Upload date:
- Size: 14.1 kB
- Tags: Python 3
- Uploaded using Trusted Publishing? No
- Uploaded via: twine/6.2.0 CPython/3.13.11
File hashes
| Algorithm | Hash digest | |
|---|---|---|
| SHA256 |
2ceaa0bafcf3dfa43d485630126bde13f2c7faba1333dc1ba704bc88c8be7342
|
|
| MD5 |
61ce6c02e4ecc2871c37d24a806e6600
|
|
| BLAKE2b-256 |
6dd18ac45730c348be62470fdf86ceaf4ace1660b706cbc6728ea0332f56c163
|






