
mcp-toolgauge



Find out why your MCP server's tools don't get called.
mcp-toolgauge audits an MCP server three ways — a static linter for names, descriptions
and schemas; a dynamic evaluator that measures whether a model actually picks the right
tool; and a CI gate with a score badge — to answer the one question a server author keeps
hitting: why don't my tools get selected?
Quickstart
No install step — uvx fetches and runs it:
uvx mcp-toolgauge lint ./your-server    # static rules, offline, no API key, free
uvx mcp-toolgauge eval ./your-server    # does a model actually pick the right tool?
uvx mcp-toolgauge ci   ./your-server    # roll both into one 0–100 score to gate on
Point any of them at a directory, a script, or a URL — it finds your server the way an MCP
client does. Every command is read-only: it lists your tools and disconnects, and never
invokes one of them. Prefer a persistent install? uv tool install mcp-toolgauge, or
pipx install mcp-toolgauge. The examples below write it as the bare mcp-toolgauge command;
uvx mcp-toolgauge in front of any of them works the same with nothing installed.
Status. All six milestones are built:
inspect,lintagainst 22 rules,evalfor tool-selection accuracy with a confusion matrix, a compositecihealth score with a badge and a GitHub Action, and a dashboard. The badge above is mcp-toolgauge scoring its owngoodserverfixture — it dogfoods itself. This README describes only what works today.
Lint
mcp-toolgauge lint ./path/to/your/server
acme-directory 0.4.2
python server.py

(server)
  MCP004  warning  Tool names mix conventions: 4 snake_case, 1 camelCase. The odd
                   ones out are doStuff.

  [... one tool trimmed ...]

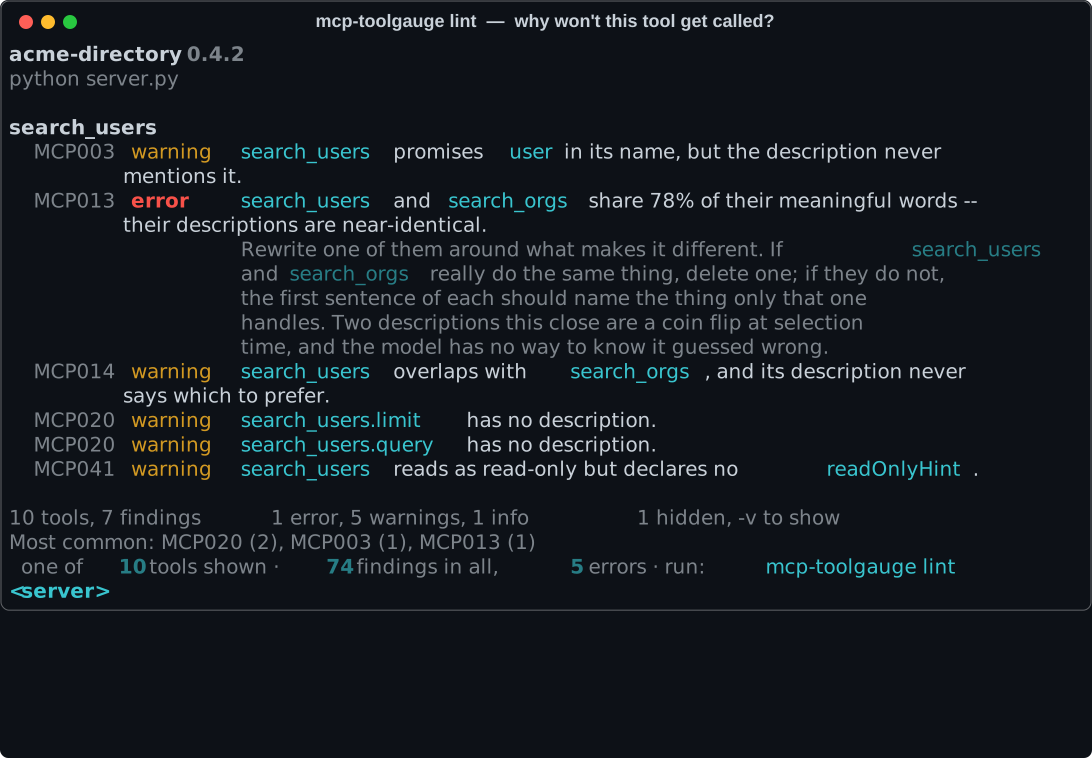
search_users
  MCP003  warning  search_users promises user in its name, but the description never
                   mentions it.
  MCP013  error    search_users and search_orgs share 78% of their meaningful words
                   -- their descriptions are near-identical.
                   Rewrite one of them around what makes it different. If
                   search_users and search_orgs really do the same thing, delete one;
                   if they do not, the first sentence of each should name the thing
                   only that one handles. Two descriptions this close are a coin flip
                   at selection time, and the model has no way to know it guessed
                   wrong.
  MCP014  warning  search_users overlaps with search_orgs, and its description never
                   says which to prefer.
  MCP020  warning  search_users.limit has no description.
  MCP020  warning  search_users.query has no description.
  MCP041  warning  search_users reads as read-only but declares no readOnlyHint.

  [... eight tools trimmed ...]

10 tools, 74 findings   5 errors, 53 warnings, 16 info   16 hidden, -v to show
Most common: MCP020 (25), MCP025 (10), MCP042 (6)
That MCP013 line is the whole point. Two sibling tools whose descriptions are near-copies
are a coin flip at selection time, and it is a coin flip nobody observes: the call
succeeds, returns plausible data, and the wrong tool quietly takes a share of the traffic
meant for its sibling.
Every rule is deterministic and offline. No model is called, nothing is sent anywhere,
and nothing is charged — which is what makes this runnable on every pull request. Like
inspect, it never invokes one of your tools.
What it checks
22 rules in five families. Each has a page explaining why it matters, with a before and after.
| Naming | Near-duplicate names, names built only from filler, names whose subject never appears in the description, mixed conventions |
| Descriptions | Missing, fragmentary, restating the name, near-identical to a sibling's, overlapping with no guidance on which to prefer, placeholder text |
| Parameters | Undocumented, restating their own name, free strings that should be enums, dates and emails with no format, untyped objects, no example values |
| Annotations | Destructive tools with no destructiveHint, reads with no readOnlyHint, writes with no idempotentHint |
| Budget | A single tool definition too large, a tool surface too big in aggregate, more tools than a model selects among reliably |
Options
mcp-toolgauge lint . -v                      # info findings, and every suggestion
mcp-toolgauge lint . --fail-on warning       # stricter gate
mcp-toolgauge lint . --fail-on off           # report without ever failing
mcp-toolgauge lint . --json                  # machine-readable, stable key order
mcp-toolgauge lint . --sarif > results.sarif # for GitHub code scanning
mcp-toolgauge lint . --no-config             # ignore any mcp-toolgauge.toml on disk
Exit codes: 0 clean, 1 a finding reached --fail-on (default error), 2 usage
error, 3 could not reach the server.
Configuration
Optional. Put an mcp-toolgauge.toml next to your server, or a [tool.mcp-toolgauge] section in
your pyproject.toml:
[lint]
fail_on = "error"

[lint.rules]
MCP025 = "off"      # we do not want example values in descriptions
MCP041 = "error"    # annotations are not optional on this server
A typo in a rule ID is a usage error rather than a silent no-op, because a rule you think you turned off is worse than one you never touched.
Eval
Lint tells you two descriptions are near-identical. Eval tells you what that costs.
mcp-toolgauge eval ./path/to/your/server --init   # draft cases, then edit and commit them
mcp-toolgauge eval ./path/to/your/server          # run them
It puts your real tool definitions in front of a real model at temperature 0 — your names, your descriptions, your schemas, unedited — and counts where the traffic goes.
acme-directory 0.4.2
python server.py
openrouter/nvidia/nemotron-3.5-lightning:free   59 cases   59 from cache   free

Selection accuracy     55%  31/56
  positives            60%  24/40
  siblings             44%   7/16
Abstention             33%    1/3
Argument validity      98%  50/51

tool                 hit       went instead to
doStuff               0%  0/4  (nothing) 100%
run                   0%  0/4  (nothing) 50%, search 50%
ticket2              12%  1/8  search_users 88%
delete_all_tickets   62%  5/8  search_orgs 38%
ticket               62%  5/8  (nothing) 12%, search_users 12%, ticket2 12%
search_orgs          67%  4/6  search 33%
search_users         67%  4/6  search 33%
get_data            100%  4/4
search              100%  4/4
update              100%  4/4

search_users captures 88% of the prompts meant for ticket2.
search captures 50% of the prompts meant for run.
search_orgs captures 38% of the prompts meant for delete_all_tickets.
Those last lines are the point. ticket2 is described as "Creates a ticket." — five words —
so almost every request meant for it is answered by the search tool instead. Nobody would
ever see that from the outside: the call succeeds, returns plausible data, and the ticket is
never filed.
run and doStuff score zero. One has no description, the other says
TODO: document this properly. An undocumented tool is not a tool with a poor hit rate —
it is a tool nothing calls at all.
The two fixture servers, measured
Same directory-and-ticketing API. One written carefully, one carelessly.
| goodserver | badserver | |
|---|---|---|
| Selection accuracy | 92% | 55% |
| positives | 91% | 60% |
| siblings — the confusable pairs | 100% | 44% |
| abstention | 33% | 33% |
| argument validity | 100% | 98% |
The sibling row is the one to read. Those are the tool pairs the linter flags as
confusable, and the difference between a description that says "use search_users instead
when…" and one that does not is the difference between 100% and a coin flip.
Reproduce both, offline and free, from the recorded runs in this repo:
uv run mcp-toolgauge eval tests/fixtures/goodserver --offline
uv run mcp-toolgauge eval tests/fixtures/badserver --offline
How it works
Three kinds of case, scored separately and never averaged together:
| Kind | Asks |
|---|---|
positive |
Can this tool be found at all? |
sibling |
Can it be told apart from the tool it looks like? |
abstain |
Does your server know when to stay out of the way? |
The sibling cases are aimed at the pairs MCP013 and MCP014 flag, using the same overlap
measure — so a lint warning and an eval failure are two levels of proof about one defect.
Cases are a committed artifact. --init drafts a suite once; you edit it; every run
afterwards reads it unchanged. It refuses to overwrite without --force, because a suite
that quietly regenerated itself would make two runs incomparable. Read the drafted abstain
cases first — they are the ones a generator most often gets wrong.
Every answer is cached, keyed by hash(model, prompt, tool digest). A second run over an
unchanged suite makes zero network calls and costs nothing. Commit the cache and CI replays
the whole thing offline, forever — which is exactly what this repo does.
The full methodology, including what the number does not tell you, is in docs/eval.md.
Options
mcp-toolgauge eval . --model openai/gpt-4.1-mini   # anything LiteLLM can reach
mcp-toolgauge eval . --offline                     # replay a recorded cache; no key needed
mcp-toolgauge eval . --min-accuracy 80             # exit 1 below this
mcp-toolgauge eval . --max-cost 0.50               # stop once it has cost this much
mcp-toolgauge eval . --pace 3                      # wait between calls on a rate-limited tier
mcp-toolgauge eval . -v                            # every failing case, with its prompt
mcp-toolgauge eval . --json                        # the full confusion matrix
Calling a model needs the eval extra; --offline does not.
uv pip install 'mcp-toolgauge[eval]'
The default model is a free one on OpenRouter, so a first run costs nothing beyond an
OPENROUTER_API_KEY. Free models are slow and heavily rate-limited — use --pace, or point
--model at something you pay for.
CI, health score, and badge
Lint says what is wrong; eval says what it costs. ci rolls both into one 0–100 number you
can gate a build on and put on a badge.
mcp-toolgauge ci ./path/to/your/server --min-score 80
acme-directory 1.0.0
python server.py

Health        96 / 100
  lint       100   0 errors, 0 warnings
  selection  92%   37 of 40 prompts
The number is lint_score and eval_score weighted equally, and it never appears without
both halves beside it:
lint_score  = clamp(100 − 10·errors − 3·warnings, 0, 100)   # info is advisory
eval_score  = round(selection_accuracy × 100)               # positives + siblings only
overall     = round(0.5·lint_score + 0.5·eval_score)
The eval half is selection accuracy alone — abstention and argument validity are reported but never folded in, so a server cannot raise its badge by editing its own test suite. A server with no eval suite is scored on lint alone, so the badge works on day one. The full reasoning, and what the number does not tell you, is in docs/ci.md.
The eval half is replayed from the committed cache, so ci calls no model — it is
reproducible and free. Exit codes: 0 at or above --min-score, 1 below it, 2 usage
error, 3 could not reach the server.
Badge
mcp-toolgauge ci . --badge badge.json
Writes a shields.io endpoint document. Publish it — a raw GitHub URL is enough — and point a badge at it:

GitHub Action
The composite Action scores your server, fails the build under a threshold, writes the badge, and posts a sticky pull-request comment showing the delta against your base branch.
- uses: actions/checkout@v4
# install your server's own dependencies here, so mcp-toolgauge can start it
- uses: arijitgupta42/mcp-toolgauge@v1
  with:
    target: .
    min-score: "80"
@v1 follows the latest v1.x release; pin an exact tag like @v0.1.0 to freeze it. See
docs/ci.md for the full input list.
Dashboard
Two of the tool's best outputs do not fit a terminal — the confusion matrix is a matrix, and a health score is only interesting as a trajectory. The dashboard is where those live: three views, findings, the confusion heatmap, and score history, over a static single-page app with no backend and nothing uploaded.
cd dashboard
npm install
npm run dev      # http://localhost:5173, opens on the two fixture servers
npm run build    # static files in dashboard/dist/, host anywhere
It reads a mcp-toolgauge ci --json report — the bundled demos, a ?report=<raw-url>, or a file
you drop on the page. Keep a history file across runs and the third view draws your score over
time:
mcp-toolgauge ci ./your/server --history history.json --json > report.json
The full tour, including how to publish your own, is in docs/dashboard.md.
A GitHub Pages workflow (.github/workflows/pages.yml) builds and publishes it on every push
to main.
Inspect
mcp-toolgauge inspect ./path/to/your/server
Point it at a directory and it finds your server the way your MCP client does — by reading
.mcp.json (or mcp.json, .vscode/mcp.json, claude_desktop_config.json). No manifest?
It falls back to a conventional entrypoint like server.py. Either way, no flags needed:
acme-directory 1.0.0  protocol 2026-07-28
python server.py

tool                   description                                    params  R D I
search_users           Find individual people in the staff direct...       3  R d I
search_organizations   Find organizations -- companies, teams, an...       3  R d I
get_user_profile       Retrieve the full profile for one known pe...       1  R d I
create_support_ticket  Open a new support ticket on behalf of a u...       4  r d i
update_ticket_status   Move an existing support ticket to a new s...       3  r d i
list_ticket_comments   Read the comment thread on one support tic...       2  R d I
archive_ticket         Permanently archive a support ticket, remo...       2  r D I
export_directory_csv   Export one organization's slice of the sta...       2  R d I

8 tools   -v for parameter detail
The R D I column is readOnlyHint, destructiveHint, idempotentHint. Uppercase means
the server declared it true, lowercase false, and - means it said nothing at all — which
is a different problem, and one lint has opinions about.
Other ways to point it at a server
Both commands take the same target flags:
mcp-toolgauge lint https://example.com/mcp             # a running server over HTTP
mcp-toolgauge lint ./server.py                         # a single script
mcp-toolgauge lint . --server backend                  # pick one from a multi-server manifest
mcp-toolgauge lint . --command "node dist/server.js"   # say it yourself
Both commands are read-only. They connect, list tools, and disconnect. Neither ever calls one of your tools.
Try it without a server of your own
The repo ships two fixture servers with the same API — one written well, one written carelessly:
uv run mcp-toolgauge lint tests/fixtures/goodserver
uv run mcp-toolgauge lint tests/fixtures/badserver

uv run mcp-toolgauge eval tests/fixtures/goodserver --offline
uv run mcp-toolgauge eval tests/fixtures/badserver --offline

uv run mcp-toolgauge ci tests/fixtures/goodserver
uv run mcp-toolgauge ci tests/fixtures/badserver
The first lints clean; the second produces 74 findings. The eval runs need no API key — they replay recorded answers — and score 92% against 55%. Rolled together, the two servers score 96 and 28 out of 100. The difference between those two servers is the entire point of this project.
Development
uv sync                  # base install; enough for everything except calling a model
uv sync --extra eval     # adds LiteLLM, for `eval` without --offline
uv run pytest
uv run ruff check .
uv run mypy mcp_toolgauge
Skip the tests that spawn real servers with uv run pytest -m "not integration". No test
calls a model: the eval suite stubs the backend or replays the recorded caches.
Roadmap
| Milestone | Status |
|---|---|
Connection and inspect |
done |
lint — static rules for names, descriptions, schemas, annotations |
done |
eval — tool-selection accuracy and a confusion matrix |
done |
ci — health score, threshold gate, badge, GitHub Action |
done |
| Dashboard — findings, confusion heatmap, score history | done |
Ship to PyPI so uvx mcp-toolgauge needs no install |
done |
| Self-hosted dashboard on a private network | next |
Ideas, rule proposals, and false-positive reports are all welcome — see
CONTRIBUTING.md, and the good first issue
label for a place to start.
Licence
MIT — see LICENSE.
1 maintainer

Metadata
1 maintainer
Release files for mcp-toolgauge 0.1.0
For a detailed explanation of source distributions (sdists) and built distributions (wheels), please see the package formats documentation.
Source distribution (sdist)
| File | Size | Uploaded | |
|---|---|---|---|
| mcp_toolgauge-0.1.0.tar.gz | 200.2 kB | Details |
Built distribution (wheel)
| File | Interpreter | ABI | Platform | Reset |
|---|---|---|---|---|
| mcp_toolgauge-0.1.0-py3-none-any.whl | Python 3 | none | any | Details |
Total release size: 313.8 kB
Release files / mcp_toolgauge-0.1.0.tar.gz
| Download URL | mcp_toolgauge-0.1.0.tar.gz |
|---|---|
| Size | 200.2 kB |
| Tags | Source |
|
SHA-256 checksum How to use checksums |
4e2c273de7c868f9f80c324e5a4923cf631fdccce584609bb5637366ac26f0be
|
|
BLAKE2b-256 checksum How to use checksums |
47cb7251a61c830bed5b50a8ecef261f5d248dddf2d71dd31ea0c3081965a728
|
| Upload date | |
|
Uploaded using Trusted Publishing? What is trusted publishing? |
Yes |
| Uploaded via |
twine/7.0.0 CPython/3.13.14
|
Provenance
Provenance describes where a file came from. On PyPI, provenance is shared via attestations, which provide a verifiable record of the build or publishing details. View details, limitations and caveats.


PyPI Publish Attestation
PyPI verified that this artifact, at this checksum, originated from the publisher listed below.
Signed by GitHub Actions, verified by PyPI on Aug 24, 2026.
Transparency logRelease files / mcp_toolgauge-0.1.0-py3-none-any.whl
| Download URL | mcp_toolgauge-0.1.0-py3-none-any.whl |
|---|---|
| Size | 113.6 kB |
| Tags | Python 3 |
|
SHA-256 checksum How to use checksums |
601e2a7b479fb8aed227cabcd9e1935c541cb7cfea746d9b46e4bfdec1a60d7a
|
|
BLAKE2b-256 checksum How to use checksums |
2827eecbb0ea51c86c8b85e4512d40a4ca7ea58ed0b961be3274d4f259dda14f
|
| Upload date | |
|
Uploaded using Trusted Publishing? What is trusted publishing? |
Yes |
| Uploaded via |
twine/7.0.0 CPython/3.13.14
|
Provenance
Provenance describes where a file came from. On PyPI, provenance is shared via attestations, which provide a verifiable record of the build or publishing details. View details, limitations and caveats.
PyPI Publish Attestation
PyPI verified that this artifact, at this checksum, originated from the publisher listed below.
Signed by GitHub Actions, verified by PyPI on Aug 24, 2026.
Transparency log












