Finds memory leaks in Python programs

Reason this release was yanked:
MCP server not working
Project description

Memalot finds memory leaks in Python programs. Memalot prints suspected leaks to the console by default, and also has a CLI and an MCP server for analyzing memory leaks.
For example, here is a Python program which creates a string object every half-second and stores these in a list:
from time import sleep
import memalot

memalot.start_leak_monitoring(max_object_lifetime=1.0)

def my_function():
    my_list = []
    for i in range(100000):
        my_list.append(f"Object {i}")
        sleep(0.5)

my_function()
In this example, the memalot.start_leak_monitoring(max_object_lifetime=1.0) line tells Memalot to find objects that have lived for longer than one second and identity them as potential leaks. After a short delay, Memalot will print a report like this to the console:
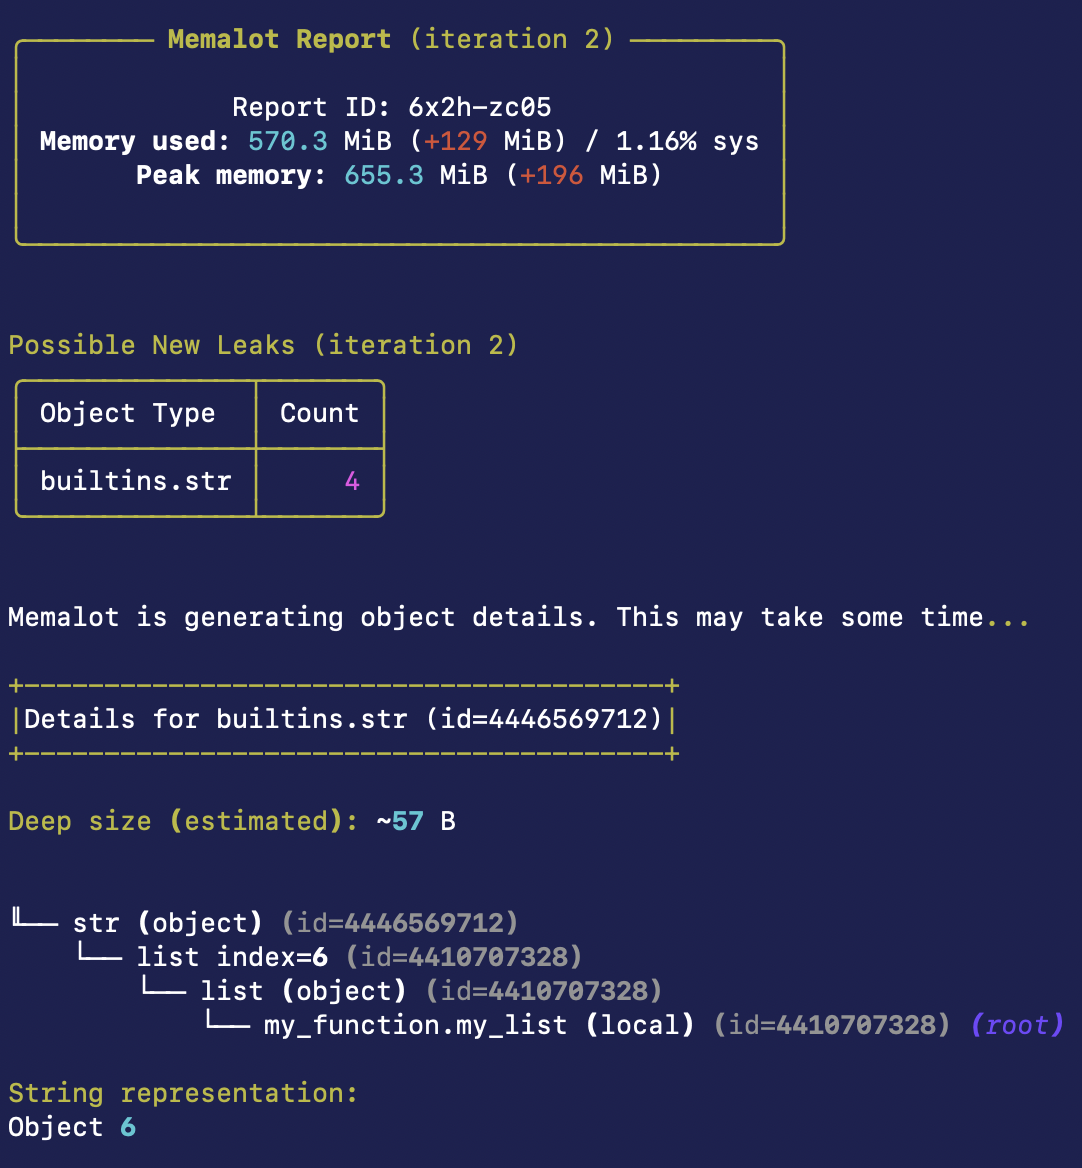
Memalot has identified that some string objects are leaking, and has printed details about the first object, including its referrers (the references to the object that are keeping it alive), its size and its string representation.
Note: Memalot may slow down your program, so be wary of using it in a production system.
Installation
Install using pip:
pip3 install memalot
Getting Started
Memalot can identify suspected memory leaks in one of these ways:
- Time-based Leak Discovery. Identifies objects that have lived for more than a certain amount of time without being garbage collected. This is most suitable for web servers and other programs that process short-lived requests, and multithreaded programs.
- Function-based Leak Discovery. Identifies objects that have been created while a specific function is being called, but have not yet been garbage collected. This is most suitable for single-threaded batch processing systems or other long-lived jobs.
Time-based Leak Discovery
To get started with time-based leak discovery, call this code after your Python program starts:
import memalot

memalot.start_leak_monitoring(max_object_lifetime=60.0)
This will periodically print out potential memory leaks to the console. An object is considered a potential leak if it lives for more than max_object_lifetime seconds (in this case, 60 seconds).
By default, Memalot has a warm-up period equal to max_object_lifetime seconds. Objects created during the warm-up period will not be identified as leaks. You can control the warm-up period using the warmup_period parameter.
Function-based Leak Discovery
To get started with function-based leak discovery, wrap your code in the @leak_monitor decorator:
from memalot import leak_monitor

@leak_monitor
def function_that_leaks_memory():
    # Code that leaks memory here
When the function exits, Memalot will print out potential memory leaks. That is, objects created while the function was being called, which cannot be garbage collected.
You can also ask Memalot to only consider objects that have lived for more than a certain number of calls to the function. For example:
from memalot import leak_monitor

@leak_monitor
def function_that_leaks_memory(max_object_age_calls=2):
    # Code that leaks memory here
In this case the max_object_age_calls=2 parameter asks Memalot to only consider objects that have been created while the function was being called, and have survived two calls to the function.
Function-based leak discovery may not be accurate if other threads are creating objects outside the function while it is being called. Memalot cannot detect objects that are created within a specific function, only while the function is being called. If this causes problems for you, use time-based Leak Discovery instead.
Note: you should not call memalot.start_leak_monitoring when using function-based leak discovery.
Filtering
Memalot can be used to filter the types of objects that are considered leaks. This can speed up leak discovery significantly if you know what types of objects are likely to be leaks.
To filter object types, pass the included_type_names parameter with the type names that you wish to include. For example:
memalot.start_leak_monitoring(max_object_lifetime=60.0, included_type_names={"mypackage.MyObject", "OtherObject"})
This will only include objects with mypackage.MyObject or OtherObject in their fully qualified type name. Matching is based on substrings, so mypackage.MyObject will match mypackage.MyObjectSubclass as well.
You can also exclude certain types of objects from being considered as leaks. Use the excluded_type_names option for this. For example:
memalot.start_leak_monitoring(max_object_lifetime=60.0, included_type_names={"builtins"}, excluded_type_names={"dict"})
This will include all built-in types except for dict.
One efficient way to use Memalot is to generate a report with check_referrers=False to see which types of objects might be leaking, and then generate further reports with check_referrers=True and included_type_names set to the types of objects that you think may be leaking. Since finding referrers is slow, this can speed up leak discovery.
Console Output
By default, Memalot prints out suspected leaks to the console. However, you can specify the output_func option to send the output to a different location. For example, to send the output to a Python logger:
LOG = logging.getLogger(__name__)
memalot.start_leak_monitoring(max_object_lifetime=60.0, output_func=LOG.info)
Saved Reports
Memalot saves leak reports to disk, which can be inspected later via the CLI or MCP server. By default reports are saved to the .memalot/reports directory in the user's home directory, but this can be changed by setting the report_directory option.
Reports can be copied between machines by copying the contents of the report_directory to the other machine (using, for example, scp or rsync). This is useful if, for example, you are running Memalot in your test environment but want to inspect reports on your local machine.
For example, to copy the report with ID rcf1-6kks from a remote machine to your local machine:
scp alice@remote_host:/home/alice/.memalot/reports/memalot_report_rcf1-6kks /home/alice/.memalot/reports/
Or to rsync all reports from a remote machine to your local machine:
rsync -avh --progress alice@remote_host:/home/alice/.memalot/reports/ /home/alice/.memalot/reports/
There is a small chance of report ID collisions if you copy reports between machines (although this is relatively unlikely, since report IDs are 8 alphanumeric characters). To avoid report collisions, use a different report_directory for each machine you copy reports from.
CLI
Memalot has a basic CLI that can be used to analyze memory leaks.
To list leaks, run:
memalot list
To print a report for a specific leak, run:
memalot print <report_id>
To get help, run a command with the --help flag. For example:
memalot print --help
MCP Server
TODO: Write this section.
Options
Memalot has a number of options that can be used to customize its behavior. Pass these options to start_leak_monitoring or @leak_monitor. For example:
memalot.start_leak_monitoring(max_object_lifetime=60.0, force_terminal=True, max_object_details=50)
Type Filtering
-
included_type_names(set of strings, default: empty set): The types of objects to include in the report. By default all types are checked, but this can be limited to a subset of types. Inclusion is based on substring matching of the fully-qualified type name (the name of the type and its module). For example, ifincluded_type_namesis set to{"numpy"}, all NumPy types will be included in the report. -
excluded_type_names(set of strings, default: empty set): The types of objects to exclude from the report. By default no types are excluded. Exclusion is based on substring matching of the fully-qualified type name (the name of the type and its module). For example, ifexcluded_type_namesis set to{"numpy"}, all NumPy types will be excluded from the report.
Leak Report Options
-
max_types_in_leak_summary(int, default: 500): The maximum number of types to include in the leak summary. -
compute_size_in_leak_summary(bool, default: False): Computes the (shallow) size of all objects in the leak summary. Note: the shallow size of an object may not be particularly meaningful, since most objects refer to other objects, and often don't contain much data themselves. -
max_object_details(int, default: 30): The maximum number of objects for which to print details. We try to check at least one object for each object type, within this limit. If the number of types exceeds this limit, then we check only the most common types. If the number of types is less than this limit, then we will check more objects for more common types.
Referrer Tracking Options
-
check_referrers(bool, default: True): Whether to check for referrers of leaked objects. This option may cause a significant slow-down (but provides useful information). Try setting this toFalseif Memalot is taking a long time to generate object details. Then, when you have an idea of what types of objects are leaking, you can generate reports withcheck_referrers=Trueandincluded_type_namesset to the types of objects that you think may be leaking. -
referrers_max_depth(int or None, default: 50): The maximum depth to search for referrers. SpecifyNoneto search to unlimited depth (but be careful with this: it may take a long time). -
referrers_search_timeout(float or None, default: 300.0): The maximum time in seconds to spend searching for referrers for an individual object. If this time is exceeded, a partial graph is displayed and the referrer graph will contain a node containing the text "Timeout of N seconds exceeded". Note that this timeout is approximate, and may not be effective if the search is blocked by a long-running operation. The default is 5 minutes (300 seconds). Setting this toNonewill disable the timeout. -
single_object_referrer_limit(int or None, default: 100): The maximum number of referrers to include in the graph for an individual object instance. If the limit is exceeded, the referrer graph will contain a node containing the text "Referrer limit of N exceeded". Note that this limit is approximate and does not apply to all referrer types. Specifically, it only applies to object references. Additionally, this limit does not apply to immortal objects. -
referrers_module_prefixes(set of strings or None, default: None): The prefixes of the modules to search for module-level variables when looking for referrers. If this is not specified, the top-level package of the calling code is used. -
referrers_max_untracked_search_depth(int, default: 30): The maximum depth to search for referrers of untracked objects. This is the depth that referents will be searched from the roots (locals and globals). If you are missing referrers of untracked objects, you can increase this value.
Report Storage Options
-
save_reports(bool, default: True): Whether to save reports to disk. This is useful for inspecting them later. Reports are written to thereport_directory, or the default directory if this is not specified. -
report_directory(Path or None, default: None): The directory to write the report data to. Individual report data is written to a subdirectory of this directory. If this isNone(the default), the default directory will be used. This is the.memalot/reportsdirectory in the user's home directory. To turn off saving of reports entirely, use thesave_reportsoption.
Output Options
-
str_func(callable or None, default: None): A function for outputting the string representation of an object. The first argument is the object and the second argument is the length to truncate the string to, as specified bystr_max_length. If this is not supplied the object's__str__is used. -
str_max_length(int, default: 100): The maximum length of object string representations, as passed tostr_func. -
force_terminal(bool or None, default: None): Forces the use of terminal control codes, which enable colors and other formatting. Defaults toFalse, as this is normally detected automatically. Set this toTrueif you are missing colors or other formatting in the output, as sometimes (like when running in an IDE) the terminal is not detected correctly. This must be set toFalseifoutput_funcis set andtee_consoleisFalse. -
output_func(callable or None, default: None): A function that writes reports. If this is not provided reports are printed to the console. This option can be used to, for example, write reports to a log file. If this option is specified then output is not written to the console, unlesstee_consoleis set toTrue. -
tee_console(bool, default: False): If this is set toTrue, output is written to the console as well as to the function specified byoutput_func. Ifoutput_funcis not specified (the default) then this option has no effect. -
color(bool, default: True): Specifies whether colors should be printed to the console. Note: in certain consoles (like when running in an IDE), colors are not printed by default. Try settingforce_terminaltoTrueif this happens.
Other Options
max_untracked_search_depth(int, default: 3): The maximum search depth when looking for leaked objects that are not tracked by the garbage collector. Untracked objects include, for example, mutable objects and collections containing only immutable objects in CPython. This defaults to 3, which is enough to find most untracked objects. However, this may not be sufficient to find some untracked objects, like nested tuples. Increase this if you have nested collections of immutable objects (like tuples). However, note that increasing this may impact speed.
Context Manager
Memalot can be used as a context manager. However, it is generally recommended to use the @leak_monitor decorator instead, unless this is not possible.
To use Memalot as a context manager, call create_leak_monitor once, and then use the returned object as a context manager each time you want to monitor memory leaks. For example:
monitor = create_leak_monitor()

with monitor:
    # Code that leaks memory here
Note: it is important to call create_leak_monitor only once and reuse the returned object each time you want to monitor memory leaks.
Definition of a Leak
Memalot defines a memory leak as an object that has lived for longer than is necessary.
However, note that Memalot cannot distinguish between objects that live for a long time when this is necessary (for example, you want to cache some objects for speed) and when this is unnecessary (for example, you forget to evict stale objects from your cache). It's up to you to make this distinction.
Known Limitations
- Memalot is slow. Be wary of using it in a production system.
- Memalot does not guarantee to find all leaking objects. If you have leaking objects that are
created very rarely, Memalot may not detect them. Specifically:
- Memalot does not find objects that are created while the leak report is being generated. This is mostly applicable to time-based leak discovery.
- If the
max_object_age_callsparameter is set to greater than 1 during function-based leak discovery, Memalot will not find objects that are created on some calls to the function.
Release history Release notifications | RSS feed


Download files
Download the file for your platform. If you're not sure which to choose, learn more about installing packages.
Source Distribution
Built Distribution
Filter files by name, interpreter, ABI, and platform.
If you're not sure about the file name format, learn more about wheel file names.
Copy a direct link to the current filters
File details
Details for the file memalot-0.7.2.tar.gz.
File metadata
- Download URL: memalot-0.7.2.tar.gz
- Upload date:
- Size: 97.6 kB
- Tags: Source
- Uploaded using Trusted Publishing? Yes
- Uploaded via: twine/6.1.0 CPython/3.13.7
File hashes
| Algorithm | Hash digest | |
|---|---|---|
| SHA256 |
a51b7dab80442718b5c442f6a3c55ddc97d2052ec0d9846e055fdd3bd815ac09
|
|
| MD5 |
946a417677c281217866b5c2a6fb1b0b
|
|
| BLAKE2b-256 |
f00acc0070679a13996352a4dd1b2b1ce216c8fa1ac04e43183191263bb35f03
|
Provenance
The following attestation bundles were made for memalot-0.7.2.tar.gz:
Publisher:
python-publish.yml on nfergu/memalot
-
Statement:
-
Statement type:
https://in-toto.io/Statement/v1 -
Predicate type:
https://docs.pypi.org/attestations/publish/v1 -
Subject name:
memalot-0.7.2.tar.gz -
Subject digest:
a51b7dab80442718b5c442f6a3c55ddc97d2052ec0d9846e055fdd3bd815ac09 - Sigstore transparency entry: 623759820
- Sigstore integration time:
-
Permalink:
nfergu/memalot@736290d958961f3f51a82b4c8e32c52dba65781d -
Branch / Tag:
refs/tags/v0.7.2 - Owner: https://github.com/nfergu
-
Access:
public
-
Token Issuer:
https://token.actions.githubusercontent.com -
Runner Environment:
github-hosted -
Publication workflow:
python-publish.yml@736290d958961f3f51a82b4c8e32c52dba65781d -
Trigger Event:
release
-
Statement type:
File details
Details for the file memalot-0.7.2-py3-none-any.whl.
File metadata
- Download URL: memalot-0.7.2-py3-none-any.whl
- Upload date:
- Size: 110.3 kB
- Tags: Python 3
- Uploaded using Trusted Publishing? Yes
- Uploaded via: twine/6.1.0 CPython/3.13.7
File hashes
| Algorithm | Hash digest | |
|---|---|---|
| SHA256 |
804dd1a6a2c29cd2242a660fdc465cd19396b2c18e5cffcdb9d90d4479b2a251
|
|
| MD5 |
e6d8a5fb16637e1e7d836442a03af68a
|
|
| BLAKE2b-256 |
38156e70c0d439b3e8e7222db22a513f24e3c95d583ccaad4cc3fd53fcc7cad6
|
Provenance
The following attestation bundles were made for memalot-0.7.2-py3-none-any.whl:
Publisher:
python-publish.yml on nfergu/memalot
-
Statement:
-
Statement type:
https://in-toto.io/Statement/v1 -
Predicate type:
https://docs.pypi.org/attestations/publish/v1 -
Subject name:
memalot-0.7.2-py3-none-any.whl -
Subject digest:
804dd1a6a2c29cd2242a660fdc465cd19396b2c18e5cffcdb9d90d4479b2a251 - Sigstore transparency entry: 623759854
- Sigstore integration time:
-
Permalink:
nfergu/memalot@736290d958961f3f51a82b4c8e32c52dba65781d -
Branch / Tag:
refs/tags/v0.7.2 - Owner: https://github.com/nfergu
-
Access:
public
-
Token Issuer:
https://token.actions.githubusercontent.com -
Runner Environment:
github-hosted -
Publication workflow:
python-publish.yml@736290d958961f3f51a82b4c8e32c52dba65781d -
Trigger Event:
release
-
Statement type:


