
memblame: git blame for memory




Find the commit and the function that made your Python code use more memory.
memblame runs your own workload (a pytest test, a script or a function) at several git
commits, measures memory with tracemalloc, and maps any growth to the function and the
diff hunk that caused it.
Quick start
pip install memblame              # or: pipx install memblame
cd your-project                   # any git repository with Python code
memblame range HEAD~20..HEAD -w "pytest:tests/test_something.py"
That runs the test at several of the last 20 commits and reports where memory changed, and
which function did it. memblame finds your project's virtualenv (.venv, or backend/.venv
next to the tests you name); if yours lives elsewhere, add --python path/to/python.
Want to see it work before pointing it at your own code? This builds a small repository with two memory regressions planted in its history and finds both:
git clone https://github.com/rmnvg/memblame && cd memblame
python tests/fixture_repo.py /tmp/demo-repo planted
cd /tmp/demo-repo
memblame range HEAD~9..HEAD -w call:shop.app:run
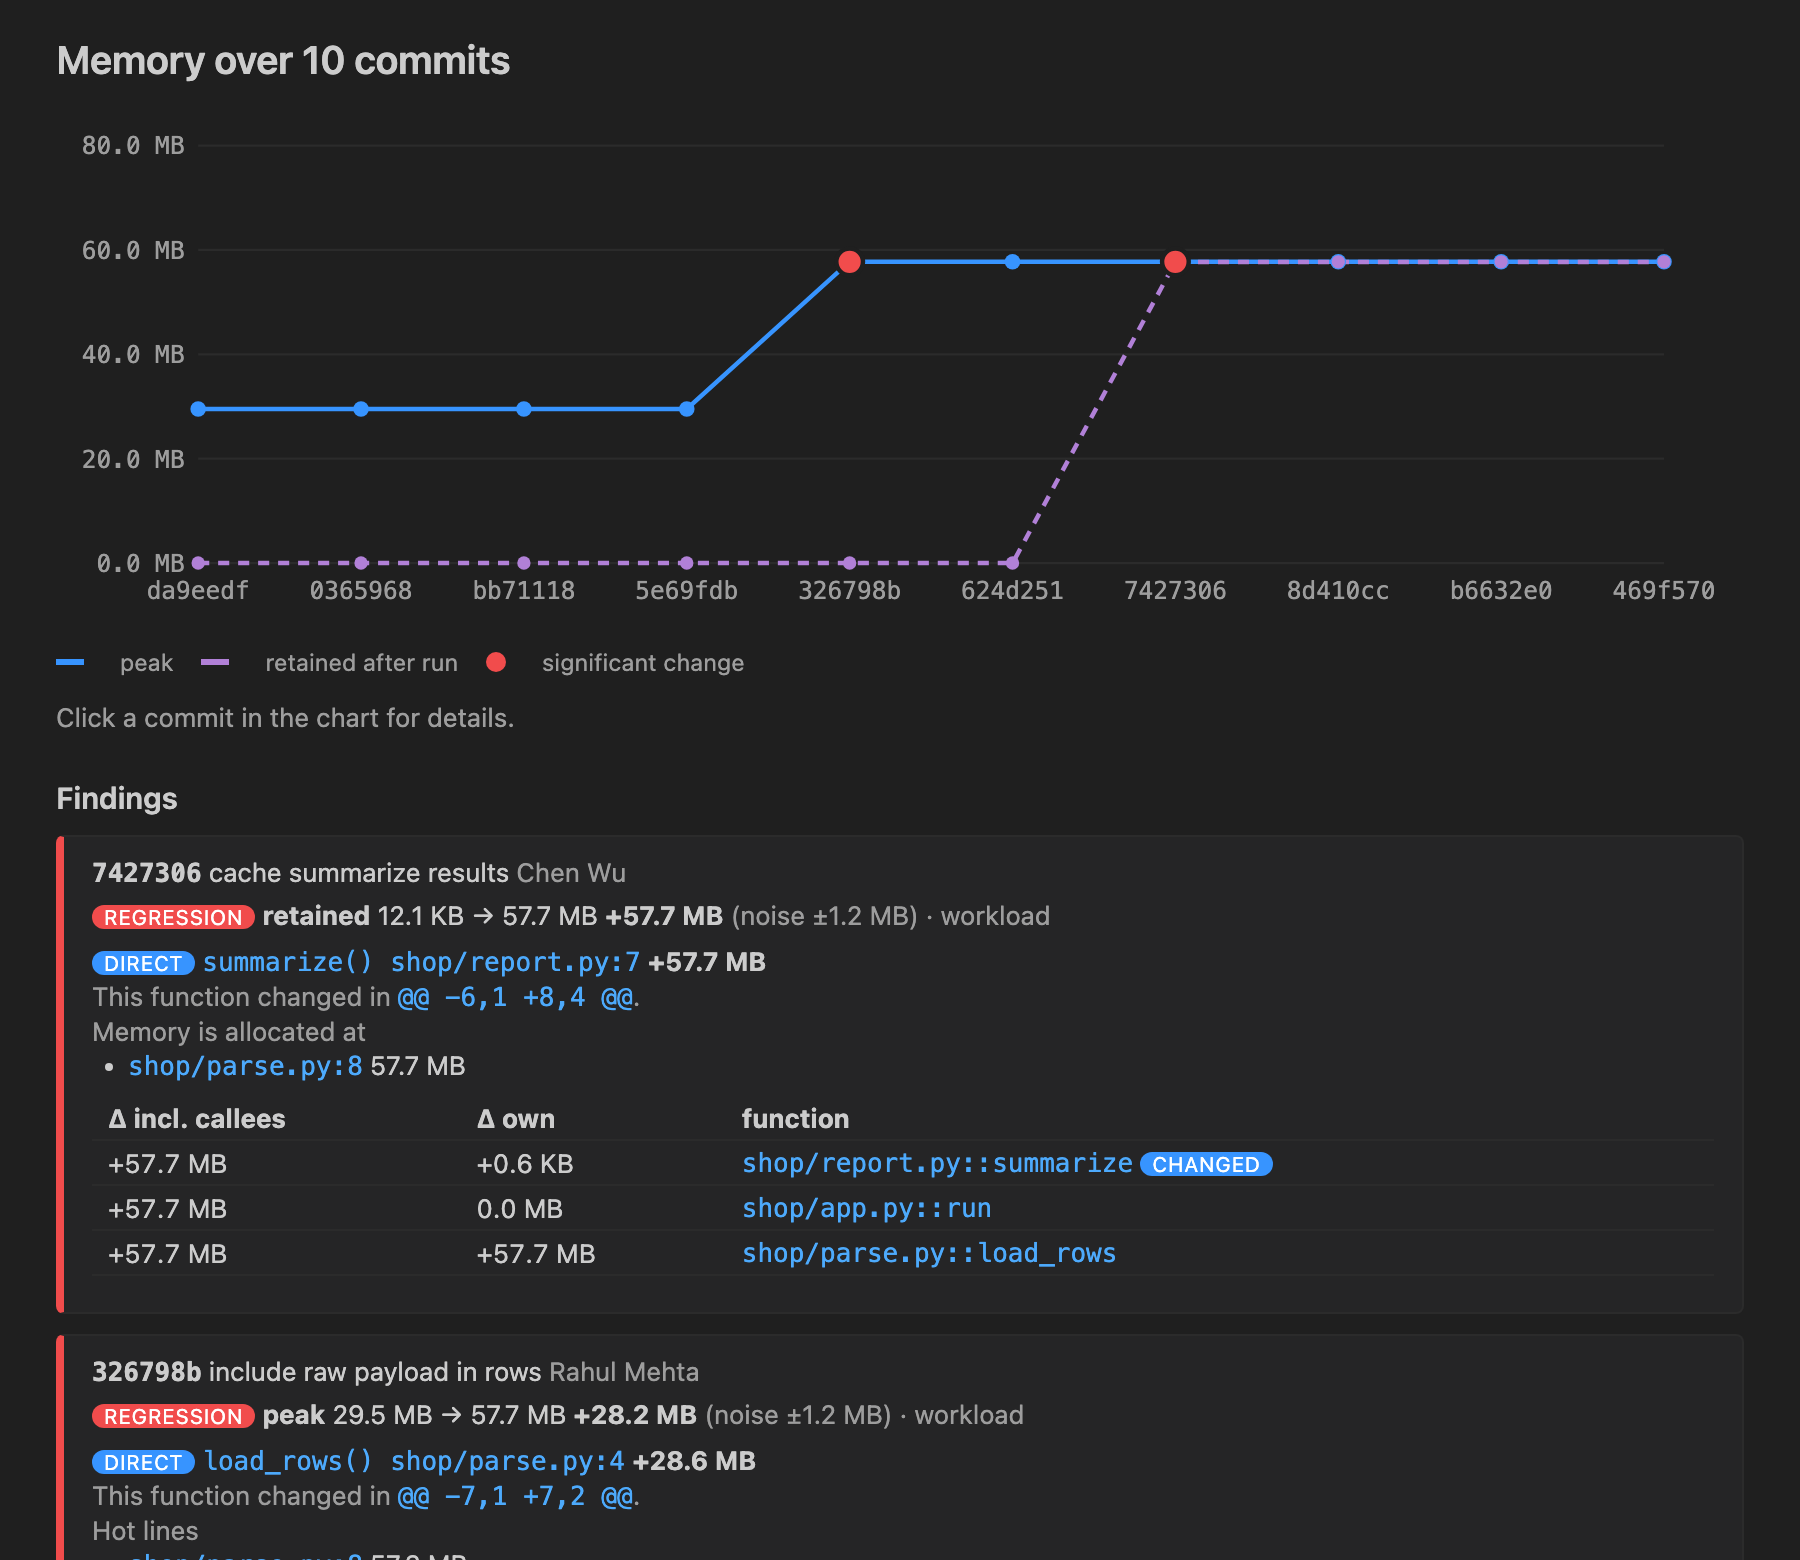
The numbers differ a little per machine; the report looks like this.
$ memblame range main~9..main -w call:shop.app:run
workload  (median of runs; ▲ = significant change; measured 7 of 10 commits)
  commit         peak      Δpeak    retained       Δret  author / subject
  da9eedf     29.5 MB                11.4 KB             Asha Rao       initial pipeline
  ...
  326798b     57.7 MB  +28.2 MB▲     12.3 KB   +0.1 KB   Rahul Mehta    include raw payload in rows
  7427306     57.7 MB   +0.4 KB      57.7 MB  +57.7 MB▲  Chen Wu        cache summarize results

Findings:
  7427306  retained +57.7 MB  "cache summarize results"
      direct: shop/report.py:7 summarize()  +57.7 MB
        changed in shop/report.py @@ -6,1 +8,4 @@
        memory allocated at shop/parse.py:8  57.7 MB
  326798b  peak +28.2 MB  "include raw payload in rows"
      direct: shop/parse.py:4 load_rows()  +28.6 MB
        changed in shop/parse.py @@ -7,1 +7,2 @@
        hot line shop/parse.py:8  57.3 MB
There is also an editor extension (source in vscode-ext/) that shows a timeline,
CodeLens above the blamed function, and a one-click "Memory vs HEAD" on every pytest test.
It is on Open VSX: search for
MemBlame in the Extensions view of Cursor, VSCodium or Windsurf. For VS Code, download
the .vsix from the latest release
and run code --install-extension memblame-*.vsix; it is not on the VS Code Marketplace
yet.
Install
pip install memblame # or: pipx install memblame
No dependencies: the core is standard-library only. Python 3.9+.
Usage
memblame diff                     # working tree (uncommitted changes) vs HEAD
memblame diff main feature        # two revisions
memblame range main~50..main      # timeline over a range (adaptive; --all for every commit)
memblame bisect --good v1.2 --bad HEAD --threshold +20MB
memblame run HEAD                 # one revision, with top allocating functions
memblame diff main HEAD --report md -o memblame.md
memblame range main~50..main --report html -o memblame.html
Pick what to run with -w (or workload in [tool.memblame] in pyproject.toml):
| workload | measures |
|---|---|
pytest:tests/test_big.py::test_load |
one test (only the test itself: setup, call, teardown) |
pytest:tests/test_big.py |
each test in the file, separately |
script:bench/run.py --n 10 |
a script; the path may be absolute (outside the repo), which keeps the workload identical at every commit |
call:mypkg.pipeline:main |
a function |
Absolute script paths inside the repo follow the selected revision, just like relative
paths. External scripts stay fixed. Quote paths or pytest node IDs containing spaces
inside the workload, e.g. -w "script:'bench scripts/run.py'".
Options
| option | default | meaning |
|---|---|---|
-w, --workload |
from config | what to run (table above) |
-C, --repo |
. |
repository to analyse |
--python |
active venv / conda env, else .venv/venv in the repo, else one next to the workload (backend/.venv for pytest:backend/tests/...), else the current Python |
interpreter with your project's dependencies (3.9+) |
--pythonpath DIR |
src + . if src/ exists, else . |
where to import your project from; repeatable |
--runs N |
3 |
maximum runs per commit (stops early once two runs agree) |
--nframe N |
16 |
traceback depth for attribution; raise it if a verdict notes truncated stacks |
--timeout S |
900 |
seconds per run; a commit that takes longer is skipped |
--no-cache |
ignore and don't write .memblame/cache/ |
|
--cache-env NAME |
invalidate cached measurements when this environment variable changes; repeatable | |
--cache-input PATH |
invalidate cached measurements when this file or directory changes; repeatable | |
--json |
machine-readable output ("schema": 1), used by the editor extension |
|
--report md|html |
portable Markdown or self-contained interactive HTML report | |
-o, --output PATH |
stdout | write terminal, JSON or report output to a file; parent directories are created |
range --all |
measure every commit instead of subdividing adaptively | |
bisect --good REV / --bad REV |
--bad HEAD |
the range to search |
bisect --threshold |
noise band | 200MB (absolute), +20MB or +10% (relative to good) |
bisect --unit NAME / --metric peak|retained |
the one that grew most | what to track, e.g. a pytest node id |
bisect --verify |
measure every candidate and return the earliest observed threshold crossing |
Exit codes: 0 a completed check with no significant increase, 3 a significant memory
increase was found (handy in CI), 1 error or incomplete measurement, 2 not a git repository.
Failed or skipped workloads, invalid environments, and inconsistent repeated runs return 1 for
run, diff, and range, even if a partial report has findings. Bisect can still return
3 after skipping broken intermediate commits; unmeasurable or non-passing endpoints return 1.
CI reports
Markdown is suitable for a CI job summary, while HTML contains the measurements, attribution, warnings, raw schema-1 result and an interactive range timeline in one dependency-free file:
- name: Check memory regression
  run: |
    memblame diff origin/main HEAD -w pytest:tests/test_pipeline.py \
      --report html --output memblame.html
- if: always()
  uses: actions/upload-artifact@v4
  with:
    name: memblame-report
    path: memblame.html
Exit code 3 still fails the analysis step after writing the report, so the artifact is
available for diagnosis without turning a regression green. For a GitHub job summary, write
the Markdown to stdout and append it, so an earlier step's summary survives (-o replaces
the file it writes to):
- run: memblame diff origin/main HEAD --report md >> "$GITHUB_STEP_SUMMARY"
Configuration
These keys can live in pyproject.toml (or in a memblame.toml at the repo root, which
wins). Command-line flags override them; a relative python path is relative to the repo root.
[tool.memblame]
workload = "pytest:tests/test_pipeline.py"
runs = 3
nframe = 16
pythonpath = ["src"]
python = ".venv/bin/python"
timeout = 600
threshold = "+10%"   # default for bisect
cache_env = ["DATASET_VERSION"]
cache_inputs = ["../bench-data/input.json"]
Committed files, the interpreter, installed packages and memblame's measurement engine are
included in cache keys automatically. If a workload depends on inherited environment variables
or files outside the selected commit, declare them with cache_env / cache_inputs (or the
matching command-line flags); undeclared external inputs cannot invalidate an existing cache.
Reading config needs Python 3.11+ (on 3.9/3.10 install memblame[toml]); otherwise memblame
says so and uses the command line only.
How it works
- Each committed revision is checked out into a temporary
git worktree, so your current checkout is never switched.WORKTREEworkloads run in the current checkout and can still create or modify files; memblame disables Python bytecode writes while running workloads. Every workload runs in a fresh subprocess of your project's interpreter. - Fast runs measure peak and retained (still allocated after the run) traced memory.
Returned values and script globals are released before retained memory is sampled, so the
metric represents caches, module state and other objects that outlive workload output.
They repeat until two runs agree, and the median is reported.
tracemalloccounts are nearly deterministic: on real projects run-to-run noise was a few KB. - A change counts only if it exceeds the noise band:
max(2 × spread, 2 % of peak, 64 KiB). - Only for commits around a significant change, an attribution run records tracebacks and snapshots memory as it approaches the known peak. It uses a cheap polling thread first, and an exact profile hook only if the peak was too short-lived to catch. Each allocation is credited to project functions: own bytes (allocated in the function) and incl. callees bytes.
- The function deltas are matched against
git diff -U0hunks, on the new side for growth and the old side for memory that went away.- direct: the function whose code changed accounts for the growth.
- indirect: memory grew in code that did not change (the cause is a caller, data or config); the changed functions are listed.
rangeis adaptive: it measures both ends and only subdivides segments whose ends differ, so the work is roughly log₂(N) per change. Results are cached per commit in.memblame/cache/, keyed by the commit plus the interpreter, installed packages, settings and memblame version.
Honest limits
tracemallocsees memory allocated through Python's allocators. numpy reports its buffers to tracemalloc, so arrays are counted. Native libraries that callmallocdirectly are not.- Tracing is slow: the fast runs are several times slower than normal, and the attribution run can be 10–40× slower on allocation-heavy or deeply recursive code. Use small, deterministic workloads.
- The environment is fixed: all commits run with the dependencies currently installed. If your dependencies changed across the range, results may not be comparable.
- If your project is installed so that imports resolve outside the checked-out commit
(for example
pip install -e .with asrc/layout and no--pythonpath), memblame detects it and reportsinvalid environmentinstead of wrong numbers. - pytest workloads always run in-process, in file order and without coverage: memblame
adds
-n 0(pytest-xdist),-p no:randomlyand--no-cov(pytest-cov) when those plugins are installed. - A commit where the workload fails, skips, or cannot be measured (crash, timeout) makes the
check incomplete (exit code 1), never a successful memory check. A
rangestill lists the findings between commits that were measured and passed, under an "incomplete" banner: more may hide in the gaps, so it is not an all-clear. Two failing runs are never compared.bisectcan skip broken intermediate commits the waygit bisect skipdoes, but its endpoints must pass. - Each run gets its own process group and a closed stdin. On a timeout, or when you cancel
from the editor or with Ctrl-C, the whole process tree the workload started is terminated,
and background processes a finished run left behind are removed (POSIX). A process that
deliberately detaches into a new session (
setsid) is not tracked, and Windows cannot identify the children of an already-finished process. - Fast
bisectassumes the metric crosses its threshold once; usebisect --verifywhen the earliest crossing must be established on a potentially nonmonotonic history. - Adaptive
rangecan miss a change that is exactly undone later within one unsplit segment. Use--allto measure every commit. - Attribution names where memory was allocated. For "kept alive too long" problems it still points at the changed function through the incl. callees numbers, and it shows where the memory was allocated.
Tested on real projects
Adaptive range runs with a fixed benchmark script, each finding checked against the diff:
| project, range | measured | finding | cause (verified in the diff) |
|---|---|---|---|
tomlkit 0.11.0..HEAD (233 commits) |
21 | 231370c peak −65 % (60.6 → 21.1 MB), direct in Source.__init__ |
source is indexed instead of materialized |
ae1b679 peak +3.9 %, direct in Container.__init__ |
a new dict and set on every Container |
||
a766d3a retained +1.0 MB at module level in items.py |
new import dataclasses (pulls in inspect) |
||
pyparsing 3.1.0..HEAD (510 commits) |
11 | cd081ef retained +1.56 MB (+22 %), hot line pyparsing/testing.py:6 |
import unittest added; since 3.3.0 every import pyparsing loads unittest |
markdown-it-py v2.0.0..HEAD (136 commits) |
19 | f52249e peak −15 %, direct in StateBase.src setter |
removed a per-character tuple(ord(c) ...) |
6649229, 145a484 peak −4 % / −3 % |
Token became a dataclass, then got __slots__ |
No chore, docs or CI commit was flagged. On the markdown-it-py range, commit-to-commit
noise was under 0.05 % of the peak. See PROJECT.md for the full log.
Development
uv venv && uv pip install -e . pytest ruff pytest-xdist pytest-cov pytest-randomly
pytest            # unit + end-to-end tests against generated git repos (~90 s)
ruff check src tests
python tests/fixture_repo.py /tmp/demo   # a repo with two planted regressions
License
MIT
1 maintainer

Release files for memblame 0.1.2
For a detailed explanation of source distributions (sdists) and built distributions (wheels), please see the package formats documentation.
Source distribution (sdist)
| File | Size | Uploaded | |
|---|---|---|---|
| memblame-0.1.2.tar.gz | 93.1 kB | Details |
Built distribution (wheel)
| File | Interpreter | ABI | Platform | Reset |
|---|---|---|---|---|
| memblame-0.1.2-py3-none-any.whl | Python 3 | none | any | Details |
Total release size: 155.9 kB
Release files / memblame-0.1.2.tar.gz
| Download URL | memblame-0.1.2.tar.gz |
|---|---|
| Size | 93.1 kB |
| Tags | Source |
|
SHA-256 checksum How to use checksums |
313e30665addcb643260fc7de57dcc6dae3e04bf0e094a5c27629121b0751669
|
|
BLAKE2b-256 checksum How to use checksums |
5135f2cce075830a7f645b380bf15934c91c227bb21c30ef8cea55f7c921983b
|
| Upload date | |
|
Uploaded using Trusted Publishing? What is trusted publishing? |
Yes |
| Uploaded via |
twine/7.0.0 CPython/3.13.14
|
Provenance
Provenance describes where a file came from. On PyPI, provenance is shared via attestations, which provide a verifiable record of the build or publishing details. View details, limitations and caveats.


PyPI Publish Attestation
PyPI verified that this artifact, at this checksum, originated from the publisher listed below.
Signed by GitHub Actions, verified by PyPI on Sep 22, 2026.
Transparency logRelease files / memblame-0.1.2-py3-none-any.whl
| Download URL | memblame-0.1.2-py3-none-any.whl |
|---|---|
| Size | 62.8 kB |
| Tags | Python 3 |
|
SHA-256 checksum How to use checksums |
df1c4db92584c6dc9eb901aba1f297f44e1b9964e503c12ab8cf0e2afe8b2a19
|
|
BLAKE2b-256 checksum How to use checksums |
3e76aa9589151d1e669ee8de8d6d14230cf6775b64b78b2b7587e2d3fb6ee7c4
|
| Upload date | |
|
Uploaded using Trusted Publishing? What is trusted publishing? |
Yes |
| Uploaded via |
twine/7.0.0 CPython/3.13.14
|
Provenance
Provenance describes where a file came from. On PyPI, provenance is shared via attestations, which provide a verifiable record of the build or publishing details. View details, limitations and caveats.
PyPI Publish Attestation
PyPI verified that this artifact, at this checksum, originated from the publisher listed below.
Signed by GitHub Actions, verified by PyPI on Sep 22, 2026.
Transparency log













