
Mermaid Magic
An IPython magic extension for rendering Mermaid diagrams in notebooks, including Databricks, Jupyter, VS Code and Cursor
Installation
pip install mermaid-magic
Usage
- Load the extension in your Jupyter notebook:
%load_ext mermaid_magic
- Use the
%%mermaidcell magic to create diagrams:
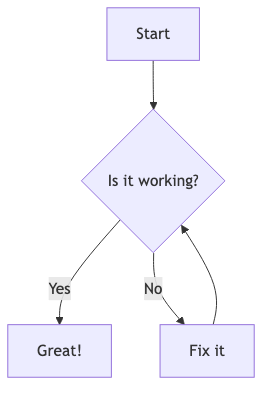
%%mermaid
graph TD;
    A[Start] --> B{Is it working?};
    B -- Yes --> C[Great!];
    B -- No --> D[Fix it];
    D --> B;
Features
- Renders Mermaid diagrams directly in Jupyter notebooks
- Automatically loads the Mermaid.js library when needed
- Supports all Mermaid diagram types (flowcharts, sequence diagrams, etc.)
Create mermaid diagrams in:
- Jupyter Lab and Jupyter notebooks (classic)
- Databricks Notebooks
- Notebooks (.ipynb) in VS Code
- Notebooks (.ipynb) in Cursor
Using Mermaid Diagrams in Databricks
This notebook demonstrates how to create Mermaid diagrams in Databricks notebooks. Also works in Jupyter, VS Code, Cursor and other notebook environments
%pip install -qqq mermaid-magic
Note: you may need to restart the kernel to use updated packages.
%load_ext mermaid_magic
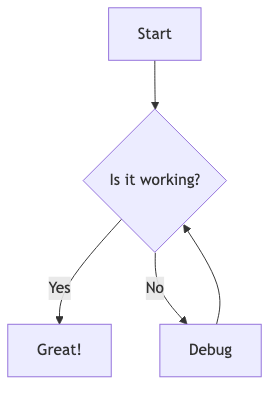
Basic Flowchart Example
%%mermaid
graph TD
    A[Start] --> B{Is it working?}
    B -->|Yes| C[Great!]
    B -->|No| D[Debug]
    D --> B
Data Pipeline Example
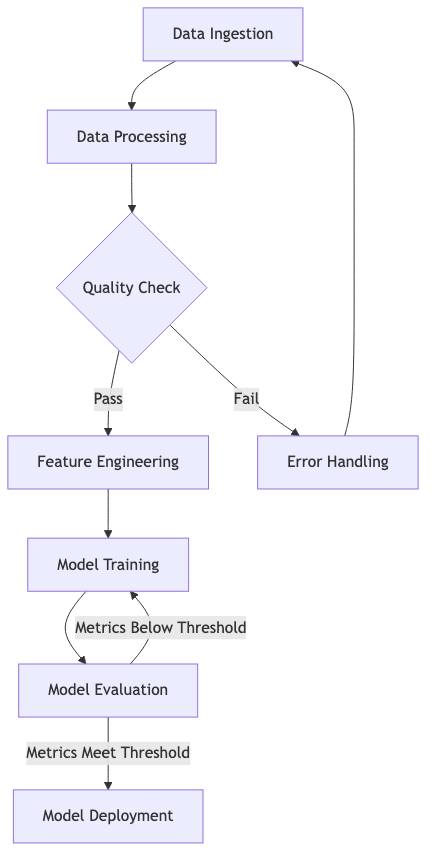
Let's create a more complex diagram showing a typical data pipeline in Databricks
%%mermaid
graph TD
    A[Data Ingestion] --> B[Data Processing]
    B --> C{Quality Check}
    C -->|Pass| D[Feature Engineering]
    C -->|Fail| E[Error Handling]
    D --> F[Model Training]
    F --> G[Model Evaluation]
    G -->|Metrics Meet Threshold| H[Model Deployment]
    G -->|Metrics Below Threshold| F
    E --> A
Sequence Diagram Example
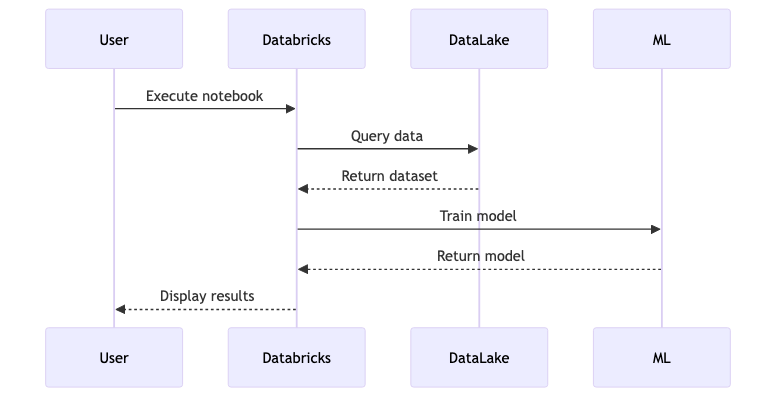
Sequence diagrams are useful for showing the interaction between different components
%%mermaid
sequenceDiagram
    participant User
    participant Databricks
    participant DataLake
    participant ML

    User->>Databricks: Execute notebook
    Databricks->>DataLake: Query data
    DataLake-->>Databricks: Return dataset
    Databricks->>ML: Train model
    ML-->>Databricks: Return model
    Databricks-->>User: Display results
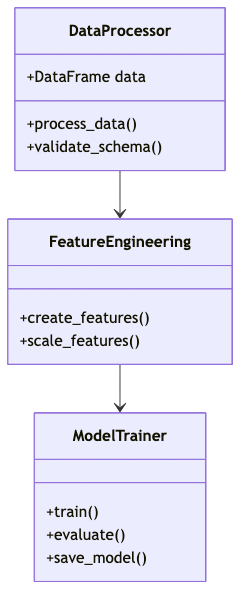
Class Diagram
Class diagrams can be useful for showing the structure of your code
%%mermaid
classDiagram
    class DataProcessor {
        +DataFrame data
        +process_data()
        +validate_schema()
    }

    class FeatureEngineering {
        +create_features()
        +scale_features()
    }

    class ModelTrainer {
        +train()
        +evaluate()
        +save_model()
    }

    DataProcessor --> FeatureEngineering
    FeatureEngineering --> ModelTrainer
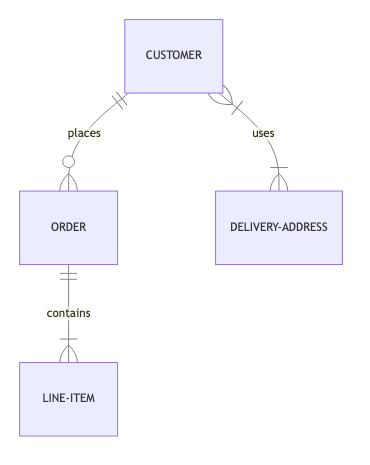
Entity Relationship Diagram
ER diagrams are useful for database schema visualization
%%mermaid
erDiagram
    CUSTOMER ||--o{ ORDER : places
    ORDER ||--|{ LINE-ITEM : contains
    CUSTOMER }|--|{ DELIVERY-ADDRESS : uses
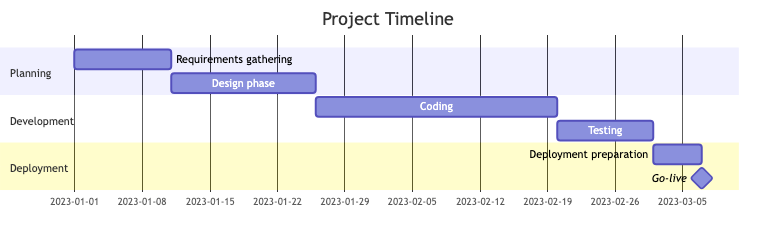
Gantt Chart
Gantt charts are useful for project planning and scheduling
%%mermaid
gantt
    title Project Timeline
    dateFormat  YYYY-MM-DD
    section Planning
    Requirements gathering :a1, 2023-01-01, 10d
    Design phase           :a2, after a1, 15d
    section Development
    Coding                 :a3, after a2, 25d
    Testing                :a4, after a3, 10d
    section Deployment
    Deployment preparation :a5, after a4, 5d
    Go-live                :milestone, after a5, 0d
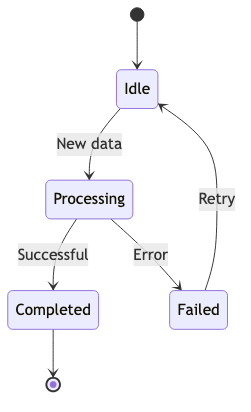
State Diagram
State diagrams are useful for showing the different states of a process or system
%%mermaid
stateDiagram-v2
    [*] --> Idle
    Idle --> Processing: New data
    Processing --> Completed: Successful
    Processing --> Failed: Error
    Completed --> [*]
    Failed --> Idle: Retry
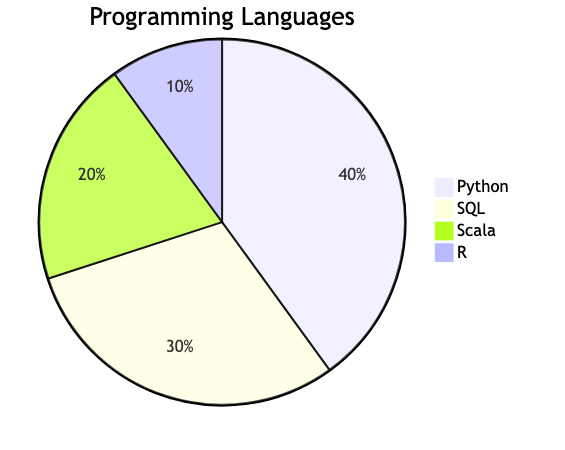
Pie Chart
%%mermaid
pie title Programming Languages
    "Python" : 40
    "SQL" : 30
    "Scala" : 20
    "R" : 10
Conclusion
These examples show various ways to create Mermaid diagrams in Databricks. You can use these techniques to:
- Visualize data processes
- Document workflows
- Create architecture diagrams
- Plan project timelines
For more information on Mermaid syntax, visit the Mermaid documentation.
1 maintainer

Metadata
1 maintainer
Release files for mermaid-magic 0.1.4
For a detailed explanation of source distributions (sdists) and built distributions (wheels), please see the package formats documentation.
Source distribution (sdist)
| File | Size | Uploaded | |
|---|---|---|---|
| mermaid_magic-0.1.4.tar.gz | 3.8 kB | Details |
Built distribution (wheel)
| File | Interpreter | ABI | Platform | Reset |
|---|---|---|---|---|
| mermaid_magic-0.1.4-py3-none-any.whl | Python 3 | none | any | Details |
Total release size: 7.7 kB
Release files / mermaid_magic-0.1.4.tar.gz
| Download URL | mermaid_magic-0.1.4.tar.gz |
|---|---|
| Size | 3.8 kB |
| Tags | Source |
|
SHA-256 checksum How to use checksums |
f65b3095312fb42aa6d064be3e6f642df62da0cd1fd7024de57389627b308513
|
|
BLAKE2b-256 checksum How to use checksums |
64cf01ef44a12e769c58405e0f56c2b74498a05024655bb5a33e77960f00433e
|
| Upload date | |
|
Uploaded using Trusted Publishing? What is trusted publishing? |
No |
| Uploaded via |
twine/6.1.0 CPython/3.12.8
|
Release files / mermaid_magic-0.1.4-py3-none-any.whl
| Download URL | mermaid_magic-0.1.4-py3-none-any.whl |
|---|---|
| Size | 3.9 kB |
| Tags | Python 3 |
|
SHA-256 checksum How to use checksums |
43ad15cdf7241ddb19d6349953fabe067e0458866a972d9b0605bd78437a2b25
|
|
BLAKE2b-256 checksum How to use checksums |
1cd8006d4980a8d4e8b6dcae13aae932e351d7e4c39f3eba2f4f8943981de179
|
| Upload date | |
|
Uploaded using Trusted Publishing? What is trusted publishing? |
No |
| Uploaded via |
twine/6.1.0 CPython/3.12.8
|














