
metal-gpu-trace

English · Español
In plain words
metal-gpu-trace measures how hard a program works the graphics chip (the GPU) of a Mac with Apple silicon, and whether its pictures come out evenly. It is for people who port or test games and apps on a Mac, Windows games run through Wine included, and for the AI coding agents that help them. You ask your agent to record the program for 30 seconds. The tool starts Instruments (Apple's profiler, installed with Xcode) and hands back a short summary: how long the GPU needs for each picture (a frame), how many frames per second (FPS), how often the picture stutters and how much memory is used. Run it again after a change and it says, with numbers, whether the program got faster, slower or stayed the same. It does not fix the program, and it needs Xcode installed to record.
How it works
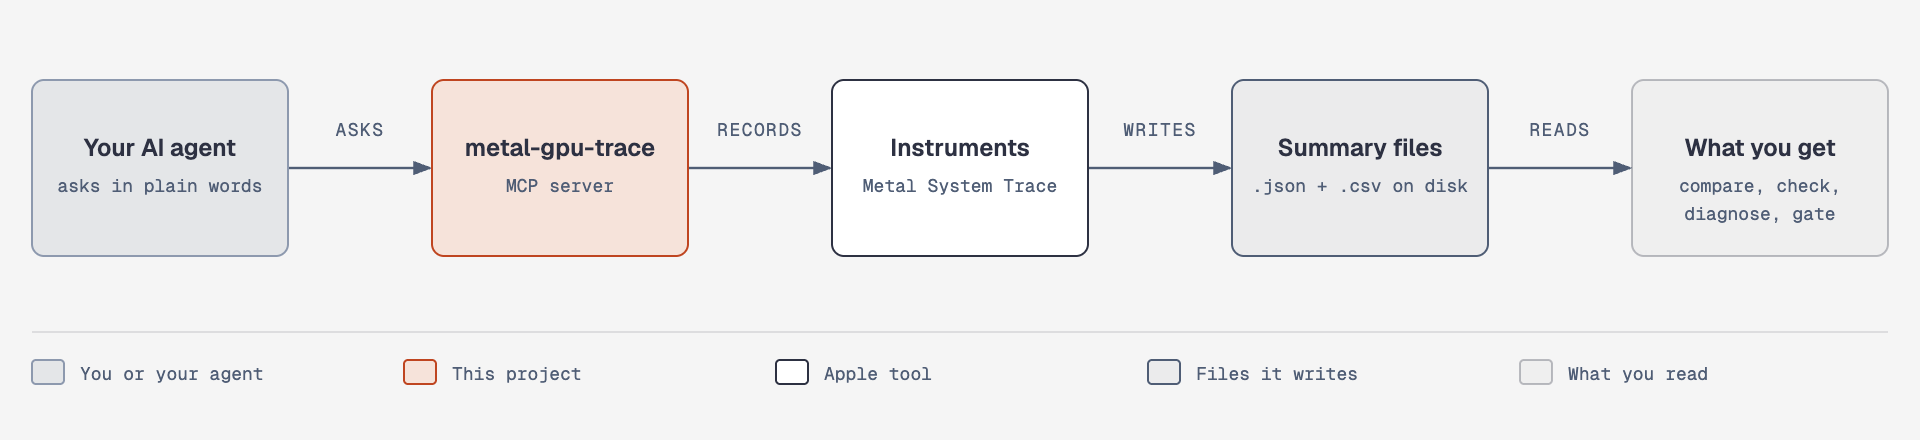
Start in 4 steps
- Install Xcode from the App Store. Open the Terminal app and type
xcrun xctrace version: it should print a version. - Install uv, a tool that downloads and runs the server for you. In the Terminal:
brew install uv(needs Homebrew, see brew.sh). - Connect the server to your agent. An MCP server is a small helper program that gives your AI agent new tools. For Claude Code, paste this in the Terminal (
METAL_TRACE_OUTis the folder where recordings are saved):claude mcp add --scope user metal-trace -e METAL_TRACE_OUT=$HOME/perf-runs -- uvx metal-gpu-trace. For other AI apps see MCP server. - Ask: "Record my app for 30 seconds, then tell me its FPS and how long the GPU takes per frame." For a Windows program under Wine (software that runs Windows programs on a Mac), also add
-e METAL_TRACE_WINE=/path/to/wineto the command of step 3 (see Install).
Words used here
- frame: one picture the program draws. A game at 60 FPS draws 60 of them each second.
- FPS: frames per second. Higher is smoother, until the screen's refresh rate caps it (vsync).
- GPU ms per frame: the milliseconds the graphics chip works on one frame. Lower is better, and unlike FPS the screen does not cap it.
- 1 % low: the FPS of the slowest 1 % of frames. It shows the stutter an average hides, and needs at least 100 frames.
- hitch: a frame that takes far longer than its neighbours; you see it as a stutter.
- frame pacing: how evenly frames arrive. Even gaps look smooth, uneven gaps look like stutter.
- encoder: a block of GPU commands the program sends. Too many tiny ones waste GPU time.
- command buffer: the package of work a program hands the GPU; it holds one or more encoders.
- translation layer: software that lets a program written for another graphics API (Direct3D, Vulkan) run on Metal, such as DXMT, Mullion or MoltenVK.
- Wine: software that runs Windows programs on a Mac.
- Metal System Trace: the Instruments recording template that logs what the GPU does; this tool records with it.
- .trace: the file Instruments writes. It is large (tens to hundreds of MB), so it is deleted after the summary unless you set
KEEP_TRACE=1. - .gputrace: a Metal capture of the draw commands of a few frames; this tool reads it without Xcode.
- baseline: a saved reference made of several equal recordings. It shows how much a number moves by itself, so a later run can be judged against it.
- regression: a change that makes the program worse than its baseline, for example FPS falling under the baseline's range by more than the margin.
A first result
A trimmed summary of a real 20-second recording of the drawstress test program in native Metal (the file holds many more fields):
{
  "process": {"name": "drawstress", "arguments": "--mtl"},
  "duration_s": 20.78,
  "gpu": {
    "frames": 2034,
    "fps_estimate": 104.5,
    "frame_gpu_ms": {"mean": 5.564, "p95": 6.16},
    "frame_interval_ms": {"p95": 10.017, "max": 22.189}
  },
  "encoders": {"per_frame": {"p50": 2}},
  "gpu_idle": {"idle_share": 0.422}
}
Read it like this: 2 034 frames in 20.8 s. fps_estimate is 104.5: it comes from the median gap between frames, so it can differ from frames divided by seconds (about 98). The GPU needed 5.6 ms per frame on average, and under 6.2 ms
for 95 % of them (p95). The longest wait between two frames was 22.2 ms. The program sent 2 encoders per frame (the
median, p50), and the GPU sat idle 42 % of the time. One recording says little by itself: compare two, and repeat a
run before calling a difference real.
What's new
Version 0.26.0. Each item links to the command that was run and its real output. 🧪 means experimental: it works on what was tried, but one part was not checked end to end, and the proof says which.
- 🔍 Time windows in
trace_query. Addwindow_msand a long table (tens of thousands of rows) comes back as one line per time window, with a count and the summed duration, instead of rows cut off in the middle. In a real run, 19 710 rows became 31 windows of 1 s. Proof - ✨ Where a run came from. Each new summary now says which commit of your code it measured, whether that code had
uncommitted changes, and which Instruments version recorded it.
perf_comparesays whether two runs share it. No branch name, path or machine name. Proof - 🧪
diagnose-stutterprompt. A ready-made request for your agent: record a program twice, tell stutter that only happens the first time (shaders compiling) from stutter that keeps happening, and quote only numbers the tools return. Proof - 🧪
bisect-regressionprompt. A ready-made request for your agent: find the commit that made a program slower withgit bisect, recording and checking against a baseline at each step. The server runs no command; your agent does, with its own permissions. Proof - 🧪
capture_diff. Compares two.gputracecaptures and says which Metal calls a change added or removed, in total and per debug group, without Xcode. Proven on synthetic captures only. Proof
Incompatible change: the profile key of metal-gpu-trace.json is gone (it did nothing since the panel was removed in
0.25.0), so a file that still has it is refused and the error names the key. Delete the line. Details in the
changelog.
For developers
Measure how a Wine or macOS program uses the GPU on an Apple silicon Mac, from the command line or through an AI
coding agent: GPU time per frame, frame pacing, FPS and memory, recorded with Instruments' Metal System Trace; whether
a translation layer (DXMT, Mullion, MoltenVK) splits the work into too many short encoders; Metal
.gputrace captures read without Xcode; and Apple's published facts on each GPU family to read the numbers against.
Python 3.9+ standard library, zsh, and Xcode (for xctrace). MIT license. Español.
Architecture, decisions and guides: docs/README.md. Sending a change: CONTRIBUTING.md.
| File | What it does |
|---|---|
src/metal_gpu_trace/perf_record.sh |
Records a program for N seconds with Metal System Trace and writes <label>_<date>.json (GPU ms per frame, frame intervals, FPS, Metal and resident memory) plus per-frame and memory CSVs. Deletes the .trace afterwards unless KEEP_TRACE=1. |
src/metal_gpu_trace/perf_report.py |
Summarizes an existing .trace the same way. |
src/metal_gpu_trace/gputrace_read.py |
Reads a Metal .gputrace capture without Xcode: command buffers, encoders, draws, debug groups. Call names marked probable are not confirmed. |
src/metal_gpu_trace/data/apple-gpu-families.json |
Apple7 to Apple10: chips, what each family adds, limits that differ, with Apple's sources. |
src/metal_gpu_trace/metal_trace_mcp.py |
An MCP server over all of the above. |
tests/ |
Self-check without Instruments: python3 -I tests/run.py prints ok; pytest tests runs the same tests. |
Recording
PERF_OUT=~/perf-runs zsh src/metal_gpu_trace/perf_record.sh game-d3d12 30 /path/to/wine ~/.wine /path/to/game game.exe
PERF_OUT=~/perf-runs zsh src/metal_gpu_trace/perf_record.sh app-metal 30 native - /path/to/app ./app
Arguments: label, seconds, a Wine directory holding bin/wine (or native), the Wine prefix, the working directory,
the program and its arguments. Without PERF_OUT, runs go to ./perf-runs. Reading the trace afterwards takes about
a minute on an M1 Pro (87 s for a 10 s recording); through the MCP server the whole call times out after 10 s per
recorded second plus 120 s, and an overrun recording leaves no files behind. One recording runs at a time; keep other GPU work off the Mac while it records.
Under Wine, give it 30 s: Wine's start-up takes part of the recording. A recording with under 100 frames is too short to compare.
Disk use
Each recording keeps a JSON summary and three CSVs, about 2 MB for 10 s (most of it the Metal memory samples). The
.trace (tens to hundreds of MB) is deleted unless KEEP_TRACE=1. KEEP_RUNS=N keeps only the newest N recordings. PERF_MEMORY=0 skips the Metal memory table, the slowest to read:
the summary then has no metal_memory_mib and there is no memory CSV (41 % faster to summarize a 626 MB trace).
The MCP tools perf_record and perf_baseline_record offer the same as memory=false.
MCP server
Install
The server runs with uvx from PyPI, with nothing to clone
(brew install uv installs it). Recording also needs Xcode installed (xcrun xctrace version prints a version).
uvx metal-gpu-trace
This is the command each client below runs. Desktop apps do not see Homebrew's PATH: give them the full path that
which uvx prints (/opt/homebrew/bin/uvx on Apple silicon). uvx keeps the version it first downloaded; run
the command once with --refresh after uvx to get the latest. uvx metal-gpu-trace@0.4.0 pins a version.
The server reads these environment variables:
| Variable | What it sets |
|---|---|
METAL_TRACE_OUT |
Where recordings go. Give an absolute path: the default, ./perf-runs, depends on the client's working directory. A project file (below) takes precedence. |
METAL_TRACE_PROJECT |
The project file to use (or the folder holding it), instead of looking for one from the working directory. |
METAL_TRACE_WINE |
The Wine directory (holding bin/wine) that perf_record uses when the call names none. |
WINEPREFIX |
The Wine prefix used when the call names none; ~/.wine otherwise. |
METAL_TRACE_READ |
More directories the tools may read, separated by :. |
METAL_TRACE_LOG |
off silences the one-line stderr log per call. |
KEEP_TRACE |
1 keeps each recording's .trace, for trace_tables, trace_query or Instruments. |
KEEP_RUNS |
Keeps only the newest N recordings; baselines.json is never removed (nor is the panel.json that 0.24.0 and older left). |
METAL_TRACE_LOCK |
The lock that keeps recordings one at a time, whatever folder each goes to (default ~/Library/Caches/metal-gpu-trace/recording.lock). perf_record.sh run by hand takes the same one, or the one PERF_LOCK names. |
PERF_ENV |
NAME=VALUE pairs, separated by spaces, set for the recorded program. |
PERF_INSTRUMENTS |
Instruments added to the Metal System Trace template, separated by ; (xcrun xctrace list instruments names them); their tables need the .trace, so pair it with KEEP_TRACE=1. |
Projects
A repository can hold a metal-gpu-trace.json that names its project and the folder of its recordings:
{"name": "my-game", "runs": "perf-runs", "baseline": "main-ref"}
The server looks for it in its working directory and the folders above it, stopping below the home folder, so one
file at a repository's root serves every folder inside it. When it finds one, recordings go to and are read from
runs instead of METAL_TRACE_OUT (METAL_TRACE_READ still adds folders to read), and baselines.json lives there too: projects no longer mix their recordings, and KEEP_RUNS prunes
each project's folder on its own. runs is relative to the file, starts with ~/, or is absolute.
| Key | Meaning |
|---|---|
name |
The project's name (letters, digits, ., _, -). Required. |
runs |
The recordings folder. Required. It must be new, empty or already marked by the server (a plain .metal-gpu-trace-runs file, not a folder or a link): KEEP_RUNS removes old .json files there, so a folder holding other files is refused. The mark the server leaves holds the project's name, and another project's file that names a folder marked with a different name is refused; an empty mark, written by hand, takes the name of the first project that uses the folder. To hand a folder to another project, edit or remove its mark. |
baseline |
The name of the project's reference (perf_baseline). project_info reports it; perf_check still takes the reference it is given. |
format |
metal-gpu-trace, the only one for now. |
Any other key, or a wrong value, is an error that every tool reports, naming the field, until the file is fixed.
project_info says which project is active and where its folder comes from. Without a project file nothing changes:
METAL_TRACE_OUT, or ./perf-runs, is used as before.
Claude Code
claude mcp add --scope user metal-trace -e METAL_TRACE_OUT=$HOME/perf-runs -e METAL_TRACE_WINE=/path/to/wine \
  -- uvx metal-gpu-trace
claude mcp list
claude mcp list shows metal-trace as connected. --scope user makes it available in every project; leave it out
to add it to the current project only.
Windows
On Windows the server records native programs (src/metal_gpu_trace/perf_record_windows.py); no Wine and no Metal. METAL_TRACE_WINE is not needed: perf_record and perf_attach use native. METAL_TRACE_READ is separated by ;.
Frames come from Intel's PresentMon console application (MIT): one row per Present() of the process, with MsBetweenPresents and the GPU time MsGPUTime. Download PresentMon-<version>-x64.exe from its releases, check its SHA-256 against the one GitHub shows, and call the presentmon_install tool, or put it in %LOCALAPPDATA%\metal-gpu-trace or on PATH, or point PRESENTMON_EXE at it. The user must be an administrator or in the "Performance Log Users" group. Without PresentMon the summary falls back to DWM composition intervals (gpu.source is dwm-composition): they cover the whole desktop, miss games in exclusive full screen, and carry no GPU time. With neither a frame log, PresentMon nor DWM samples, a recording fails; it never invents frames.
What cannot be measured is null, not zero: the 1% low needs 100 frames and the 0.1% low 1000; stutter rate and jitter need two frames; thermal_throttling_detected needs GPU times; a drawstress log holds one mean per line, so its summary (gpu.frame_times) has no frame-level percentiles, stutter or jitter. DWM keeps only intervals between consecutive composed frames and drops a jump of several frames. perf_diagnose calls a large working set with uneven frame times MEMORY_PRESSURE_SUSPECTED: a suspicion, since memory bandwidth is not measured.
winget install --id=astral-sh.uv -e
claude mcp add --scope user metal-trace -e METAL_TRACE_OUT=%USERPROFILE%\perf-runs -- uvx metal-gpu-trace
claude mcp list
To run from a clone instead of PyPI (needs Python 3.9 or newer):
claude mcp add --scope user metal-trace -e METAL_TRACE_OUT=%USERPROFILE%\perf-runs -- python C:\path\to\metal-gpu-trace\src\metal_gpu_trace\metal_trace_mcp.py
In JSON clients use "command": "uvx" (or the full path where uvx prints) and Windows paths with doubled backslashes. Claude Desktop reads %APPDATA%\Claude\claude_desktop_config.json. Run the Windows tests with python -m pytest tests/test_perf_record_windows.py.
Claude Desktop, Cursor and other JSON clients
These apps do not expand ~ or $HOME: write absolute paths.
{
  "mcpServers": {
    "metal-trace": {
      "command": "/opt/homebrew/bin/uvx",
      "args": ["metal-gpu-trace"],
      "env": {
        "METAL_TRACE_OUT": "/absolute/path/to/perf-runs",
        "METAL_TRACE_WINE": "/absolute/path/to/wine"
      }
    }
  }
}
| Client | File |
|---|---|
| Claude Desktop | ~/Library/Application Support/Claude/claude_desktop_config.json (Settings, Developer, Edit Config); restart the app |
| Cursor | ~/.cursor/mcp.json |
| VS Code | .vscode/mcp.json in the project; the top key is servers instead of mcpServers, and the server adds "type": "stdio" |
Codex CLI
In ~/.codex/config.toml:
[mcp_servers.metal-trace]
command = "/opt/homebrew/bin/uvx"
args = ["metal-gpu-trace"]
env = { METAL_TRACE_OUT = "/absolute/path/to/perf-runs", METAL_TRACE_WINE = "/absolute/path/to/wine" }
Tools
25 tools in four groups. Your agent picks them; you rarely call one yourself. Each row starts with what the tool is for, then the detail.
Record
| Tool | Reads or records |
|---|---|
perf_record |
Records one run of a program and returns its summary. — Records a program and returns its summary; when it ends it stops every program of its Wine prefix, or every process named like a native program. counters=true also records Metal GPU Counters: gpu_counters (the limiters, utilization, occupancy and memory bandwidth of the GPU, with the main limiter) in the summary, at about 40 s of read-back per recorded second; not under Windows |
perf_attach |
Records a program that is already running, without restarting it. — Records a program that is already running, by pid or name, and leaves it running |
perf_baseline_record |
Records the same program several times and saves the runs as a reference. — Records the same program count times (default 3) with perf_record's arguments and saves the runs as a reference in one call. skip_s as in perf_baseline |
perf_ab |
Tries two settings of the same program and says which comes out better. — Records the same program with two environments (env_a, env_b: NAME=VALUE pairs) in the order A B B A and says per metric (FPS, 1 % low, GPU ms, stutter) whether B is better, worse or the same: better or worse only when every B value is outside A's range |
perf_sweep |
Records the program once per value of one setting (size, resolution, …) to see how it scales. — Records the same program once per value of one variable (dim, size, example, api or env:NAME), 2 to 8 values, rounds times (every other round in reverse order), and returns per value the median FPS, 1 % low, GPU ms per frame and stutter; with 3 or more numeric values it fits GPU ms per frame on the value (fixed ms and ms per draw for dim) with its r2 |
perf_cold_warm |
Records the program twice in a row to see how much its first start-up stutters while compiling shaders. — Records the same program twice in a row and says how many more shader-compile hitches the first run has than the second (first_seen_hitches), with each run's hitches, hitches per minute and graphics compiler time; the Metal shader cache is not cleared between them |
Judge and compare
| Tool | Reads or records |
|---|---|
perf_compare |
Compares two recordings: what got faster and what got slower. — Compares two recordings: headline numbers, encoders, GPU idle time and each encoder label's GPU ms per frame, largest change first; flags those under 100 frames. markdown=true adds the numbers as Markdown tables for a PR comment; skip_s leaves out the first seconds of each recording (start-up) and recomputes the GPU numbers, hitches and Metal memory without them. perf_gate takes skip_s too |
perf_check |
Judges a recording against a saved reference: same, better or regressed. — Judges a recording against a reference: regressed when FPS falls under the range by more than margin_pct (default 3), GPU ms per frame rises over it, or encoders or command buffers per frame exceed it; improved or same otherwise, with the reasons and the full comparison |
perf_gate |
Checks a recording against limits you set and answers pass or fail. — Checks a recording against budgets you set (FPS and 1% low floors; stutter, p95 GPU ms, hitch and Metal MiB ceilings) and returns pass or fail with each limit and value; a missing number fails |
perf_baseline |
Saves several equal recordings as a reference and tells how much equal runs differ by themselves. — Saves several equal recordings as a named reference and returns the range each number spans across them and spread_pct, how much equal runs differ (the noise a change must beat); alone, lists the references. skip_s saves each run without its first seconds and perf_check applies the same cut to the run it judges |
perf_history |
Follows one number across many recordings. — Follows FPS, 1% low, GPU ms, stutter, hitches and Metal MiB across the runs whose name starts with a prefix, oldest first, with the change from first to last |
perf_diagnose |
Says whether the program splits GPU work into too many tiny pieces, as translation layers do. — Says whether a recording splits its GPU work into too many short encoders, as translation layers do, with encoders and command buffers per frame, the labels with the most GPU time and the GPU's idle time |
Dig deeper
| Tool | Reads or records |
|---|---|
perf_export_trace |
Exports a recording's frames to a file that Perfetto or Chrome can draw. — Writes a recording's GPU frames as <run>.chrome-trace, one slice per frame, for ui.perfetto.dev or chrome://tracing |
trace_tables |
Lists the tables of a kept .trace. — Lists the tables of a kept .trace, named by its run or its path |
trace_count |
Counts the rows of several tables of a kept .trace. — Counts the rows of several tables of a kept .trace, in all and per process; by default the tables that matter for a translation layer (GPU intervals, encoders, compiler spills, compiled shaders, allocations, counters, Time Profiler), so an empty one shows before reading it |
trace_query |
Returns rows of one table of a kept .trace. — One page of rows of one table, optionally one process; with window_ms, one page of time windows (count and summed duration) in rows instead |
capture_summary |
Summarizes a .gputrace capture. — Summarizes a .gputrace; lists its 100 most frequent calls out of calls_total |
capture_diff |
Compares two .gputrace captures. — Counts of each confirmed Metal call in both (debug markers not counted), their difference, and the debug groups whose calls differ |
capture_records |
Returns the records of a .gputrace capture, one page at a time. — One page of a .gputrace's records |
Setup and test programs
| Tool | Reads or records |
|---|---|
project_info |
Says which project is active and where its recordings are kept. — Says which project is active (from metal-gpu-trace.json), its baseline, and its recordings folder and where that comes from |
perf_runs |
Lists the recordings, newest first. — Lists recordings, newest first, one page at a time, whether each kept its .trace, and the translation layer it ran on (a fingerprint of its Direct3D DLLs, and its Wine); project names the active project |
gpu_family |
Apple's published facts for a GPU family or chip. — Apple's facts for a family or chip (Apple7, M1 Pro, M3 Max) |
workload_list |
Lists the test programs you can download. — Lists the test programs workload_fetch can download; for bgfx-examples, example_traits gives each example's class and its encoders per frame in native Metal |
workload_fetch |
Downloads a test program and checks its SHA-256. — Downloads a test program once, checks its SHA-256 and keeps it in ~/Library/Caches/metal-gpu-trace; Claude Code asks before every call |
presentmon_install |
Windows only: downloads PresentMon, the tool that measures frames there. — Windows only: downloads PresentMon, checks its pinned SHA-256 and keeps it in %LOCALAPPDATA%\metal-gpu-trace, where perf_record and perf_attach find it; Claude Code asks before every call |
perf_record takes workload, api (mtl, mtl-x64, vk, d3d11 or d3d12), dim, size and example instead of
program, to record a fetched test program (workload_list says what each has). mtl-x64 is native Metal built for
x86_64 and run under Rosetta, like Wine's programs; size ("1920x1080") sets drawstress's window. The first workload is bgfx's
17-drawstress (BSD-2, 9.3 MB),
built from source by .github/workflows/workloads.yml: a grid of cubes, dim³ draws per frame, with its shaders
inside the program. The compare-layer prompt (/metal-trace:compare-layer drawstress d3d12 in Claude Code) records it
in native Metal and under the Wine in METAL_TRACE_WINE, then runs perf_diagnose and perf_compare.
The second workload, bgfx-examples (55 MiB), holds thirty bgfx examples, each a different load (many cubes, textures,
render-target chains, a G-buffer, compute, reflective shadow maps, post-processing, draws the GPU decides, text and
interface, shadows, transparency, GPU read-back, virtual textures, upscaling, texture formats, occlusion queries, tessellation,
multiple windows, off-screen rendering; the last twenty-one measured in
native Metal and Wine D3D12 only, example_traits in workload_list gives each one's class and encoders per frame in both,
and 40-svt writes a 370 MB tile cache to temp/ in the workload's folder on its first run):
perf_record(workload="bgfx-examples", api="d3d12", example="21-deferred"). Two macOS levers change the Mac under a
recording: memory_free_pct (20 to 60) holds the whole Mac at that percentage of RAM free (memory_pressure), and
background runs the program under taskpolicy -b, a hard throttle. A small GPU-bound program does not feel the first
(drawstress stayed at 728 FPS and its resident memory fell); the second slows it several times over. Repeat a run that
uses either.
The third workload, godot, is a lit 3D scene a real engine builds from code (Godot 4.7.2, Forward+): 400 meshes, 8 lights,
a shadowed sun, api="mtl" for Godot's Metal driver and api="d3d12" under Wine for its Direct3D 12 driver, with
args="-- meshes=800 lights=16" to change it. workload_fetch("godot") keeps the 10 KB project from this repository's release and
downloads Godot's official macOS (171 MB) and Windows (86 MB) builds from godotengine/godot-builds, checking the SHA-512
this package pins; it needs about 257 MB and some seconds. The scene has no imported assets, so Godot does not import anything.
Godot compiles its pipelines on every start, which makes it a case for perf_cold_warm: its shader-compile hitches came back
unchanged in the second run.
Reading the numbers across runs
- A summary says where it ran and what the GPU did:
machine(chip, cores, RAM, macOS,screen_locked),gpu_activity(utilization of the device, renderer and tiler, split scenes, GPU recoveries: it covers the whole GPU, not only the program),resource_allocations(allocation events per frame, by type; a running total, not memory in use) andcommand_buffer_errors. - A locked Mac session leaves native Metal windows unpaced: 3 000 to 4 000 FPS against 120 with vsync, on the same
examples. Record with the Mac unlocked;
perf_comparereturnsscreenwhen one run was recorded locked and the other not. - GPU ms per frame follow the GPU's performance state: a run paced at 120 FPS sits in Minimum and takes more ms for
the same work (21-deferred: 1.75 ms paced, 0.27 ms unpaced).
perf_comparereturnsgpu_statewhen two runs sat in different states, andperf_diagnosereturnsdisplay_synced_hzwhen the FPS sits on a display rate. Compare runs paced alike: native Metal and D3D12 under Wine with Mullion, both at 120 FPS, do compare. - With
counters=true, each listed hitch also hastop_limiter: the Limiter counter with the highest mean over the interval before it (window_ms, read in whole 10 ms bins;nullwhen no sample falls in it), which can differ from the whole run's main limiter.
api=vk runs the same program through Vulkan on MoltenVK. MoltenVK is not shipped: set METAL_TRACE_MOLTENVK to a
directory (no spaces) holding an arm64 libMoltenVK.dylib, such as the one in a Vulkan SDK or brew install molten-vk.
The run's layer names MoltenVK with the library's SHA-256, so perf_compare against a native Metal run says it
compares two layers. In one measurement at dim=20, 10 s each: native Metal 2 encoders per frame; MoltenVK 13, 91 % of
them short, and the GPU idle 89 % of the time (perf_diagnose: too_many_short_encoders true). One pair of runs, not a
benchmark.
api=vk is native only. drawstress.exe --vk under Wine needs a Wine built with Vulkan: the Wine of DXMT and Apple's
Game Porting Toolkit were tried and both log Wine was built without Vulkan support, so the recording holds no GPU
frames. CrossOver's Wine has Vulkan but runs only inside one of its bottles, which was not tried.
The same facts are MCP resources: metal-trace://gpu-families (all) and metal-trace://gpu-families/apple7 to
apple10. Each saved run is a resource too: metal-trace://runs/<run> reads its summary. They restate Apple's Metal Feature Set Tables
of 21 May 2026, MTLGPUFamily and the
M3 tech talk; check a device with supportsFamily.
How it follows the MCP specification (2025-11-25 and 2026-07-28) and Claude Code's limits:
- stdout carries only MCP messages; each tool call logs one line to stderr (
METAL_TRACE_LOG=offsilences it), with no arguments or paths. - Lists come in pages (
offset,limit, default 50, at most 500) withtotalandnext_offset; a result over 40 000 characters is refused with a hint to ask for a smaller page. - Files are read only inside the recordings folder (
METAL_TRACE_OUT, or the project'sruns) and the directories inMETAL_TRACE_READ(separated by:). - Failures come back as
isErrorresults that say what to do, without stack traces or local paths. Summaries cut absolute paths to file names, so they can be shared. - Every
xctracecall has a timeout.
HTTP
METAL_TRACE_TOKEN=<secret of 16+ characters> metal-gpu-trace --http [--port N] serves the same tools at
POST http://127.0.0.1:8765/mcp (Streamable HTTP, one JSON reply per request), for a client on the same Mac that cannot
start a stdio server. Every request needs Authorization: Bearer <token>. It listens on 127.0.0.1 only, refuses a
request whose Host or Origin is not localhost or 127.0.0.1 (DNS rebinding), and does not start without the token. It
speaks both MCP eras: a client that sends initialize gets the behaviour it always had; one that sends
MCP-Protocol-Version: 2026-07-28 is stateless and must also send Mcp-Method (and Mcp-Name for tools/call,
prompts/get and resources/read), which the server checks against the body (400 with -32020 when they differ). A
modern client cancels a running call by closing the connection; an initialize client sends notifications/cancelled
from another connection. There is no progress stream over HTTP, and no remote access: reach another Mac through an SSH
tunnel (ssh -L 8765:127.0.0.1:8765 mac), not by opening the port. Why two eras:
docs/adr/0002-dual-era-mcp.md.
Windows tests on a real machine
GitHub's windows-latest has no GPU and no desktop session, so PresentMon and DWM recordings are only tested on a real
Windows machine. windows/winbridge-run-tests.ps1 updates a checkout there and runs tests/test_perf_record_windows.py; it is
written as a WinBridge task (fixed name, script pinned by SHA-256, no
arguments). To register it, copy it to the laptop, set $repo to the checkout's path, take its hash there with
Get-FileHash <file> -Algorithm SHA256 (Git may have changed the line endings, so the hash of the copy in this repo is
not the one to use), and add a [tasks.<name>] table with script and sha256 to the agent's TOML.
CI gate
metal-gpu-trace check RUN BASELINE [--margin-pct N] runs perf_check without a client and prints one JSON line
(verdict, reasons, hints). Exit code 0: same or improved; 1: regressed; 2: could not be judged (no such run or
reference, or under 100 frames). Runs are read from the recordings folder (METAL_TRACE_OUT, or the project's runs). Recording needs Instruments, so the job runs on
a self-hosted macOS runner:
jobs:
  perf:
    runs-on: [self-hosted, macOS, ARM64]
    steps:
      - run: PERF_OUT=~/perf-runs zsh path/to/metal-gpu-trace/src/metal_gpu_trace/perf_record.sh pr 30 native - . ./app
      - run: METAL_TRACE_OUT=~/perf-runs metal-gpu-trace check "$(ls -t ~/perf-runs/pr_*.json | head -1 | xargs basename -s .json)" main-ref
Credits
- The record layout of a
.gputracecommand stream follows tmc/gputrace (MIT); no code is copied. The call ids were matched against Xcode's command list on macOS 27.0.1. - GPU family facts: Apple's documents linked above, restated, not quoted.
1 maintainer

Metadata
1 maintainer
Release files for metal-gpu-trace 0.26.0
For a detailed explanation of source distributions (sdists) and built distributions (wheels), please see the package formats documentation.
Source distribution (sdist)
| File | Size | Uploaded | Provenance | Actions |
|---|---|---|---|---|
| metal_gpu_trace-0.26.0.tar.gz | 342.9 kB | With provenance | Details for metal_gpu_trace-0.26.0.tar.gz |
Built distribution (wheel)
| File | Interpreter | ABI | Platform | Actions Reset |
|---|---|---|---|---|
| metal_gpu_trace-0.26.0-py3-none-any.whl | Python 3 | none | any | Details for metal_gpu_trace-0.26.0-py3-none-any.whl |
Total release size: 459.8 kB
Release files / metal_gpu_trace-0.26.0.tar.gz
| Download URL | metal_gpu_trace-0.26.0.tar.gz |
|---|---|
| Size | 342.9 kB |
| Tags | Source |
|
SHA-256 checksum How to use checksums |
836c077b97402b39b21af4d186b44138cf0c4ad8ff49d18347fb99bad98d2a94
|
|
BLAKE2b-256 checksum How to use checksums |
89889544e5c2737563ad648b7161ed8991c979fcbfdf5e5f1aaf8d15cdc8589f
|
| Upload date | |
|
Uploaded using Trusted Publishing? What is trusted publishing? |
Yes |
| Uploaded via |
twine/7.0.0 CPython/3.13.16
|
Provenance
Provenance describes where a file came from. On PyPI, provenance is shared via attestations, which provide a verifiable record of the build or publishing details. View details, limitations and caveats.


PyPI Publish Attestation
PyPI verified that this artifact, at this checksum, originated from the publisher listed below.
Signed by GitHub Actions, verified by PyPI on Nov 16, 2026.
Transparency logRelease files / metal_gpu_trace-0.26.0-py3-none-any.whl
| Download URL | metal_gpu_trace-0.26.0-py3-none-any.whl |
|---|---|
| Size | 116.9 kB |
| Tags | Python 3 |
|
SHA-256 checksum How to use checksums |
46beb343b69fab8144c7bbf2d32b131ea49074f1a281caa3c570730b2d95eb99
|
|
BLAKE2b-256 checksum How to use checksums |
21a8d345f1d9a300ad40c848b40c053da6693140193dec20de79d1cac45fe69b
|
| Upload date | |
|
Uploaded using Trusted Publishing? What is trusted publishing? |
Yes |
| Uploaded via |
twine/7.0.0 CPython/3.13.16
|
Provenance
Provenance describes where a file came from. On PyPI, provenance is shared via attestations, which provide a verifiable record of the build or publishing details. View details, limitations and caveats.
PyPI Publish Attestation
PyPI verified that this artifact, at this checksum, originated from the publisher listed below.
Signed by GitHub Actions, verified by PyPI on Nov 16, 2026.
Transparency logSecurity for metal-gpu-trace 0.26.0
Provenance
Provenance describes where a file came from. On PyPI, provenance is shared via attestations, which provide a verifiable record of the build or publishing details. View details, limitations and caveats.
Full provenance
Both files in this release have been uploaded with provenance metadata.
Attestation for metal_gpu_trace-0.26.0.tar.gz
PyPI Publish Attestation
PyPI verified that this artifact, at this checksum, originated from the publisher listed below.
Signed by GitHub Actions, verified by PyPI on Nov 16, 2026.
Transparency logA note on package security
PyPI is a repository for distributing packages, not a service for auditing them. While third-party security researchers and our staff do their best to detect and remove malicious packages, PyPI cannot guarantee the quality, security or suitability of any given package.
To learn more about protecting yourself from malicious actors, visit our package security documentation.














