No project description provided


Project description

miMic (Mann-Whitney image microbiome)
This repository is attached to the paper "mi-Mic: a novel multi-layer statistical test for microbiota-disease associations".
miMic is a straightforward yet remarkably versatile and scalable approach for differential abundance analysis.
miMic consists of three main steps:
-
Data preprocessing and translation to a cladogram of means.
-
An apriori nested ANOVA (or nested GLM for continuous labels) to detect overall microbiome-label relations.
-
A post hoc test along the cladogram trajectories.
miMic
miMic is available through the following platforms:
Install the package
pip install mimic-da
How to apply miMic
See example_use.py for an example of how to use miMic.
The example contains the following steps:
-
Import miMic and additional packages.
from mimic_da import apply_mimic
import pandas as pd
-
Load the raw ASVs table in the following format:
- The first column is named "ID"
- Each row represents a sample and each column represents an ASV.
- The last row contains the taxonomy information, named "taxonomy".
df = pd.read_csv("example_data/for_process.csv")
- Note:
for_process.csvis a file that contains the raw ASVs table in the required format, you can find an exmaple file inexample_datafolder.
-
Load a tag table as csv, such that the tag column is named "Tag".
tag = pd.read_csv("example_data/tag.csv",index_col=0)
- Note:
tag.csvis a file that contains the tag table in the required format, you can find an example tag inexample_datafolder.
- Note:
-
Specify a folder to save the output of the miMic test.
folder = "example_data/2D_images"
- Note:
2D_imagesis a folder that will be created in your current working directory, and the output of the miMic test will be saved there.
- Note:
-
Apply MIPMLP.
- MIPMLP using defaulting parameters, you can find more in 'Note' section below.
- taxonomy_group: ["sub PCA", "mean", "sum"], "sub PCA" method is preferred.
processed = apply_mimic(folder=folder, tag=tag, mode="preprocess", preprocess=True, rawData=df,
                         taxnomy_group='sub PCA')
- Note: MIPMLP is a package that is used to preprocess the raw ASVs table, see MIPMLP PyPi or MIPMLP website for more explanations.
If you have your own processed data, setpreprocessto False, and use your processed data as input forproceesedparameter in the next step.
-
Apply miMic test.
miMic using the following hyperparameters:- eval: evaluation method, ["man", "corr", "cat"]. Default is "man".
- "man" for binary labels.
- "corr" for continuous labels.
- "cat" for categorical labels.
- sis: apply sister correction,["fdr_bh", "bonferroni", "no"]. Default is "fdr_bh".
- correct_first: apply FDR correction to the starting taxonomy level according to
sisparameter,[True, False] Default is True. - mode: 2 different formats of running,["test", "plot"]. Default is "test".
- save: whether to save the corrs_df of the miMic test to computer,[True, False] Default is True.
- tax: starting taxonomy of the post hoc test,["None", 1, 2, 3, "noAnova", "nosignifacnt"]
- In "test" mode the defaulting value is "None".
- In the "plot" mode the tax is set automatically to the selected taxonomy of the "test" mode [1, 2, 3, "noAnova"].
- "noAnova", where apriori nested ANOVA test is not significant.
- "nosignificant", where apriori nested ANOVA test is not significant and miMic did not find any significant taxa in the leafs. In this case, the post hoc test will not be applied.
- colorful: Determines whether to apply colorful mode on the plots [True, False]. Default is True.
- threshold_p: the threshold for significant values. Default is 0.05.
- THRESHOLD_edge: the threshold for having an edge in "interaction" plot. Default is 0.5.
- processed: the processed data from the previous step. Default is None.
- apply_samba: whether to apply samba or no. Default is True (Boolean).
- samba_output: if you already have samba outputs- miMic will read it from the folder you specified,
else miMic will apply samba and set
samba_outputto None.
  if processed is not None:
       taxonomy_selected,samba_output = apply_mimic(folder, tag, eval="man", threshold_p=0.05, processed=processed, apply_samba=True, save=False)
       if taxonomy_selected is not None:
           apply_mimic(folder, tag, mode="plot", tax=taxonomy_selected, eval="man", sis='fdr_bh', samba_output=samba_output,save=False,
                       threshold_p=0.05, THRESHOLD_edge=0.5)
- Note: if
apply_sambais set to True, miMic will apply samba-metric.
Ifsaveis set to True, the output will be saved to the folder you specified.
See SAMBA PyPi for more explanations.
- eval: evaluation method, ["man", "corr", "cat"]. Default is "man".
miMic output
miMic will output the following:
-
If
saveis set to True, samba outputs and the following csv will be saved to your specified folder:- corrs_df: a dataframe containing the results of the miMic test (including Utest results).
- just_mimic: a dataframe containing the results of the miMic test without the Utest results.
- u_test_without_mimic: a dataframe containing the results of the Utest without the miMic results.
- miMic&Utest: a dataframe containing the joint results of miMic and Utest tests.
-
If
modeis set to "plot", plots will be saved in the folder named 'plots' in your current working directory.
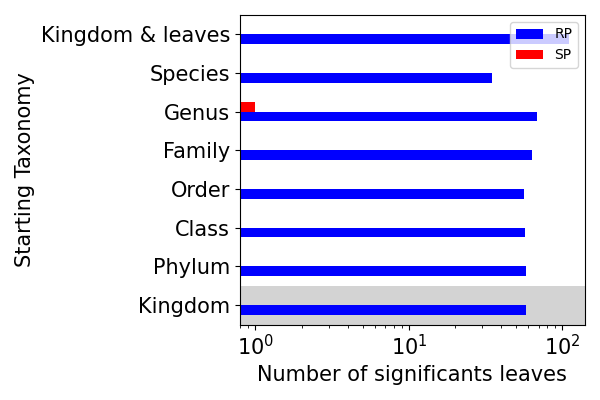
The following plots will be saved:-
tax_vs_rp_sp_anova_p: plot RP vs SP over the different taxonomy levels and color the background of the plot till the selected taxonomy, based on miMic test.
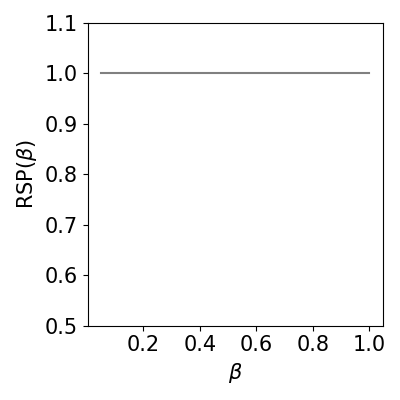
-
rsp_vs_beta: calculate RSP score for different betas and create the appropriate plot.
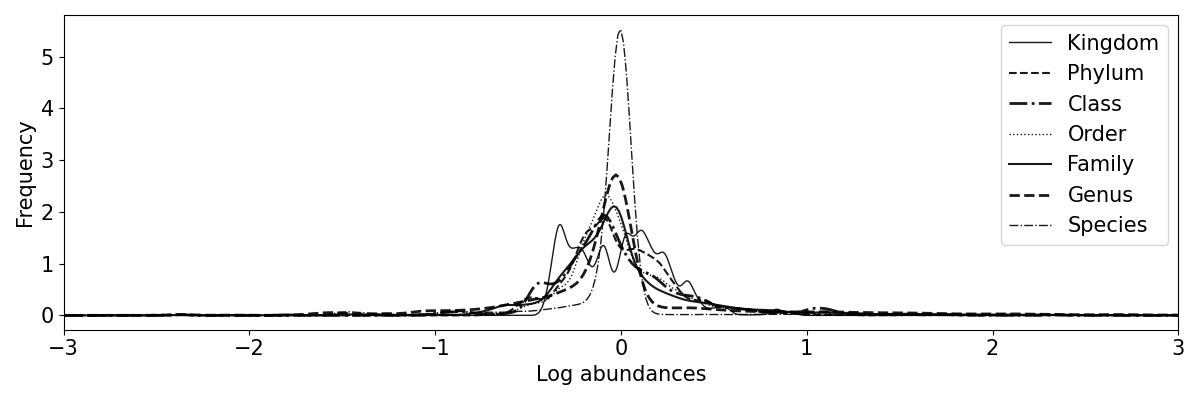
-
hist: a histogram of the ASVs in each taxonomy level.
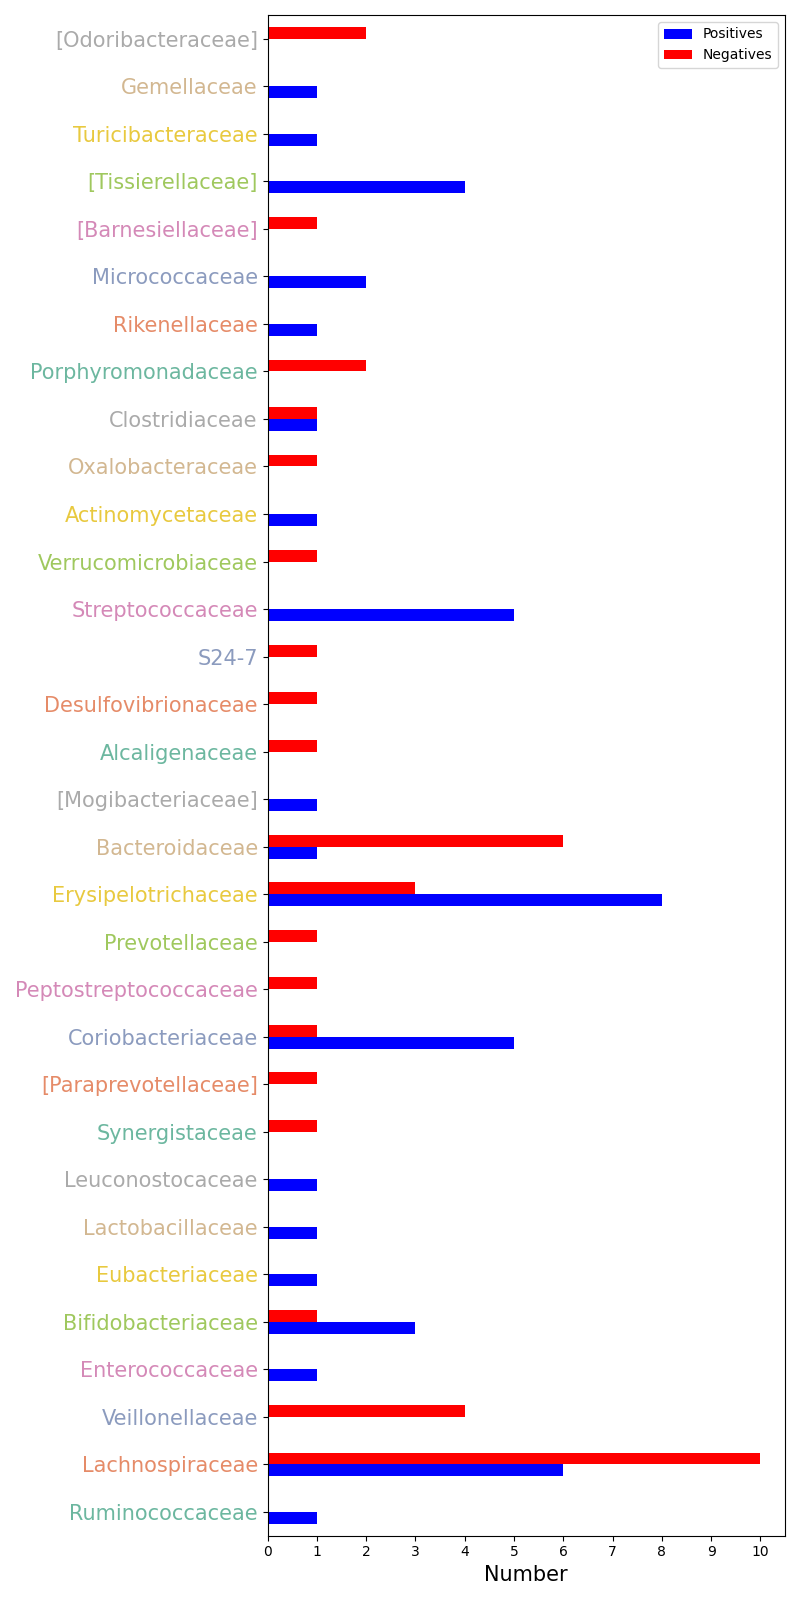
-
corrs_within_family: a plot of the correlation between the significant ASVs within the family level, if
colorfulis set to True, each family will be colored.
-
interaction: a plot of the interaction between the significant ASVs.
-
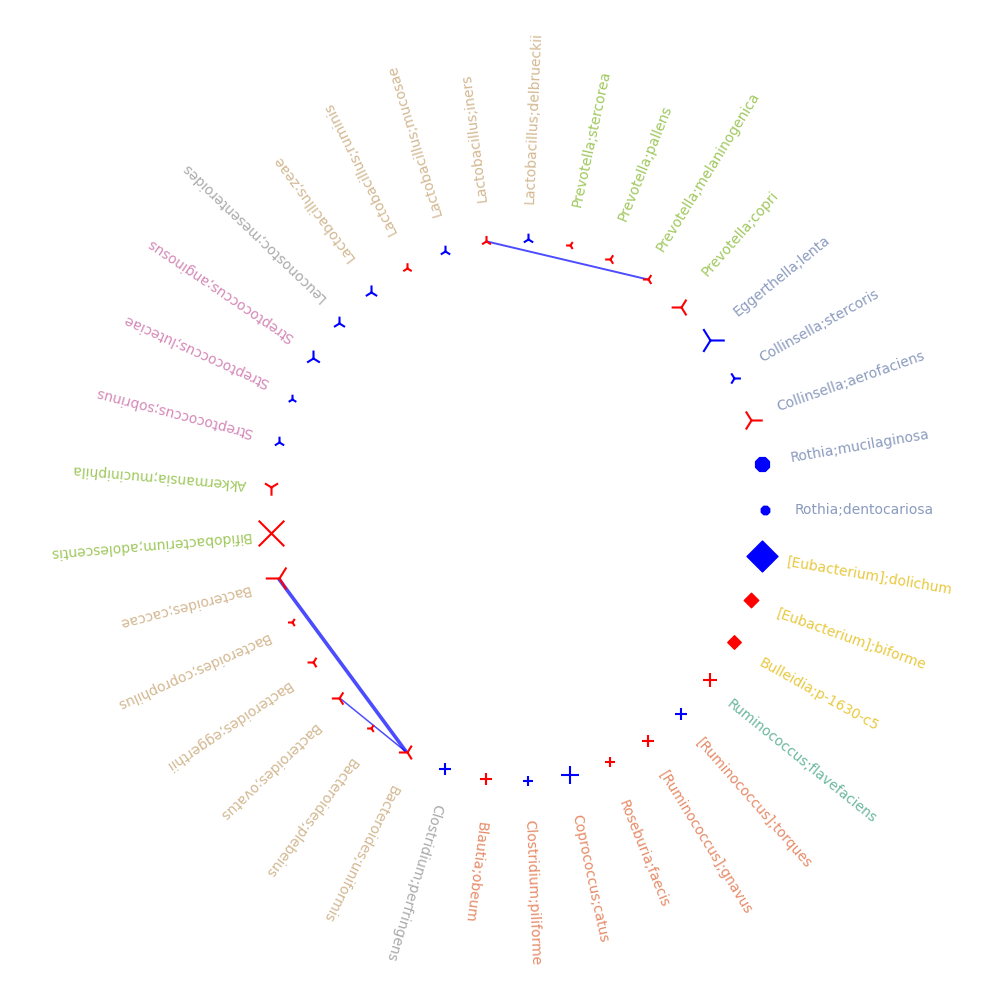
correlations_tree: create correlation cladogram, such that tha size of each node is according to the -log(p-value), the color of each node represents the sign of the post hoc test, the shape of the node (circle, square,sphere) is based on miMic, Utest, or both results accordingly, and if
colorfulis set to True, the background color of the node will be colored based on the family color.
-

Cite us
If you are using our package, miMic for any purpose, please cite us; Shtossel, Oshrit, Shani Finkelstein, and Yoram Louzoun. "mi-Mic: a novel multi-layer statistical test for microbiota-disease associations." Genome Biology 25, no. 1 (2024): 113. https://link.springer.com/article/10.1186/s13059-024-03256-0
Release history Release notifications | RSS feed


Download files
Download the file for your platform. If you're not sure which to choose, learn more about installing packages.
Source Distribution
Built Distribution
Filter files by name, interpreter, ABI, and platform.
If you're not sure about the file name format, learn more about wheel file names.
Copy a direct link to the current filters
File details
Details for the file mimic_da-1.0.1.tar.gz.
File metadata
- Download URL: mimic_da-1.0.1.tar.gz
- Upload date:
- Size: 1.1 MB
- Tags: Source
- Uploaded using Trusted Publishing? No
- Uploaded via: twine/4.0.2 CPython/3.10.12
File hashes
| Algorithm | Hash digest | |
|---|---|---|
| SHA256 |
30bac741124d24d2e02d6799c36f0c4c0270ecf84bc11d40d42b22650c796a22
|
|
| MD5 |
3c24255855c7a3274f3fd27210157126
|
|
| BLAKE2b-256 |
07016086703a6d1b1cc04b714183ad1663cdf04742aff7b6f94b2df9fdbcb0fb
|
File details
Details for the file mimic_da-1.0.1-py3-none-any.whl.
File metadata
- Download URL: mimic_da-1.0.1-py3-none-any.whl
- Upload date:
- Size: 23.7 kB
- Tags: Python 3
- Uploaded using Trusted Publishing? No
- Uploaded via: twine/4.0.2 CPython/3.10.12
File hashes
| Algorithm | Hash digest | |
|---|---|---|
| SHA256 |
072ce37c3d5304dc3aa7d03cf64138e834ccfea23c3983311f98e7c2dbb8ce7d
|
|
| MD5 |
e2cfcc1be04b938b0caf3e260f1d0d2c
|
|
| BLAKE2b-256 |
6351c7edc60fd9971d5563eaa922d6229c31244ec084614abb1f6994d8f1512d
|


