Simple visualization tool for clustered high-density data.

Project description
miso-plot

A lightweight visualization tool for clustered high-density data


Overview
miso-plot is a simple yet efficient Python library for visualizing large clustered datasets. It was designed for fast exploration of high-density 2D embeddings such as UMAP, t-SNE, or PCA outputs, using adaptive density smoothing and perceptually uniform color palettes.
Typical use cases include:
- visual inspection of clustering quality in large datasets,
- density-based highlighting of local data structures,
- generation of publication-quality scatter plots.
Installation
pip install miso-plot
Or install the latest development version directly from GitHub:
pip install git+https://github.com/Aleksandra795/miso-plot.git
Quick Example
import numpy as np
import matplotlib.pyplot as plt
from sklearn.datasets import make_blobs
from miso_plot import miso_plot

# Generate synthetic clustered data
X, labels = make_blobs(n_samples=50000, centers=6, n_features=2, random_state=42)
Y = X[:, 1]
X = X[:, 0]

# Plot simple scatterplot of the data
plt.figure()
plt.scatter(X, Y, s=10, c=labels, alpha=0.5, cmap='tab10')
plt.xlabel("x")
plt.ylabel("y")
plt.title("simple scatter plot")
plt.grid(True)
plt.show()
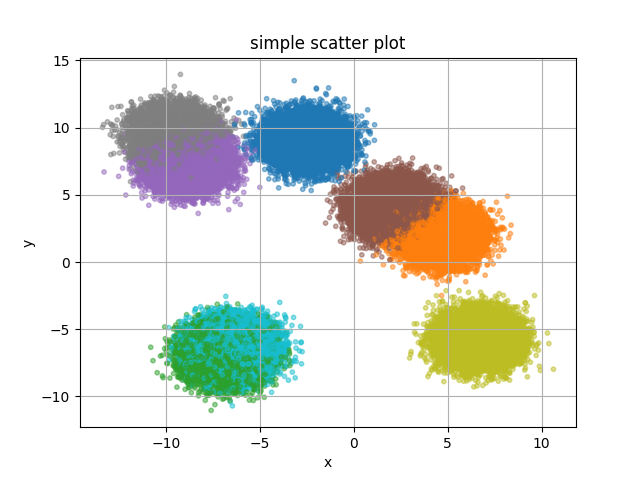
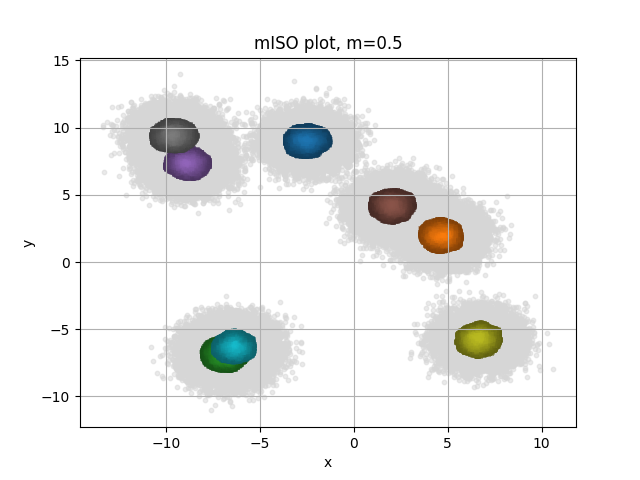
Because often the clusters overlap substantially, identifying their true centers is challenging. miso-plot facilitates this process by visualizing each cluster’s density distribution, highlighting regions representing the top m fraction of its overall density.
# Show cluster density centers with miso-plot
fig, ax = plt.subplots()
plt.scatter(X, Y, s=10, c='#D6D6D6', alpha=0.5)
miso_plot(X, Y, labels, cmap="tab10", m=0.5, ax=ax)
plt.xlabel("x")
plt.ylabel("y")
plt.title("mISO plot, m=0.5")
plt.grid(True)
plt.show()
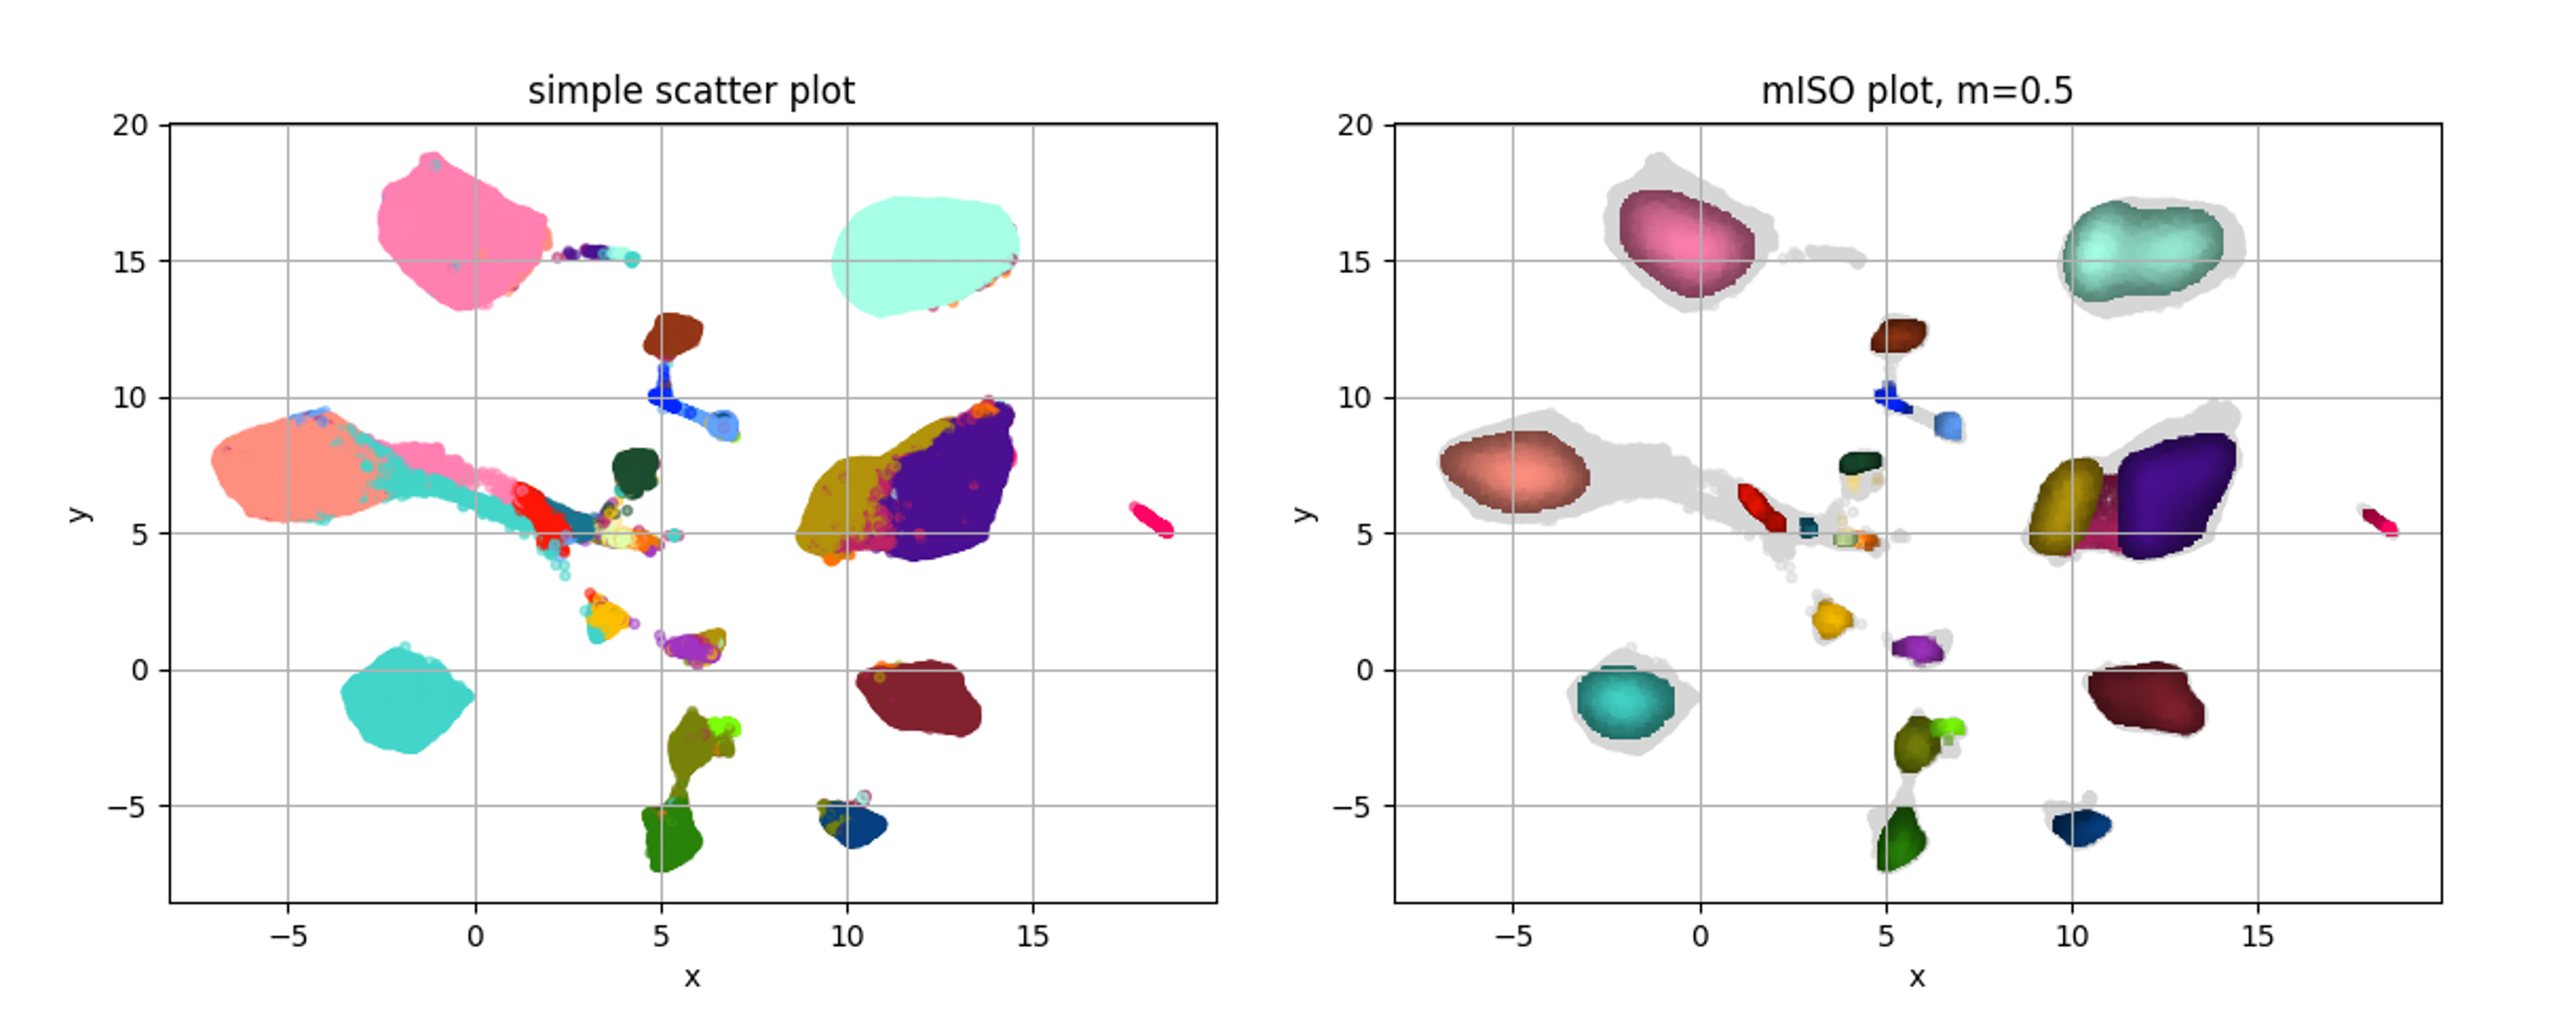
The usefulness of miso-plot is best illustrated using real experimental data. Below is an example based on single-cell mass cytometry data from Samusik et al. (2016) — “Automated mapping of phenotype space with single-cell data” (Nature Methods, 13, 493–496; DOI: 10.1038/nmeth.3863) — containing 24 manually annotated bone marrow cell subtypes. miso-plot clearly reveals the dominant spatial organization of these subtypes on the UMAP projection while suppressing outliers and low-density noise, making the overall cluster structure easier to interpret.
API Overview
miso_plot(X, Y, labels, cmap='miso24', m=0.5, lam=20, ax=None, alpha=0.3, marker='s', size=10)
Generates a smoothed scatter plot with adaptive density highlighting.
| Parameter | Type | Description |
|---|---|---|
X, Y | np.ndarray | Coordinates of points |
labels | np.ndarray | Cluster labels for each point |
cmap | str or list | Colormap ('miso24', matplotlib/seaborn name, or list of hex) |
m | float | Density threshold |
lam | int | Smoothing parameter |
ax | matplotlib.axes.Axes or None | Optional existing Axes; creates a new one if None |
alpha | float | Transparency of points |
marker | str | Marker style |
size | int | Size of each point |
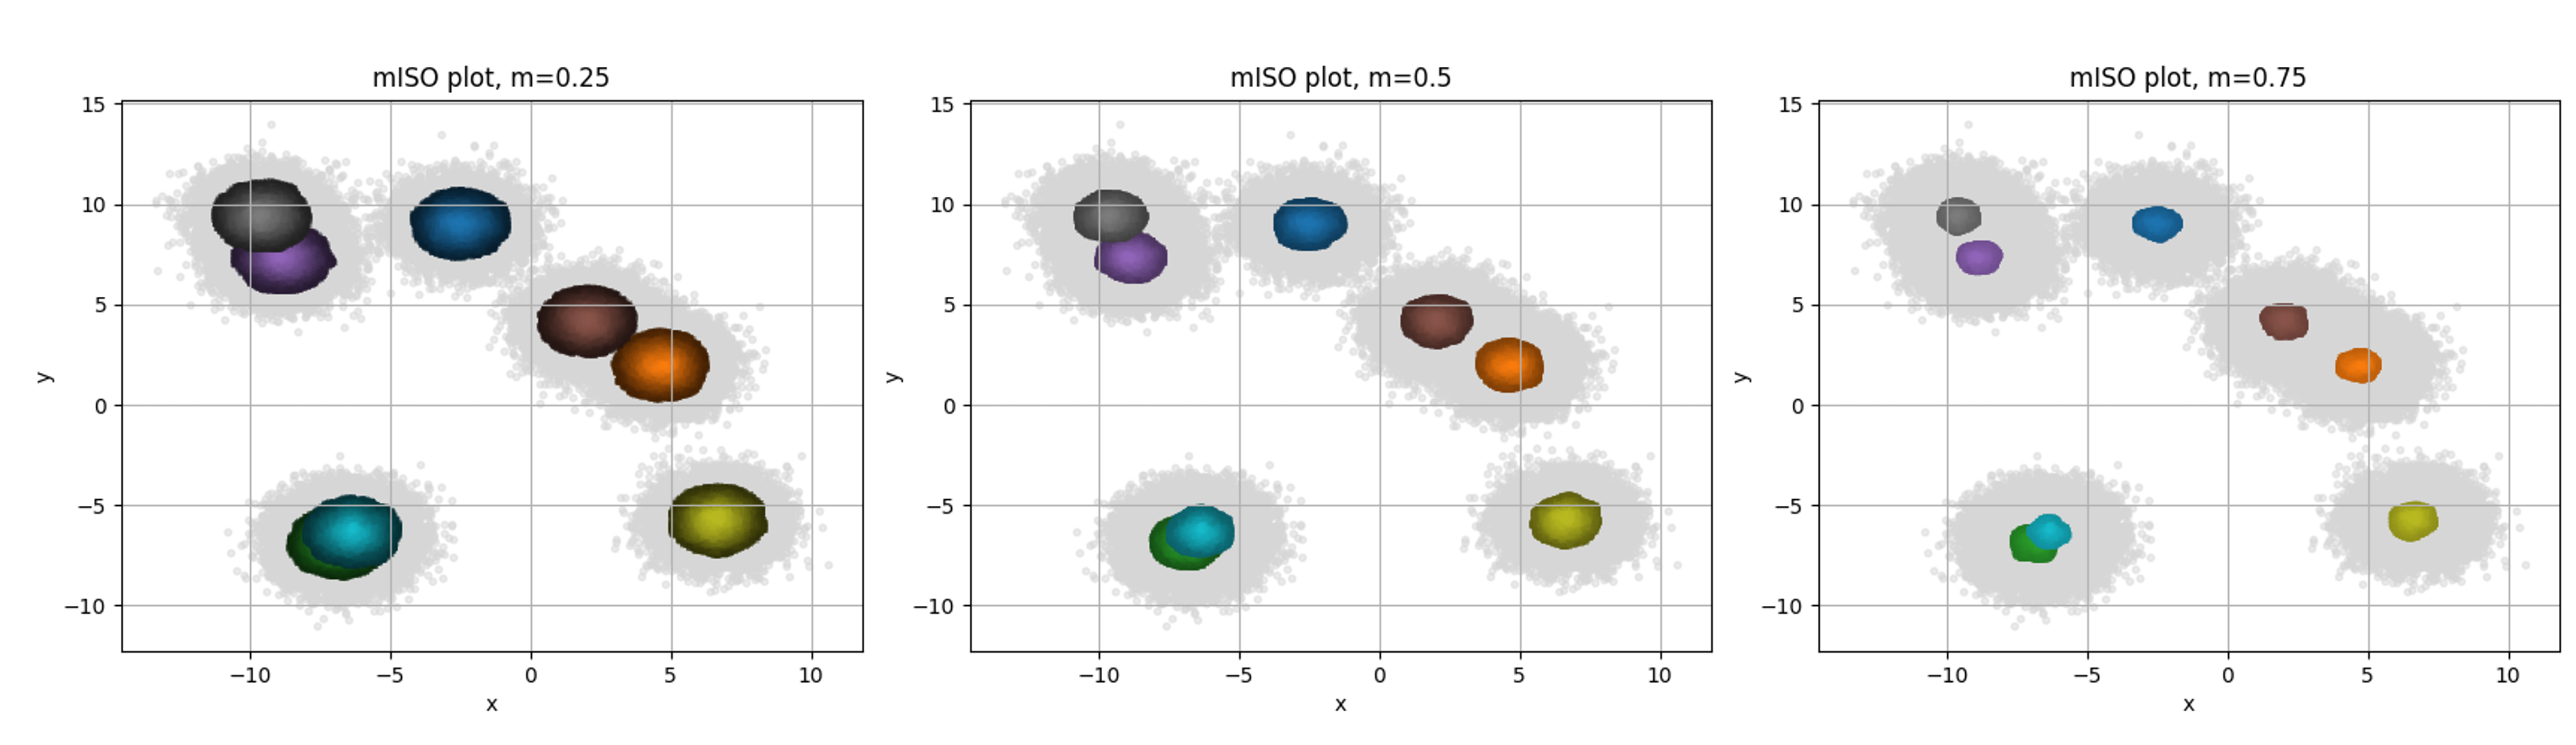
The m parameter has the strongest impact on the visual output of miso-plot. Its default value is 0.5, corresponding to the median density isoline, but it can be adjusted to control how much of the cluster density is visualized. Common choices include 0.25 (top 75% of the densest regions) and 0.75 (top 25%), depending on the desired level of detail.
Color Palettes
Built-in palette: miso24
Designed for cluster visualization (24 clusters) with high perceptual separation.

You may also pass:
- any matplotlib/seaborn palette name (e.g. 'viridis', 'tab10'),
- a custom list of hex colors (e.g. ['ff0000', '00ff00', '0000ff']).
Citation
If you use miso-plot or the underlying method in your research or publications, please cite:
Suwalska, A.; Polanska, J.
GMM-Based Expanded Feature Space as a Way to Extract Useful Information for Rare Cell Subtypes Identification in Single-Cell Mass Cytometry.
Int. J. Mol. Sci. 2023, 24(18), 14033.
https://doi.org/10.3390/ijms241814033
(Open Access)
License
This project is distributed under the MIT License.
Release history Release notifications | RSS feed

Download files
Download the file for your platform. If you're not sure which to choose, learn more about installing packages.
Source Distribution
Built Distribution
Filter files by name, interpreter, ABI, and platform.
If you're not sure about the file name format, learn more about wheel file names.
Copy a direct link to the current filters
File details
Details for the file miso_plot-0.1.2.tar.gz.
File metadata
- Download URL: miso_plot-0.1.2.tar.gz
- Upload date:
- Size: 8.0 kB
- Tags: Source
- Uploaded using Trusted Publishing? No
- Uploaded via: twine/6.2.0 CPython/3.11.4
File hashes
| Algorithm | Hash digest | |
|---|---|---|
| SHA256 |
834f6447ea8997a89699e2dd81db8967ce7f5bd0b86a00c1b56e4748e313c51d
|
|
| MD5 |
fd23298607f7a5bfa54e8e7c79d58e89
|
|
| BLAKE2b-256 |
fb56a074804c39fa48a1038676b04c783dbfd0f00144a84bffd1d966dec076d3
|
File details
Details for the file miso_plot-0.1.2-py3-none-any.whl.
File metadata
- Download URL: miso_plot-0.1.2-py3-none-any.whl
- Upload date:
- Size: 8.1 kB
- Tags: Python 3
- Uploaded using Trusted Publishing? No
- Uploaded via: twine/6.2.0 CPython/3.11.4
File hashes
| Algorithm | Hash digest | |
|---|---|---|
| SHA256 |
ea7ce7e2f6c6ccdba6014a0f2cff82bce71e91f5320854c17c798367faa2a596
|
|
| MD5 |
0ce678488eb1cb3445a553f636d14207
|
|
| BLAKE2b-256 |
e11940879c8727e46c01065e37f93327d129f915c46cc03ec6c8e24b91bf5174
|


