
Python3 tools for the NASA TESS/K2/KEPLER astrophysical missions

Project description
mkpy3
mkpy3 : Python3 tools for working with data from NASA's TESS/K2/Kepler missions.
Kenneth Mighell
Kepler Support Scientist
NASA Ames Research Center / SETI Institute
Making a finder chart for 2-min TESS observations of CD Ind using mkpy3
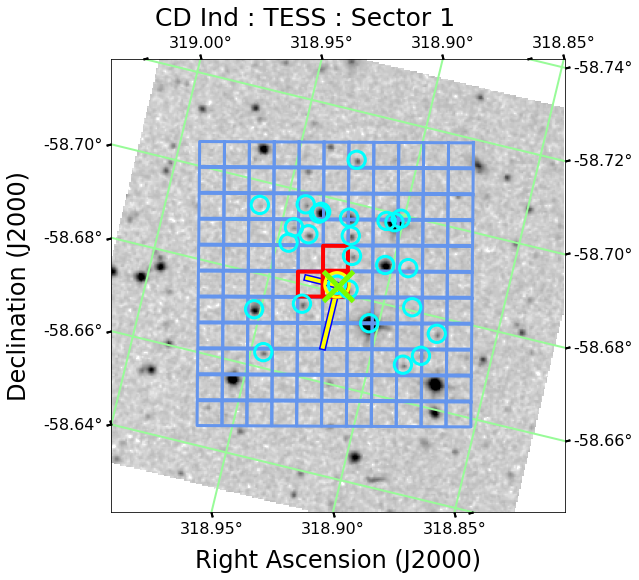
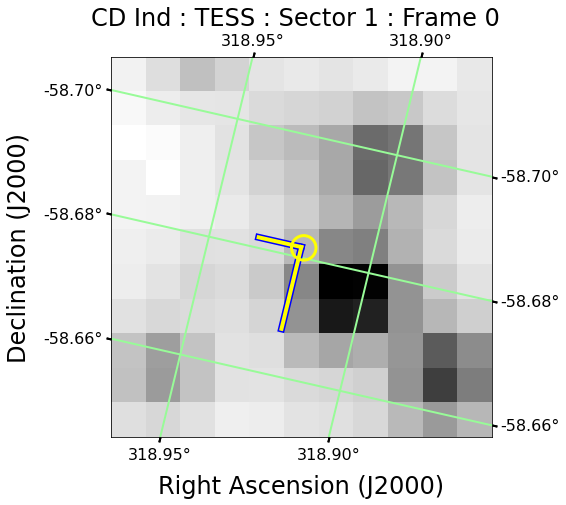
- blue squares show the TESS target pixel file overlay.
- red squares show the TESS target piexl file aperture overlay.
- green lines show the Right Ascension / Declination grid.
- yellow circle marks the target (CD Ind).
- cyan circles show some of the GAIA DR2 catalog stars in the field.
- green X shows the only VSX catalog star in the field (the target).
- Compass rose:
- long arm of the compass rose points NORTH.
- short arm of the compass rose points EAST.
Click the following link to see a Jupyter notebook that creates the above two plots:
Alternatively, you can create these plots using the following Python 3 code snippets.
The following code snippet creates the finder chart (above left) using mkpy3:
# download TESS 2-min observation of CD Ind from STScI
import lightkurve as lk
search_results = lk.search_targetpixelfile('CD Ind', radius=60,
  mission='TESS', sector=1)
tpf = search_results[0].download(quality_bitmask=0)
#
import mkpy3
#
# show the TPF overlay on rotated "DSS2 Red" survey image
ax = mkpy3.mkpy3_tpf_overlay_v6(tpf=tpf, survey='DSS2 Red',
  rotationAngle_deg='tpf', width_height_arcmin=6, percentile=99.5,
  shrink=0.4, show_plot=False, plot_file='',
  title='CD Ind : TESS : Sector 1', print_gaia_dr2=False)
#
ax.coords[0].set_major_formatter('d.dd')
ax.coords[1].set_major_formatter('d.dd')
ax.tick_params(axis='x', labelsize=16, length=5, width=2,
  labeltop=True, labelbottom=True)
ax.tick_params(axis='y', labelsize=16, length=5, width=2,
  labelright=True, labelleft=True)
ax.grid(True, color='palegreen', lw=2, zorder=1)  # show RA/DEC grid
mkpy3.mkpy3_plot_add_compass_rose_v5(ax=ax, north_arm_arcsec=50)
#
# save, show, and close the plot
import matplotlib.pyplot as plt
plt.savefig('mkpy3_plot1.png', bbox_inches="tight");
plt.show(); plt.close()
The following code snippet creates the annotated TPF image plot (above right) using mkpy3:
# download TESS 2-min observation of CD Ind from STScI
import lightkurve as lk
search_results = lk.search_targetpixelfile('CD Ind', radius=60,
  mission='TESS', sector=1)
tpf = search_results[0].download(quality_bitmask=0)
#
# show the first frame of the TPF with RA/DEC axis and grid
import matplotlib.pyplot as plt
import astropy.visualization as av
import mkpy3
fig = plt.figure(figsize=(7, 7))
ax = plt.subplot(projection=tpf.wcs)
interval = av.PercentileInterval(99.9)
stretch = av.SqrtStretch()
frame = 0
image_data = tpf.flux[frame]
norm = av.ImageNormalize(image_data, interval=interval,
  stretch=stretch)
ax.imshow(image_data, norm=norm, cmap='gray_r')
ax.set_xlabel('Right Ascension (J2000)', size=24)
ax.set_ylabel('Declination (J2000)', size=24)
ax.tick_params(axis='x', labelsize=16, length=5, width=2,
  labeltop=True, labelbottom=True)
ax.tick_params(axis='y', labelsize=16, length=5, width=2,
  labelright=True, labelleft=True)
ax.coords[0].set_major_formatter('d.dd')
ax.coords[1].set_major_formatter('d.dd')
ax.grid(True, color='palegreen', lw=2, zorder=1)
mkpy3.mkpy3_plot_add_compass_rose_v5(ax=ax,  # add a compass rose
  north_arm_arcsec=50, wcs=tpf.wcs)
marker_kwargs = {'edgecolor': 'yellow',
  's': 600, 'facecolor': 'None', 'lw': 3, 'zorder': 10}
ax.scatter(tpf.ra, tpf.dec, transform=ax.get_transform('icrs'),
  **marker_kwargs)
fig.suptitle('CD Ind : TESS : Sector 1 : Frame 0', size=24)
#
# Save, show, and close the plot
plt.savefig('mkpy3_plot2.png', bbox_inches="tight");
plt.show(); plt.close()
Release history Release notifications | RSS feed


Download files
Download the file for your platform. If you're not sure which to choose, learn more about installing packages.
Source Distribution
Built Distribution
Filter files by name, interpreter, ABI, and platform.
If you're not sure about the file name format, learn more about wheel file names.
Copy a direct link to the current filters
File details
Details for the file mkpy3-1.0.1b21.tar.gz.
File metadata
- Download URL: mkpy3-1.0.1b21.tar.gz
- Upload date:
- Size: 336.8 kB
- Tags: Source
- Uploaded using Trusted Publishing? No
- Uploaded via: twine/3.2.0 pkginfo/1.6.1 requests/2.25.0 setuptools/50.3.2 requests-toolbelt/0.9.1 tqdm/4.50.2 CPython/3.8.5
File hashes
| Algorithm | Hash digest | |
|---|---|---|
| SHA256 |
685712c6d8fbeb9beba4bcaa0a8e7bf10fcda6b976d2bd8be110cd38aed05505
|
|
| MD5 |
e14ca3cc97a9f24eaddbabffa1b3b4eb
|
|
| BLAKE2b-256 |
9a29331bf515f3a54020bc8370d46aa2e7063341fab5e930514be654561d015a
|
File details
Details for the file mkpy3-1.0.1b21-py3-none-any.whl.
File metadata
- Download URL: mkpy3-1.0.1b21-py3-none-any.whl
- Upload date:
- Size: 43.9 kB
- Tags: Python 3
- Uploaded using Trusted Publishing? No
- Uploaded via: twine/3.2.0 pkginfo/1.6.1 requests/2.25.0 setuptools/50.3.2 requests-toolbelt/0.9.1 tqdm/4.50.2 CPython/3.8.5
File hashes
| Algorithm | Hash digest | |
|---|---|---|
| SHA256 |
f330b5ae4157f9252037e61e7e6a98485b0063b0c42237e23e3c10b0e57ef4cb
|
|
| MD5 |
594df3eefe5089af21385975ff893b45
|
|
| BLAKE2b-256 |
1a6368102fe1a22cebe7aed28b3909a95f78bf6162aff0713c1f0f5e60acf6a6
|






