
ml-data-guard
Data validation for ML pipelines, benchmarked with injected faults.
Status: benchmark, library and command line are complete; results below. The optional comparison with TFDV and Evidently was dropped (reason in
SPEC.md, section 15).
The goal is to measure, not to assume: inject known data faults (a feature pinned to -1, a dropped
column, a unit change, a distribution shift, a feature computed with future information) into public
datasets and report which checks catch them and how many false alarms they raise. The checks compared
are the L-inf and L1 distances from Breck et al., "Data Validation for Machine Learning" (SysML
2019), chi-square, KL, JS, PSI and Kolmogorov-Smirnov, and a schema validator. This is an independent
implementation and evaluation, not a copy of TensorFlow Data Validation.
Scope, data-security rules, evaluation-leakage rules and acceptance criteria: SPEC.md.
Project page with an interactive explorer of every result below: slastrzelec.github.io/portfolio/ml-data-guard.
The explorer is one static file, explorer/index.html, built from the result files by
python tools/build_explorer.py; it opens from disk and loads nothing from the network.
Results
Six runs from one commit, each reproducible from its stored config: UCI Covertype (581,012 rows), UCI Online News Popularity (39,644 rows), UCI Beijing air quality (412,029 hourly rows from 12 stations, once against a static reference and once against a rolling one), a synthetic i.i.d. table (4,000,000 rows) and a synthetic time-ordered series (2,000,000 rows). Per run and batch size: 1,000 calibration batches, 1,000 clean evaluation batches, 100 faulty batches for each fault and severity. Brackets are 95% intervals. Full tables: Covertype, News, Beijing, static, Beijing, rolling, synthetic, series.
The short version
- A schema check ("does the data still obey its contract?") and a distribution check ("does the data still look the same?") find different faults. Neither replaces the other.
- The fixed thresholds people copy from tutorials (
p < 0.05,PSI > 0.2) are wrong in both directions, depending on the data. - On real data that changes with the weather, comparing distributions is close to useless, and the remedy I expected to work (a rolling reference) did not.
- A feature computed from the wrong point in time passes every check of a single table.
1. False alarms on clean data
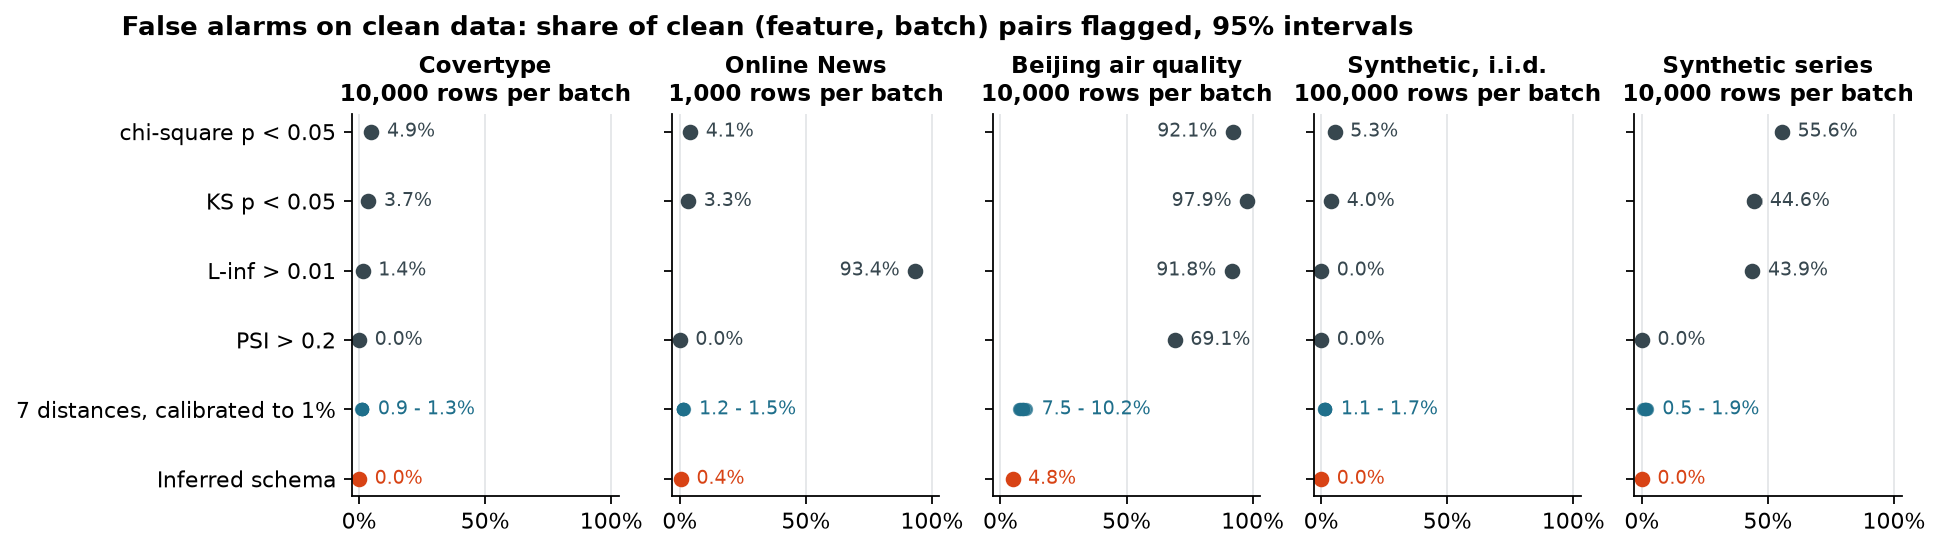
Share of clean (feature, batch) pairs that raise an alarm. Nothing was injected, so every alarm is false.
| Rule | Covertype, 10,000 rows | News, 1,000 rows | Beijing, 10,000 rows | Synthetic, 100,000 rows | Synthetic series, 10,000 rows |
|---|---|---|---|---|---|
chi-square p < 0.05 |
0.049 [0.045, 0.053] | 0.041 [0.039, 0.043] | 0.921 [0.917, 0.926] | 0.053 [0.048, 0.059] | 0.556 [0.541, 0.571] |
KS p < 0.05 |
0.037 [0.033, 0.041] | 0.033 [0.032, 0.035] | 0.979 [0.976, 0.981] | 0.040 [0.035, 0.045] | 0.446 [0.428, 0.464] |
L-inf > 0.01 |
0.014 [0.012, 0.016] | 0.934 [0.931, 0.936] | 0.917 [0.913, 0.922] | 0.000 [0.000, 0.001] | 0.439 [0.423, 0.454] |
PSI > 0.2 |
0.000 [0.000, 0.000] | 0.000 [0.000, 0.000] | 0.691 [0.684, 0.699] | 0.000 [0.000, 0.001] | 0.000 [0.000, 0.001] |
| Distances, calibrated to 1% | 0.009 - 0.013 | 0.012 - 0.015 | 0.075 - 0.102 | 0.011 - 0.017 | 0.005 - 0.019 |
| Inferred schema | 0.000 [0.000, 0.000] | 0.004 [0.004, 0.005] | 0.048 [0.044, 0.051] | 0.000 [0.000, 0.001] | 0.000 [0.000, 0.001] |
| Clean batches with any alarm: calibrated distances | 0.07 - 0.14 | 0.35 - 0.49 | 0.59 - 0.79 | 0.06 - 0.11 | 0.01 - 0.06 |
| Clean batches with any alarm: inferred schema | 0.000 [0.000, 0.004] | 0.192 [0.169, 0.218] | 0.402 [0.372, 0.433] | 0.000 [0.000, 0.004] | 0.000 [0.000, 0.004] |
p < 0.05is a per-feature promise. With 12 features chi-square flags 44% of clean Covertype batches [0.41, 0.47]; with 46 features it flags 83% of clean News batches [0.80, 0.85].- On data that is not i.i.d. the p-values are simply wrong: more than half of all clean features
alarm on the autocorrelated series, and 92 - 98% on Beijing, where
PSI > 0.2fires on 69% as well. - A fixed
L-inflimit only fits one batch size:0.01fires on 93% of clean News features at 1,000 rows and on none at 100,000. - Calibration works on i.i.d. data and does not carry across years. The 1% target is met within 0.9 - 1.7% on the three i.i.d. datasets. On Beijing, thresholds from one year applied to the next give 7.5 - 10.2% at 10,000 rows (1.9 - 3.3% at 1,000).
- Many features multiply alarms. Even at about 1% per feature, a third to a half of clean News batches raise at least one alarm.
- An inferred schema is not free either. It never alarms on clean Covertype or synthetic data, but it rejects 19% of clean News batches and 40% of clean Beijing batches: ranges learned from the past are exceeded by new extremes, and sensors go silent. The schema here is the default inference, never edited by hand.
2. Which check finds which fault (Covertype, 10,000 rows per batch)
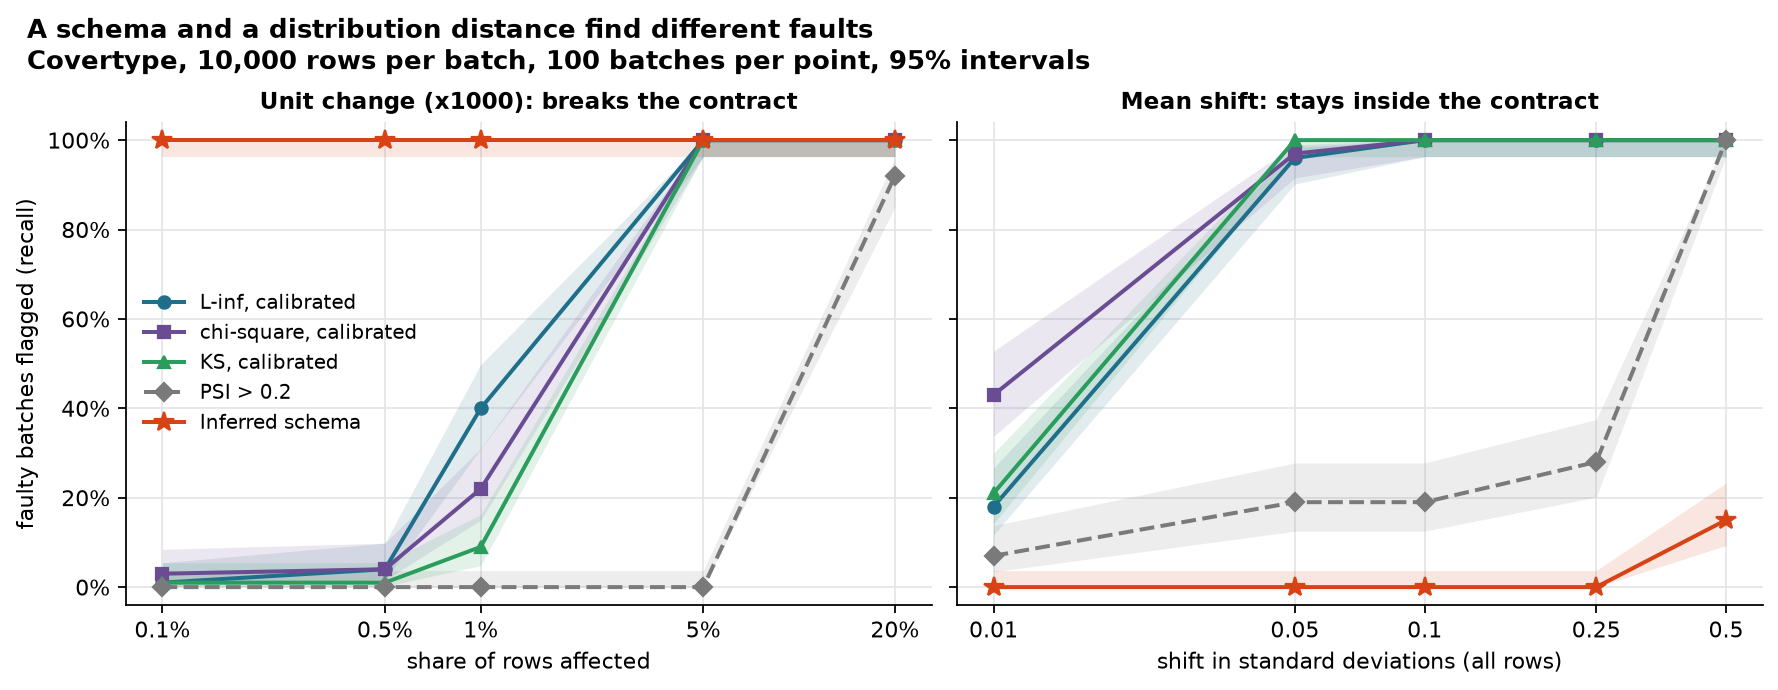
The five distances are calibrated to a 1% false-positive target (achieved: 0.9 - 1.3% per feature).
Recall = share of 100 faulty batches flagged on the faulted feature. PSI > 0.2 and the inferred
schema need no calibration; on this dataset neither raised a single false alarm. Last column: loss of
accuracy of a gradient-boosting model (clean accuracy 0.832) when the same fault hits held-out data,
in percentage points.
| Fault | Rows affected | L-inf |
L1 |
KL | chi-square | KS | PSI > 0.2 |
Schema | Accuracy loss (pp) |
|---|---|---|---|---|---|---|---|---|---|
| New category | 0.1% | 0.01 | 0.04 | 0.86 | 1.00 | n/a | 0.00 | 1.00 | +0.00 [+0.00, +0.01] |
| New category | 1% | 0.05 | 0.20 | 1.00 | 1.00 | n/a | 0.00 | 1.00 | +0.05 [+0.04, +0.06] |
| Missing values | 0.1% | 0.01 | 0.02 | 0.99 | 1.00 | 0.00 | 0.00 | 1.00 | +0.00 [+0.00, +0.01] |
| Missing values | 20% | 1.00 | 1.00 | 1.00 | 1.00 | 0.02 | 1.00 | 1.00 | +0.98 [+0.73, +1.27] |
| Number stored as text | 20% | 1.00 | 1.00 | 1.00 | 1.00 | 0.00 | 1.00 | 1.00 | +0.98 [+0.69, +1.31] |
Pinned to -1 |
1% | 0.41 | 0.19 | 0.34 | 0.34 | 0.14 | 0.00 | 0.93 | +0.11 [+0.09, +0.14] |
Pinned to -1 |
5% | 1.00 | 1.00 | 1.00 | 1.00 | 1.00 | 0.18 | 0.94 | +0.70 [+0.57, +0.84] |
| Unit change (x1000) | 0.1% | 0.01 | 0.02 | 0.02 | 0.03 | 0.01 | 0.00 | 1.00 | +0.02 [+0.02, +0.03] |
| Unit change (x1000) | 1% | 0.40 | 0.13 | 0.24 | 0.22 | 0.09 | 0.00 | 1.00 | +0.21 [+0.18, +0.24] |
| Unit change (x1000) | 5% | 1.00 | 1.00 | 1.00 | 1.00 | 1.00 | 0.00 | 1.00 | +1.09 [+0.95, +1.23] |
| Out-of-range values | 1% | 0.48 | 0.11 | 0.16 | 0.16 | 0.11 | 0.00 | 1.00 | +0.22 [+0.18, +0.25] |
| Mean shift, 0.05 sigma | all | 0.96 | 0.96 | 0.98 | 0.97 | 1.00 | 0.19 | 0.00 | +0.16 [+0.11, +0.20] |
| Dropped column | all | n/a | n/a | n/a | n/a | n/a | n/a | 1.00 | +5.55 [+4.22, +7.03] |
| Tiny noise (control) | 0.01% | 0.01 | 0.00 | 0.00 | 0.01 | 0.00 | 0.00 | 0.00 | +0.00 [+0.00, +0.00] |
With 100 batches per cell a recall of 0.50 has an interval of about +/- 0.10; differences of a few points between two rules are not established.
- The schema finds what breaks the contract, at any dose. A unit change, an out-of-range value, a new category or a missing value in 0.1% of the rows is flagged in every batch. The distances need about 5% of the rows for the same faults.
- The schema is blind to everything that stays legal. A mean shift of 0.05 sigma is found by every distance (0.96 - 1.00) and by the schema never. A sentinel that lies inside the allowed range is missed too (0.93, not 1.00: one feature has negative values).
- No single distance wins. For a value the reference has never seen, chi-square and KL catch 0.1%
of the rows and
L-infneeds 5%. For mass that moves into one place (1% of the rows pinned, rescaled or out of range)L-infhas the highest recall of the distances, 0.40 - 0.48 against 0.16 - 0.34 for KL and chi-square; for the sentinel that gap is inside the interval. - KS cannot see missing values or a changed type (recall at most 0.02), because it compares only the numbers that are left.
PSI > 0.2is quiet for the wrong reason. It misses a unit change in 5% of the rows in all 100 batches, a fault that costs the model 1.09 points of accuracy [0.95, 1.23].- Some alarms do not matter. 0.1% missing values are flagged in every batch and cost the model nothing measurable.
3. Real data that changes with the seasons (Beijing, 1,000 rows per batch)
A batch of 1,000 rows is three and a half days of air-quality readings. "Best distance" is the highest recall of any of the seven calibrated distances. Their achieved false-alarm rate per feature is 1.9 - 3.3% with the static reference and 1.4 - 2.1% with the rolling one; the schema's is 3.8%.
| Fault | Rows affected | Best distance, static reference | Best distance, rolling reference | Schema | Accuracy loss (pp) |
|---|---|---|---|---|---|
| Unit change (x1000) | 20% | 0.02 | 0.02 | 1.00 | +0.37 [+0.22, +0.52] |
| Number stored as text | 20% | 0.59 | 0.34 | 1.00 | +0.10 [+0.06, +0.15] |
| New category | 1% | 0.55 | 0.04 | 1.00 | +0.00 [-0.00, +0.00] |
| Missing values | 20% | 0.58 | 0.41 | 1.00 | +0.08 [+0.04, +0.12] |
Pinned to -1 |
20% | 0.28 | 0.33 | 0.86 | +0.31 [+0.18, +0.46] |
| Out-of-range values | 20% | 0.08 | 0.07 | 0.31 | +0.33 [+0.21, +0.46] |
| Mean shift, 0.5 sigma | all | 0.28 | 0.41 | 0.04 | +0.97 [+0.53, +1.48] |
| Feature shifted 10 hours into the future | all | 0.10 | 0.07 | 0.01 | +0.95 [+0.57, +1.37] |
| Tiny noise (control) | 0.01% | 0.02 | 0.02 | 0.03 | +0.00 [+0.00, +0.00] |
- Distribution distances are nearly blind here. A unit change in every fifth row is flagged in 2 of 100 batches. Three days of weather never look like the reference year, so the calibrated thresholds are wider than the fault.
- The rolling reference did not help. I expected it to. Comparing each batch with the 17 days before it lowers the false-alarm rate a little and leaves recall where it was. On synthetic data with a smooth seasonal cycle the same code raises recall from at most 0.6 to at least 0.9 (this is a test in the suite); real weather changes faster than any window that is long enough to estimate a distribution.
- The schema carries the load, at a price. It flags a unit change, a type change and a new category in every batch, and it also rejects 32% of clean batches [0.29, 0.35].
- The two faults that hurt the model most are seen by nothing. A mean shift of half a standard deviation and a 10-hour time shift each cost about one point of accuracy; the best distance flags 41% and 10% of the batches, the schema 4% and 1%. On this kind of data that is an open problem, not a solved one.
4. The blind spot of every single-table check: time travel
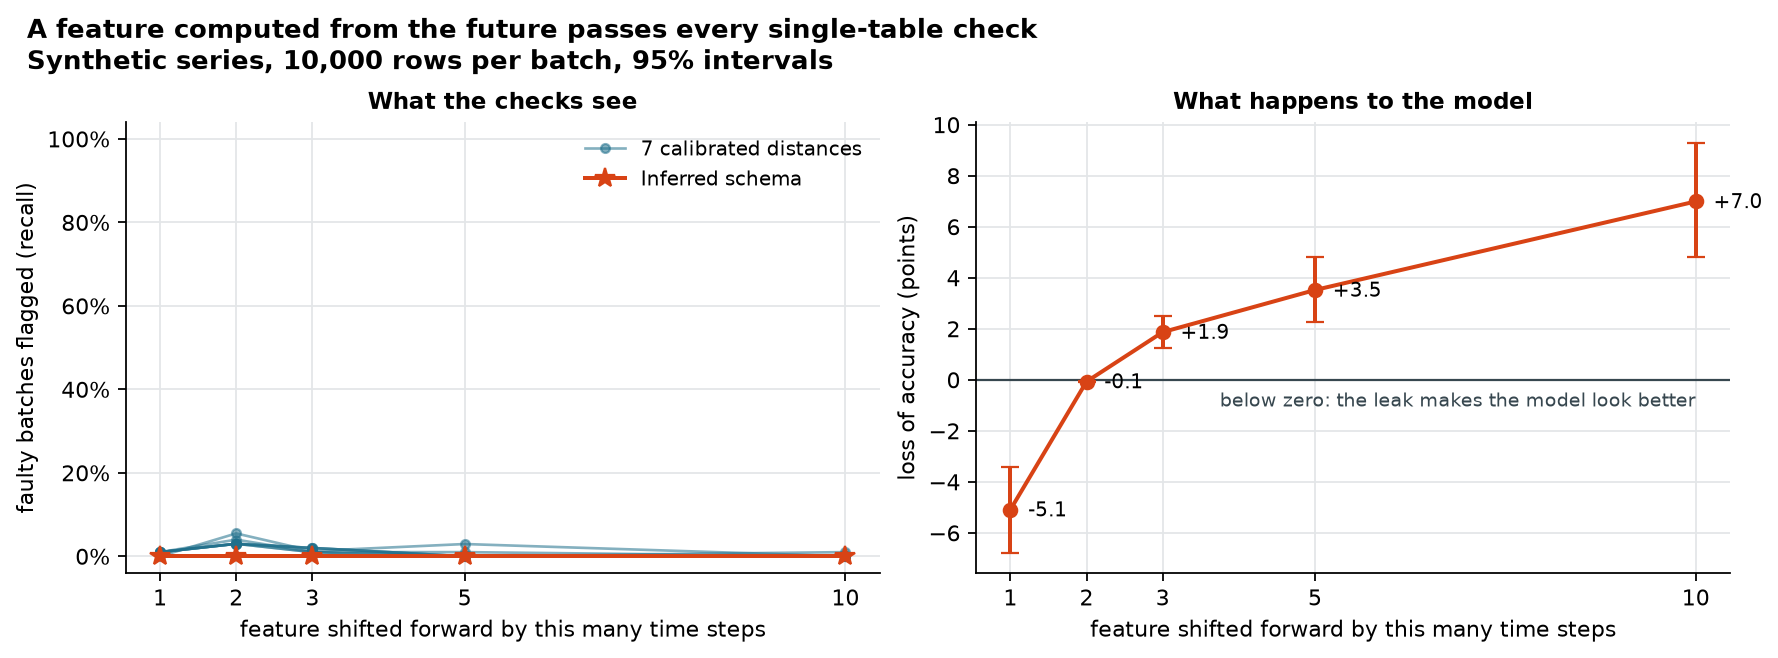
Shifting a feature forward in time (time_travel) leaves its distribution almost unchanged. On the
synthetic series the best distance flags 1 - 5% of the faulty batches over five shift lengths and two
batch sizes, which is its false-alarm level, while the model's accuracy moves by -5.1 points
[-6.8, -3.4] (shift 1: the leak makes the model look better) to +7.0 points [+4.8, +9.3]
(shift 10). On Beijing the picture is the same at a smaller scale: recall 0.01 - 0.17 at the level of
the false alarms, accuracy change from -0.10 [-0.17, -0.04] to +0.95 [+0.57, +1.37] points. The schema
does not see it either. What does is a row-by-row comparison of training and serving features
(mlguard skew): in a test on the same fault it flags 1,999 of 2,000 rows. It needs both versions of
the same rows, which is why it is not a column of the tables above.
How to read these numbers (limits)
- Sample size matters more than the choice of distance. On the synthetic table a unit change in
1% of the rows is found by
L-infin 1% of the batches at 1,000 rows, 24% at 10,000 and 99% at 100,000. The schema finds it in every batch at every size. - Features with point masses inflate recall for tiny shifts. A mean shift of 0.01 sigma on
Covertype is flagged by KL in 51% of the batches, but that comes from features recorded on a coarse
grid (the two distance-to-water features:
L-inf17 of 17), where any shift moves values off the grid; on the other eight numeric featuresL-infflags 1 of 83. On News the same shift is flagged in 70% of the batches at 1,000 rows: 28 of the 41 faulted features were flagged every time and 11 never. The per-feature counts are in the JSON files (by_feature). - The schema rule is the default inference, unedited. A schema maintained by hand would raise fewer false alarms and might find less; that trade-off was not measured.
- The out-of-range fault is relative to the batch. Its values lie above the batch maximum, which on Beijing is often still inside the yearly range. That is why the schema finds only 31% there.
- The model on News is weak (accuracy 0.675) and no fault moves it by more than 0.2 points, so the conclusions about model impact rest on Covertype and Beijing.
- Duplicated rows are only seen as extra sampling noise: recall stays near the batch-level false-alarm rate until 20% of the rows are duplicates, and the model is not affected.
- Faults are synthetic and injected one at a time; one model family, accuracy only; all runs were made on one machine. Repeating the Covertype and synthetic runs after a refactoring reproduced every unchanged number exactly.
What it does
Measure (the benchmark, results above):
mlguard.distances,mlguard.detectors:L-inf,L1, KL, JS, PSI, chi-square and KS per feature, with bins and vocabularies taken from the reference data only.mlguard.inject: twelve seeded fault injectors with documented severity units.mlguard.bench: thresholds calibrated on a separate split, faults injected into evaluation batches only, a model scored on a held-out split; fixed "textbook" rules and the schema validator are measured next to the calibrated distances; static or rolling reference.
Use (the library and the mlguard command):
- Schema.
mlguard inferreads reference data and writes a small JSON schema: type, share of rows that must have a value, numeric range, allowed categories. It holds statistics, never rows; category values can be stored hashed or left out. - Validation.
mlguard validatechecks one batch against the schema and explains each finding with the observed number, the limit and a suggested schema change. It catches a dropped column, a changed type, new categories, out-of-range values and missing values. - Distribution shift.
mlguard comparemeasures the distance of a batch to the reference and calibrates the limit on the reference for the size of that batch, because the benchmark showed that a fixed limit is only right for one batch size. - Training/serving skew.
mlguard skewjoins two logs on a key and compares the same feature of the same row. This is the check that finds a feature computed with future information, the blind spot of every distribution check above. - Model unit test.
run_model_testfeeds rows that the schema allows, including its edges, to your feature or prediction code and returns a single synthetic row that breaks it.
Every command exits with 0 (clean), 1 (anomaly) or 2 (unreadable input), and prints text or JSON, so it can be a CI step. Cell values are not printed unless asked for.
Not in scope: repairing data, streaming validation, text or image data, a web interface.
Install
pip install ml-data-guard            # the library and the mlguard command
pip install "ml-data-guard[bench]"   # adds scikit-learn for the model-impact part of the benchmark
As a step in GitHub Actions, failing the job on any anomaly:
- uses: slastrzelec/ml-data-guard@v0.1.0
  with:
    batch: data/batch.csv
    schema: schema.json
    reference: data/reference.csv   # optional: also check for distribution shift
The action is run in this repository's CI on a clean and on a broken example batch, and must reject the broken one.
Quick start (from source)
git clone https://github.com/slastrzelec/ml-data-guard.git
cd ml-data-guard
python -m venv .venv && source .venv/bin/activate   # Windows: .venv\Scripts\activate
pip install -e ".[dev]"
pytest
A five-minute tour on synthetic data, with the expected exit code of every command, is in
examples/README.md. In short:
python examples/make_example_data.py
mlguard infer examples/data/reference.csv -o examples/data/schema.json --exclude id,target
mlguard validate examples/data/batch_broken.csv --schema examples/data/schema.json
ERROR   x_normal: OUT_OF_RANGE - 197 of 2000 rows (9.85%) are outside [1.6879, 94.6904]; observed range [19.1831, 85724.5]
        suggestion: widen the range of 'x_normal' to [19.1831, 85724.5], or raise max_out_of_range_fraction to 0.0985
ERROR   x_zero_inflated: MISSING_FEATURE - the column is missing from the batch
        suggestion: restore the column, or mark 'x_zero_inflated' as deprecated
ERROR   c_small: UNEXPECTED_VALUES - 100 of 2000 rows (5.00%) hold 1 distinct value(s) not in the domain
        suggestion: add the new value(s) to the domain of 'c_small', or raise max_unexpected_fraction to 0.05
validate: 3 error(s), 0 warning(s)
Reproducing the benchmark: benchmarks/README.md.
Testing
The tests need no network, no API key and no data download. ruff, pytest with a coverage
threshold and pip-audit run on Python 3.11 and 3.12 in GitHub Actions.
What is verified
- Distances: hand-computed values; agreement with SciPy as an independent oracle (KL, JS,
chi-square, KS); property-based checks of identity, symmetry, bounds,
L-inf <= L1 / 2, Pinsker's inequality and the data-processing inequality (merging categories never increases a distance). - Binning: every row is counted exactly once; unseen categories, missing values and values outside the reference range each have a bucket; edges do not depend on the batch under test.
- Fault injectors: for every fault and feature type, property-based checks that the input is
not modified, the same seed gives the same output, zero severity returns an equal copy, a positive
severity changes at least one row, and the changes at a small severity are a subset of those at a
larger one; plus the meaning of each fault (exact fraction of rows, mean moved by exactly
severitystandard deviations, time travel reads only future rows and never crosses a group). - Evaluation leakage: the four splits are disjoint and complete; thresholds and reference statistics stay identical when the evaluation and held-out rows are replaced by garbage; the model is trained on the reference split only.
- Benchmark results: the same config gives a byte-identical JSON file; clean batches and the tiny-noise control stay near the calibrated false-positive rate; strong faults are found; a time shift changes the model's accuracy while the distribution distances stay silent (the expected blind spot); duplicated rows keep their labels; a rolling reference never contains the batch it is compared with and beats a static one on synthetic seasonal data; a feature that is constant in a batch is not chosen for a fault that cannot change it.
- Data loaders: each of the three public datasets is read through a loader that validates the layout of the file and is tested on a small hand-made archive of the same format; the raw target never becomes a feature, and the lag features of the air-quality data use past hours only.
- Schema: an inferred schema accepts its own reference data; the tolerance for missing values accepts fresh samples; JSON round trip; with hashed or omitted domains no category value appears in the schema file or in a report.
- Validator: every anomaly type is raised by a minimal example and not on clean data. Against the injectors it catches six of the twelve faults (dropped column, type change, new category, out-of-range values, unit change, missing values); the other six stay inside the schema and are asserted to be missed, so the limit is documented by a test.
- Comparison and skew: the limit a batch is compared with does not depend on that batch; clean batches rarely alarm and shifted ones do; the skew check flags a time shift in 1,999 of 2,000 rows where the distribution check reports nothing.
- Model unit test: generated rows satisfy the schema and reach its edges; a function with a hidden assumption fails and the returned row reproduces the failure on its own.
- Release and action: the version in the package, the action and the example workflow is the same; inputs reach shell commands only through environment variables (no script injection); only the publishing job can request an identity token and no credential is stored; every external action is pinned to a version; the README shown on PyPI has no relative link or image. The action itself runs in CI: it passes a clean batch and must reject a broken one.
- Command line: exit codes 0 / 1 / 2, the shape of the JSON output, and the walk-through in
examples/README.md, which is executed command by command. - Results explorer: every cell of every published result file appears in the page with the same rate and interval; a cell that was not scored stays empty instead of becoming zero; the tracked page is exactly what the build produces, so a stale page fails the suite; the page references no external resource, uses no browser storage and writes no markup from data; feature names, thresholds and file paths are left out.
- Figures: the three figures are drawn by
tools/make_figures.pyfrom the result files; the functions that pick the numbers are tested (right run, right fault, increasing dose, unscored cells left out, sign and unit of the accuracy loss). - Failure handling: unnormalised, negative, non-finite, empty or misaligned input, unknown config keys and damaged data files raise an error instead of returning a plausible number.
- Security and hygiene: no socket can be opened during tests; no data, secret or large file is
tracked; the package imports no
pickle-like or network module and calls noeval/exec.
How the tests were checked: python tools/mutation_check.py re-introduces known bugs one at a
time (for example L-inf returning a sum, an injector that ignores the seed, thresholds calibrated on
the evaluation split, a silenced anomaly type, category values printed by default, exit code 0
despite anomalies) and requires the suite to fail for each of the 95 mutants. The list is hand-written and targeted; it
is not exhaustive mutation testing.
Not covered
- The published numbers themselves: tests cover the code on small synthetic runs; the full runs were made on one machine.
- The loaders on the real files: CI has no network, so they are tested on hand-made archives of the same format; on the real files they were run locally. The download script is not tested (it is the only code that uses the network).
- Whether the synthetic faults resemble real incidents: they are simplified, documented models.
- pandas nullable (
Int64,boolean) and Arrow-backed dtypes; Parquet input (it needspyarrow, which is not installed in CI). - Large inputs: validation and skew comparison loop over cells in Python and were only run on tables of up to 20,000 rows.
- The release workflow itself: it runs only when a version tag is pushed, so a broken release
job shows up at release time, not in CI. The package build,
twine checkand an install of the wheel in a clean environment were run locally before the first release. - The drawing of the figures: matplotlib is not installed in CI, so nothing checks that the tracked images match the current result files. They were regenerated and inspected by hand.
- How the explorer renders: there is no JavaScript test in CI. It was opened once in headless Chromium at two widths, stepping through all 559 combinations without a script error or a network request; other browsers were not checked.
- Numerical behaviour on vectors with more than a few dozen categories or with probabilities
below
1e-12.
Limitations
- Inferred schemas are loose on purpose and still not safe from false alarms: a heavy-tailed feature will sooner or later exceed an inferred range. The anomaly then proposes the new range; accepting it is a human decision.
- Hashing a domain keeps values out of files and reports but does not protect short or guessable
values against a dictionary attack. Use
--domains nonefor personal data. - CSV has no types: a numeric column with one text cell is read as text and reported as a type mismatch for every row.
- Calibrating
comparetakes a few seconds and uses half of the reference data for the statistics.
Roadmap
- A drift check that works on non-stationary data (section 3 of the results shows that the current ones do not): compare with the same season of earlier years, or model the series.
- Measure a hand-maintained schema against the inferred one.
- Vectorise validation and the skew check for tables with millions of rows.
License
MIT - see LICENSE. Datasets and their licences: data/README.md.
Author
1 maintainer

Metadata
1 maintainer
Release files for ml-data-guard 0.1.0
For a detailed explanation of source distributions (sdists) and built distributions (wheels), please see the package formats documentation.
Source distribution (sdist)
| File | Size | Uploaded | Provenance | |
|---|---|---|---|---|
| ml_data_guard-0.1.0.tar.gz | 79.8 kB | With provenance | Details |
Built distribution (wheel)
| File | Interpreter | ABI | Platform | Reset |
|---|---|---|---|---|
| ml_data_guard-0.1.0-py3-none-any.whl | Python 3 | none | any | Details |
Total release size: 140.7 kB
Release files / ml_data_guard-0.1.0.tar.gz
| Download URL | ml_data_guard-0.1.0.tar.gz |
|---|---|
| Size | 79.8 kB |
| Tags | Source |
|
SHA-256 checksum How to use checksums |
ce4de75e5b9fe27839256d364e2671dbf1213d29527343ea8218fbd1a45fbc14
|
|
BLAKE2b-256 checksum How to use checksums |
904ba910222038301ab5c37f926a0914cc62b69aee892e92dafa57216cc0eff1
|
| Upload date | |
|
Uploaded using Trusted Publishing? What is trusted publishing? |
Yes |
| Uploaded via |
twine/7.0.0 CPython/3.13.14
|
Provenance
Provenance describes where a file came from. On PyPI, provenance is shared via attestations, which provide a verifiable record of the build or publishing details. View details, limitations and caveats.


PyPI Publish Attestation
PyPI verified that this artifact, at this checksum, originated from the publisher listed below.
Signed by GitHub Actions, verified by PyPI on Oct 14, 2026.
Transparency logRelease files / ml_data_guard-0.1.0-py3-none-any.whl
| Download URL | ml_data_guard-0.1.0-py3-none-any.whl |
|---|---|
| Size | 60.9 kB |
| Tags | Python 3 |
|
SHA-256 checksum How to use checksums |
42c75e4c76b5b79de9a7b6f42c0fd4d96b590c5635758cd086f2e25b7282b833
|
|
BLAKE2b-256 checksum How to use checksums |
e1eacf5b0f13f18bce5c5db43286c6ea5420050ffef15a03b6b47302187ce574
|
| Upload date | |
|
Uploaded using Trusted Publishing? What is trusted publishing? |
Yes |
| Uploaded via |
twine/7.0.0 CPython/3.13.14
|
Provenance
Provenance describes where a file came from. On PyPI, provenance is shared via attestations, which provide a verifiable record of the build or publishing details. View details, limitations and caveats.
PyPI Publish Attestation
PyPI verified that this artifact, at this checksum, originated from the publisher listed below.
Signed by GitHub Actions, verified by PyPI on Oct 14, 2026.
Transparency logSecurity for ml-data-guard 0.1.0
Provenance
Provenance describes where a file came from. On PyPI, provenance is shared via attestations, which provide a verifiable record of the build or publishing details. View details, limitations and caveats.
Full provenance
All 2 files in this release have been uploaded with provenance metadata.
Attestation for ml_data_guard-0.1.0.tar.gz
PyPI Publish Attestation
PyPI verified that this artifact, at this checksum, originated from the publisher listed below.
Signed by GitHub Actions, verified by PyPI on Oct 14, 2026.
Transparency logA note on package security
PyPI is a repository for distributing packages, not a service for auditing them. While third-party security researchers and our staff do their best to detect and remove malicious packages, PyPI cannot guarantee the quality, security or suitability of any given package.
To learn more about protecting yourself from malicious actors, visit our package security documentation.














