Streamlit dashboard for monitoring data drift and model metrics.

Project description
ml-drift-detection 📈🔍
A Streamlit dashboard for visual monitoring of machine learning data drift and model performance metrics.


Overview
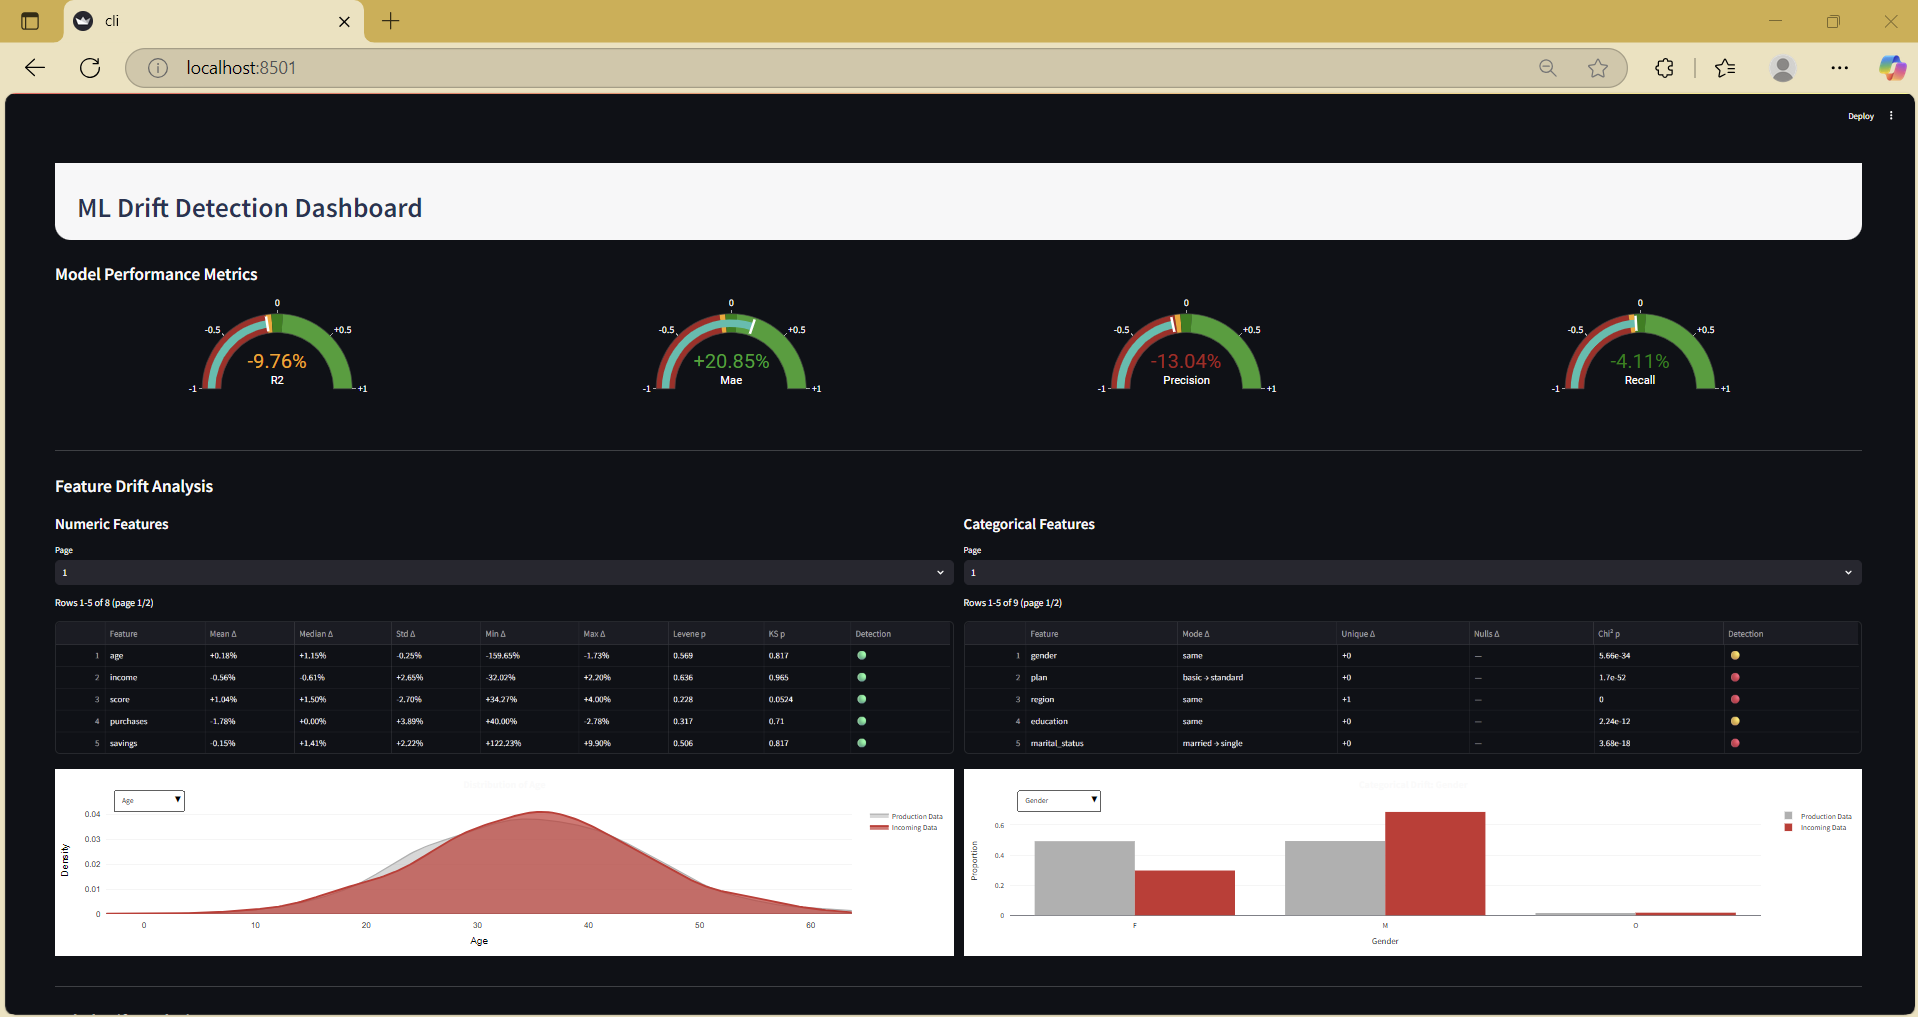
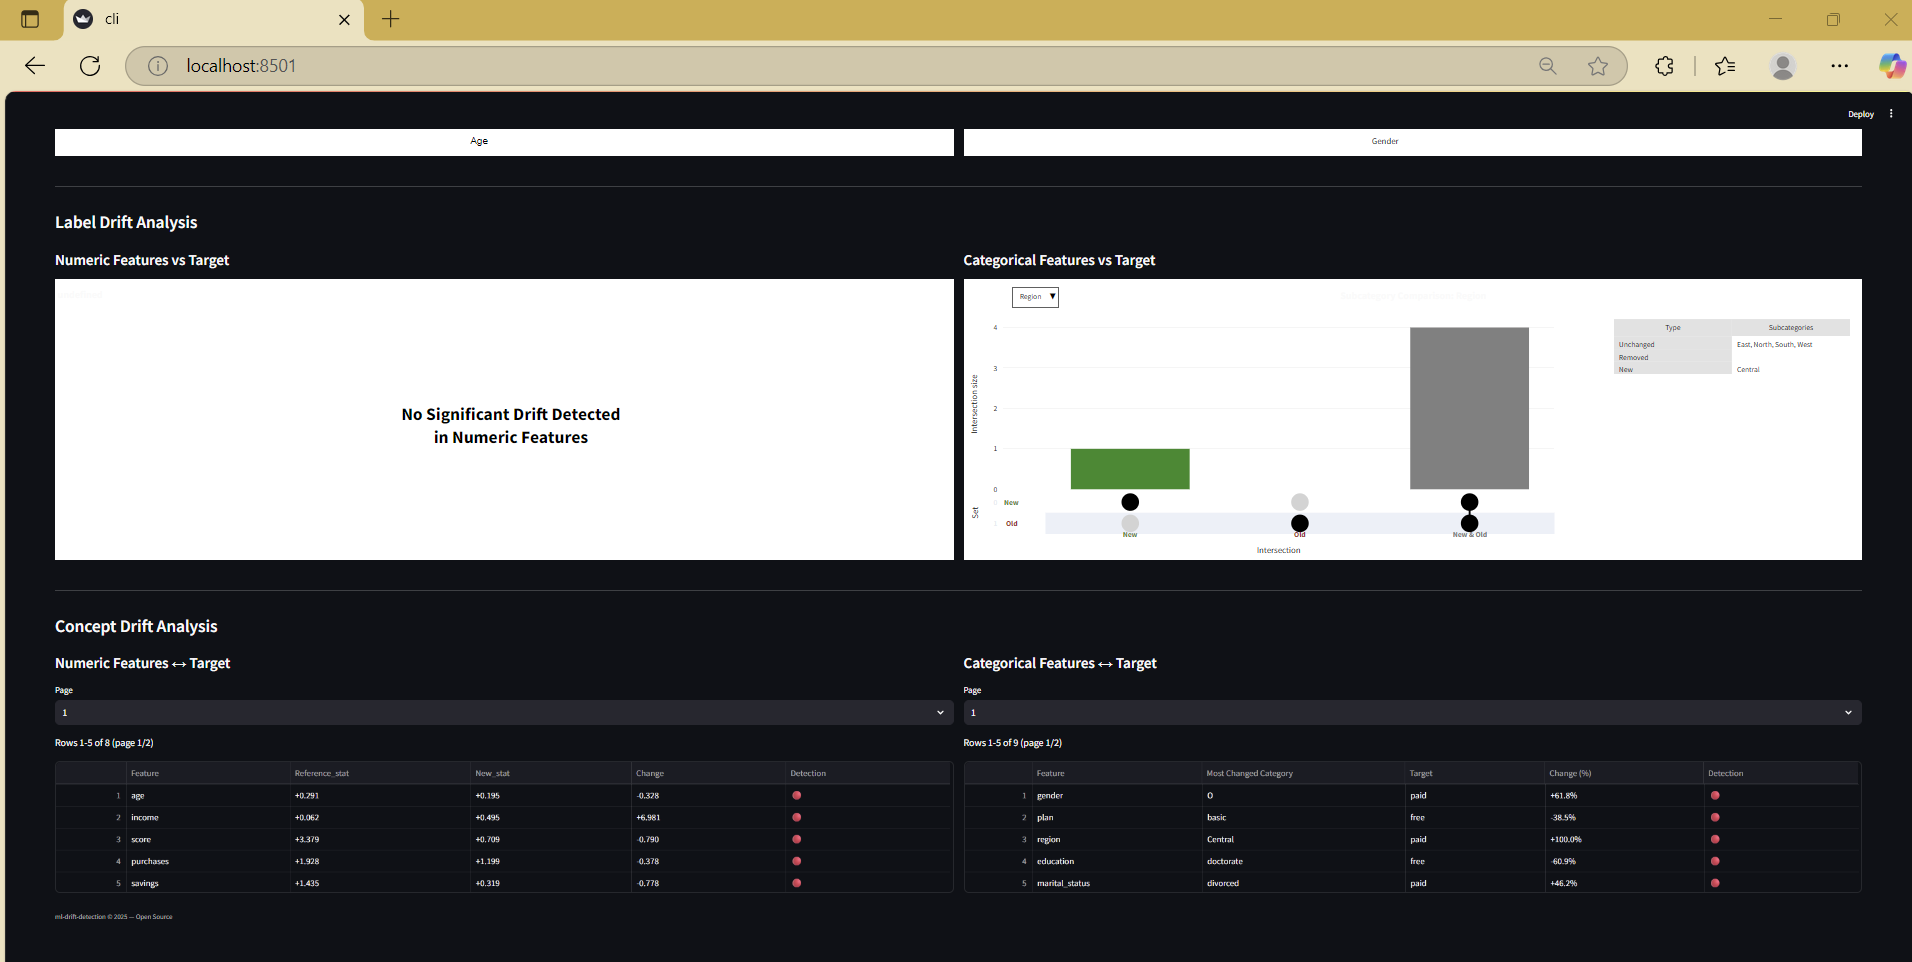
ml-drift-detection provides an instant, interactive dashboard to compare two datasets (e.g., baseline/reference vs. new/production data) for feature drift, label drift, and concept drift, alongside the latest model performance metrics.
- Visualizes drift in both numeric and categorical features
- Highlights changes in model evaluation metrics
- Supports light and dark dashboard themes
- Usable as a command-line tool or Python library
Installation
pip install ml-drift-detection
Requires Python ≥ 3.9.
Usage
1. Command-Line Interface (CLI)
Run the dashboard using Streamlit, providing your datasets and settings as arguments:
streamlit run -m ml_drift_detection.cli -- \
  --prod-data=PATH_TO_REFERENCE_DATA \
  --new-data=PATH_TO_NEW_DATA \
  --numeric-cols=NUMERIC_COLUMN_NAMES \
  --categorical-cols=CATEGORICAL_COLUMN_NAMES \
  --target-variable=TARGET_COLUMN_NAME \
  --target-type=TARGET_TYPE \
  --prod-metrics=PRODUCTION_METRICS \
  --new-metrics=NEW_METRICS
Argument descriptions
| Argument | Description |
|---|---|
--prod-data |
Path to your reference or baseline dataset (CSV or Excel file) |
--new-data |
Path to your new or current dataset (CSV or Excel file) |
--numeric-cols |
Comma-separated list of numeric feature column names |
--categorical-cols |
Comma-separated list of categorical feature column names |
--target-variable |
Name of the target column (label or outcome) |
--target-type |
Type of target variable: either categorical (classification) or continuous (regression) |
--prod-metrics |
Comma-separated list of metric_name=value pairs for reference data performance |
--new-metrics |
Comma-separated list of metric_name=value pairs for new data performance |
Optional arguments
| Argument | Description | Default |
|---|---|---|
--background-color |
Dashboard background color: "white" or "#0E1117" for dark mode |
"white" |
--metric-one-threshold-steps |
JSON or Python list for custom gauge bands (Metric 1); defaults used if omitted | See below |
--metric-two-threshold-steps |
Custom gauge bands for Metric 2 (same format) | Defaults |
--metric-three-threshold-steps |
Custom gauge bands for Metric 3 | Defaults |
--metric-four-threshold-steps |
Custom gauge bands for Metric 4 | Defaults |
Default gauge colour bands
Unless customized, all metrics use these relative change bands:
| Range (relative change) | Gauge color |
|---|---|
| -1.0 to -0.10 | firebrick |
| -0.10 to -0.05 | orange |
| -0.05 to 0.05 | green |
| 0.05 to 1.0 | #2ca02c |
Custom bands can be provided as JSON/Python lists (see documentation).
2. Library Usage
You can also use the dashboard as part of a Python workflow:
import pandas as pd
from ml_drift_detection import dashboard_main

reference_df = pd.read_csv("PATH_TO_REFERENCE_DATA")
current_df = pd.read_csv("PATH_TO_NEW_DATA")

dashboard_main(
    prod_df=reference_df,
    new_df=current_df,
    numeric_cols=[...],          # List of your numeric feature names
    categorical_cols=[...],      # List of your categorical feature names
    target_variable="...",       # Your target column name
    target_type="...",           # "categorical" or "continuous"
    prod_metrics={...},          # Dict of production metrics
    new_metrics={...},           # Dict of new metrics
    # Optional: background_color, metric_x_threshold_steps
)
All arguments follow the same meaning as in the CLI.
Public API
| Symbol | Description |
|---|---|
ml_drift_detection.cli_main |
CLI entry point for Streamlit |
ml_drift_detection.dashboard_main |
Programmatic dashboard launcher |
get_plotly_dist |
Helper: numeric KDE distribution plot |
get_plotly_boxplot |
Helper: numeric boxplot plot |
get_plotly_barplot |
Helper: categorical barplot plot |
Example
Below is a sample CLI invocation and Python snippet using generic variable names—replace the file names and column names with your actual project details:
CLI Example
streamlit run -m ml_drift_detection.cli -- \
  --prod-data=reference_data.csv \
  --new-data=current_data.csv \
  --numeric-cols=feature1,feature2,feature3 \
  --categorical-cols=category1,category2 \
  --target-variable=target_column \
  --target-type=categorical \
  --prod-metrics=metricA=0.91,metricB=0.88 \
  --new-metrics=metricA=0.83,metricB=0.79 \
  --background-color="#0E1117"
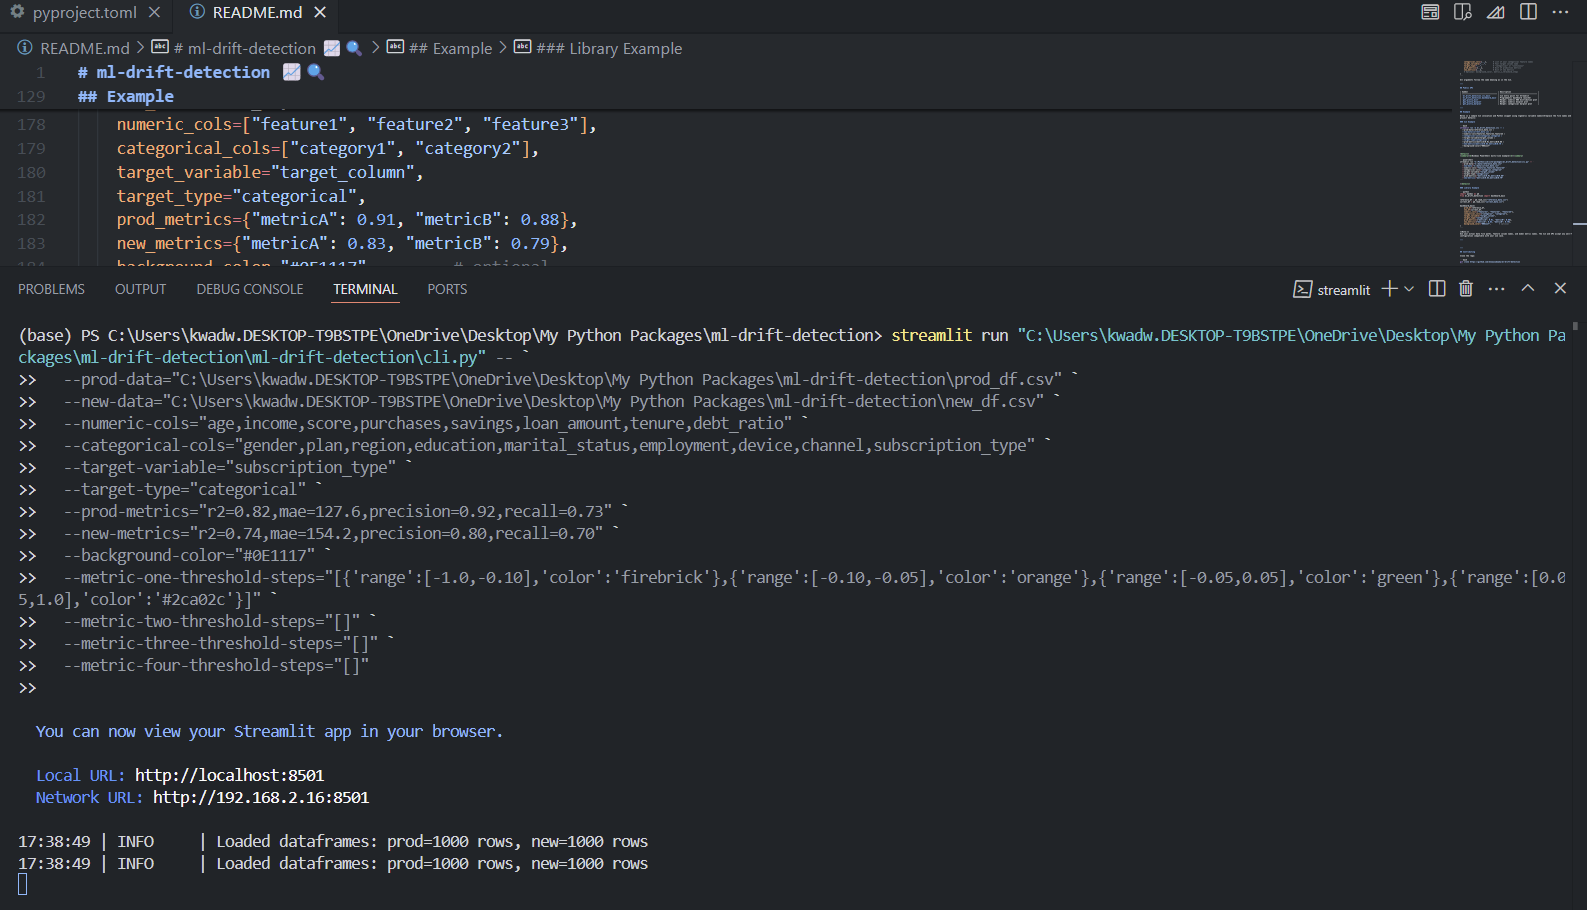
Windows PowerShell multi-line example
streamlit run "C:\Python\Lib\site-packages\ml_drift_detection\cli.py" -- `
  --prod-data="C:\data\reference_data.csv" `
  --new-data="C:\data\current_data.csv" `
  --numeric-cols="feature1,feature2,feature3" `
  --categorical-cols="category1,category2" `
  --target-variable="target_column" `
  --target-type="categorical" `
  --prod-metrics="metricA=0.91,metricB=0.88" `
  --new-metrics="metricA=0.83,metricB=0.79"
Library Example
import pandas as pd
from ml_drift_detection import dashboard_main

reference_df = pd.read_csv("reference_data.csv")
current_df = pd.read_csv("current_data.csv")

dashboard_main(
    prod_df=reference_df,
    new_df=current_df,
    numeric_cols=["feature1", "feature2", "feature3"],
    categorical_cols=["category1", "category2"],
    target_variable="target_column",
    target_type="categorical",
    prod_metrics={"metricA": 0.91, "metricB": 0.88},
    new_metrics={"metricA": 0.83, "metricB": 0.79},
    background_color="#0E1117",        # optional
)
Note: Use your actual data file paths, feature column names, and model metric names. The CLI and API accept any well-formed data file and column configuration compatible with your use case.
Contributing
Clone the repo:
git clone https://github.com/knowusuboaky/ml-drift-detection
Install dev dependencies:
pip install -e ".[dev,test]"
Run code quality checks:
pre-commit install
Test:
pytest
Pull requests and feature requests are welcome! Please open an issue first to discuss any major changes.
License
MIT © Kwadwo Daddy Nyame Owusu-Boakye
Release history Release notifications | RSS feed


Download files
Download the file for your platform. If you're not sure which to choose, learn more about installing packages.
Source Distribution
Built Distribution
Filter files by name, interpreter, ABI, and platform.
If you're not sure about the file name format, learn more about wheel file names.
Copy a direct link to the current filters
File details
Details for the file ml_drift_detection-0.1.1.tar.gz.
File metadata
- Download URL: ml_drift_detection-0.1.1.tar.gz
- Upload date:
- Size: 4.7 kB
- Tags: Source
- Uploaded using Trusted Publishing? No
- Uploaded via: twine/6.1.0 CPython/3.12.7
File hashes
| Algorithm | Hash digest | |
|---|---|---|
| SHA256 |
48e644603bac0fb3875ad48ca6d63874971d477ab97886a99e5c063585725011
|
|
| MD5 |
cb93ceed6806480987cc5d421bc6ea26
|
|
| BLAKE2b-256 |
e97ea2c2c284ebdf5fe3edcd71e0303560473aad72b8a7d23a68f457dd94c44f
|
File details
Details for the file ml_drift_detection-0.1.1-py3-none-any.whl.
File metadata
- Download URL: ml_drift_detection-0.1.1-py3-none-any.whl
- Upload date:
- Size: 4.5 kB
- Tags: Python 3
- Uploaded using Trusted Publishing? No
- Uploaded via: twine/6.1.0 CPython/3.12.7
File hashes
| Algorithm | Hash digest | |
|---|---|---|
| SHA256 |
690b6a81b9a0164892312b04791fce856c162cd8f743c8d15565870496d2dcfd
|
|
| MD5 |
b7c49daeaed723f3adbacc085aee5f92
|
|
| BLAKE2b-256 |
8b5c47272132e9f28bdb9560704f6f596c9a14a34539455482812e0e02ded0e4
|


