Machine Learning Experiment Resource Monitoring

Project description
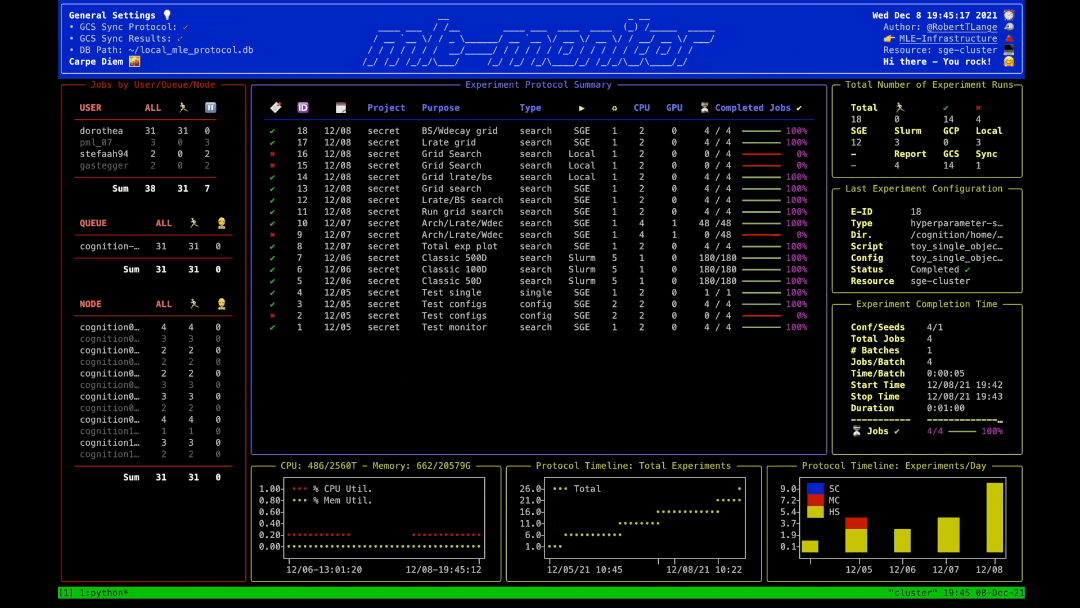
Lightweight Experiment & Resource Monitoring 📺


"Did I already run this experiment before? How many resources are currently available on my cluster?" If these are common questions you encounter during your daily life as a researcher, then mle-monitor is made for you. It provides a lightweight API for tracking your experiments using a pickle protocol database (e.g. for hyperparameter searches and/or multi-configuration/multi-seed runs). Furthermore, it comes with built-in resource monitoring on Slurm/Grid Engine clusters and local machines/servers.
mle-monitor provides three core functionalities:
MLEProtocol: A composable protocol database API for ML experiments.MLEResource: A tool for obtaining server/cluster usage statistics.MLEDashboard: A dashboard visualizing resource usage & experiment protocol.
To get started I recommend checking out the colab notebook and an example workflow.
MLEProtocol: Keeping Track of Your Experiments 📝
from mle_monitor import MLEProtocol

# Load protocol database or create new one -> print summary
protocol_db = MLEProtocol("mle_protocol.db", verbose=False)
protocol_db.summary(tail=10, verbose=True)

# Draft data to store in protocol & add it to the protocol
meta_data = {
    "purpose": "Grid search",  # Purpose of experiment
    "project_name": "MNIST",  # Project name of experiment
    "experiment_type": "hyperparameter-search",  # Type of experiment
    "experiment_dir": "experiments/logs",  # Experiment directory
    "num_total_jobs": 10,  # Number of total jobs to run
    ...
}
new_experiment_id = protocol_db.add(meta_data)

# ... train your 10 (pseudo) networks/complete respective jobs
for i in range(10):
    protocol_db.update_progress_bar(new_experiment_id)

# Wrap up an experiment (store completion time, etc.)
protocol_db.complete(new_experiment_id)
The meta data can contain the following keys:
| Search Type | Description | Default |
|---|---|---|
purpose |
Purpose of experiment | 'None provided' |
project_name |
Project name of experiment | 'default' |
exec_resource |
Resource jobs are run on | 'local' |
experiment_dir |
Experiment log storage directory | 'experiments' |
experiment_type |
Type of experiment to run | 'single' |
base_fname |
Main code script to execute | 'main.py' |
config_fname |
Config file path of experiment | 'base_config.yaml' |
num_seeds |
Number of evaluations seeds | 1 |
num_total_jobs |
Number of total jobs to run | 1 |
num_job_batches |
Number of jobs in single batch | 1 |
num_jobs_per_batch |
Number of sequential job batches | 1 |
time_per_job |
Expected duration: days-hours-minutes | '00:01:00' |
num_cpus |
Number of CPUs used in job | 1 |
num_gpus |
Number of GPUs used in job | 0 |
Additionally you can synchronize the protocol with a Google Cloud Storage (GCS) bucket by providing cloud_settings. In this case also the results stored in experiment_dir will be uploaded to the GCS bucket, when you call protocol.complete().
# Define GCS settings - requires 'GOOGLE_APPLICATION_CREDENTIALS' env var.
cloud_settings = {
    "project_name": "mle-toolbox",  # GCP project name
    "bucket_name": "mle-protocol",  # GCS bucket name
    "use_protocol_sync": True,  # Whether to sync the protocol to GCS
    "use_results_storage": True,  # Whether to sync experiment_dir to GCS
}
protocol_db = MLEProtocol("mle_protocol.db", cloud_settings, verbose=True)
The MLEResource: Keeping Track of Your Resources 📉
On Your Local Machine
from mle_monitor import MLEResource

# Instantiate local resource and get usage data
resource = MLEResource(resource_name="local")
resource_data = resource.monitor()
On a Slurm Cluster
resource = MLEResource(
    resource_name="slurm-cluster",
    monitor_config={"partitions": ["<partition-1>", "<partition-2>"]},
)
On a Grid Engine Cluster
resource = MLEResource(
    resource_name="sge-cluster",
    monitor_config={"queues": ["<queue-1>", "<queue-2>"]}
)
The MLEDashboard: Dashboard Visualization 🎞️
from mle_monitor import MLEDashboard

# Instantiate dashboard with protocol and resource
dashboard = MLEDashboard(protocol, resource)

# Get a static snapshot of the protocol & resource utilisation printed in console
dashboard.snapshot()

# Run monitoring in while loop - dashboard
dashboard.live()
Installation ⏳
A PyPI installation is available via:
pip install mle-monitor
If you want to get the most recent commit, please install directly from the repository:
pip install git+https://github.com/mle-infrastructure/mle-monitor.git@main
Citing the MLE-Infrastructure ✏️
If you use mle-monitor in your research, please cite it as follows:
@software{mle_infrastructure2021github,
  author = {Robert Tjarko Lange},
  title = {{MLE-Infrastructure}: A Set of Lightweight Tools for Distributed Machine Learning Experimentation},
  url = {http://github.com/mle-infrastructure},
  year = {2021},
}
Development 👷
You can run the test suite via python -m pytest -vv tests/. If you find a bug or are missing your favourite feature, feel free to create an issue and/or start contributing 🤗.
Release history Release notifications | RSS feed


Download files
Download the file for your platform. If you're not sure which to choose, learn more about installing packages.
Source Distribution
Built Distribution
Filter files by name, interpreter, ABI, and platform.
If you're not sure about the file name format, learn more about wheel file names.
Copy a direct link to the current filters
File details
Details for the file mle_monitor-0.0.2.tar.gz.
File metadata
- Download URL: mle_monitor-0.0.2.tar.gz
- Upload date:
- Size: 30.1 kB
- Tags: Source
- Uploaded using Trusted Publishing? No
- Uploaded via: twine/4.0.2 CPython/3.11.2
File hashes
| Algorithm | Hash digest | |
|---|---|---|
| SHA256 |
95090337f1cdade121e0d4de7413c1b21aae91b916ce1de896c612cf1cafc9ed
|
|
| MD5 |
dbd570708250c80089c004d94306f118
|
|
| BLAKE2b-256 |
74b6f52c7eb9194633f093e08c4ac449b7804c2294aaf222e182ce1923072d4b
|
File details
Details for the file mle_monitor-0.0.2-py3-none-any.whl.
File metadata
- Download URL: mle_monitor-0.0.2-py3-none-any.whl
- Upload date:
- Size: 35.5 kB
- Tags: Python 3
- Uploaded using Trusted Publishing? No
- Uploaded via: twine/4.0.2 CPython/3.11.2
File hashes
| Algorithm | Hash digest | |
|---|---|---|
| SHA256 |
3b7f907d42730a9b5f191bba5b6c51fb552d20d4d0a40d38cee64a8827a91d11
|
|
| MD5 |
5fbfbef18cfbec8d84aa1472aebc45ee
|
|
| BLAKE2b-256 |
4121f941fd419f405dcbecbfe89adfe780cd3df69d6bba3baf746373940f0b93
|


