Translate ML model predictions into human-readable business explanations with visualizations.

Project description
mlxplain
Turn any ML model into a compliance-ready credit memo — in 4 lines of code.


🇺🇸 English • 🇻🇳 Tiếng Việt
🔥 What You Get
One function call. Multi-pillar professional outputs. No complex configuration needed.
💻 Standing Out: Premium HTML Risk Dossier
In addition to standard text memos and charts, mlxplain generates a fully standalone, premium glassmorphic HTML Credit Risk Dossier with inlined high-resolution vector SVGs. This provides a portable, compliance-ready interactive risk dashboard out-of-the-box!

📊 Auto-Generated Diagnostic Charts
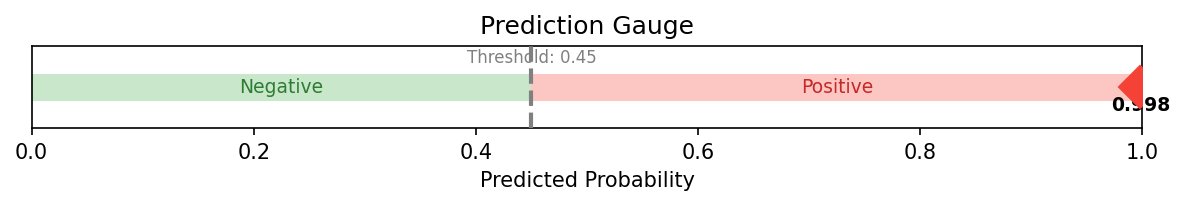
Every call to explain_risk() produces three publication-ready matplotlib figures:
| Probability Gauge See the decision at a glance |
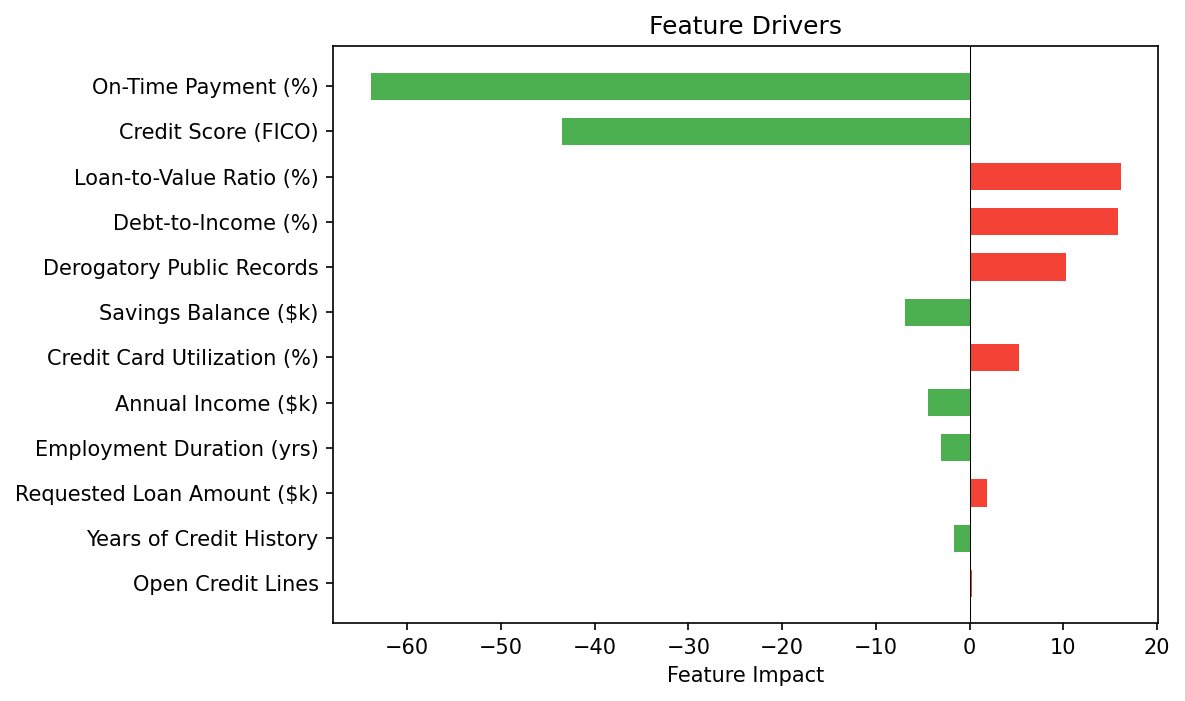
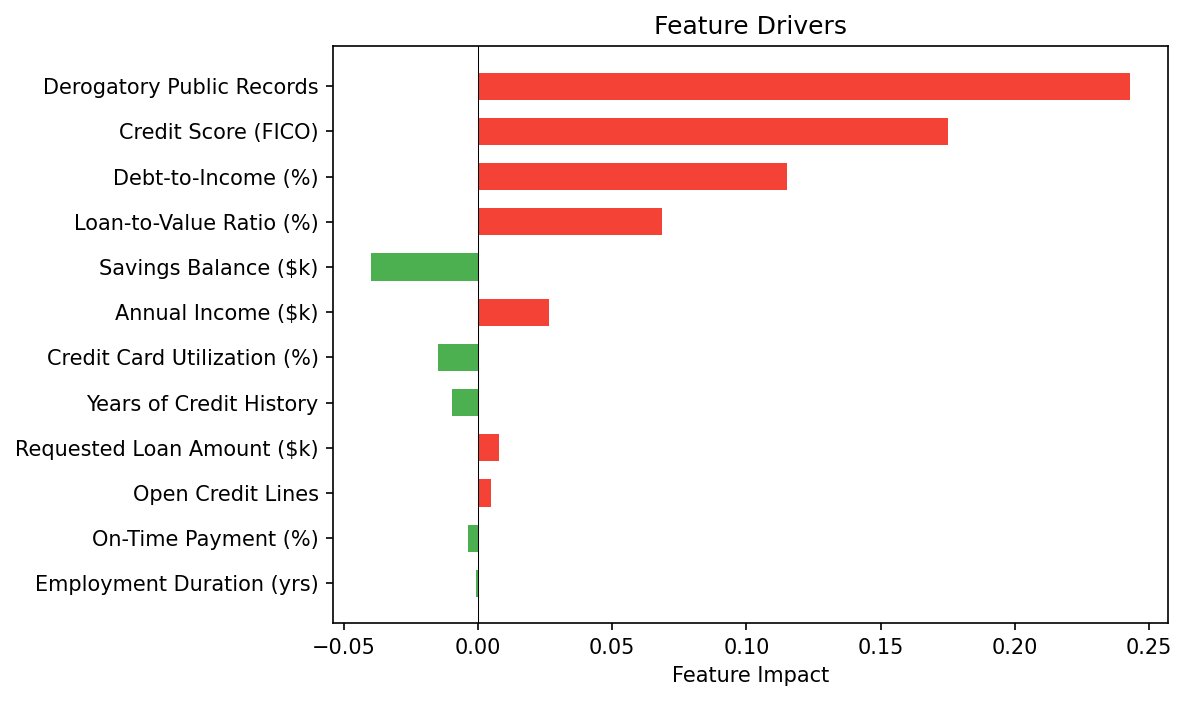
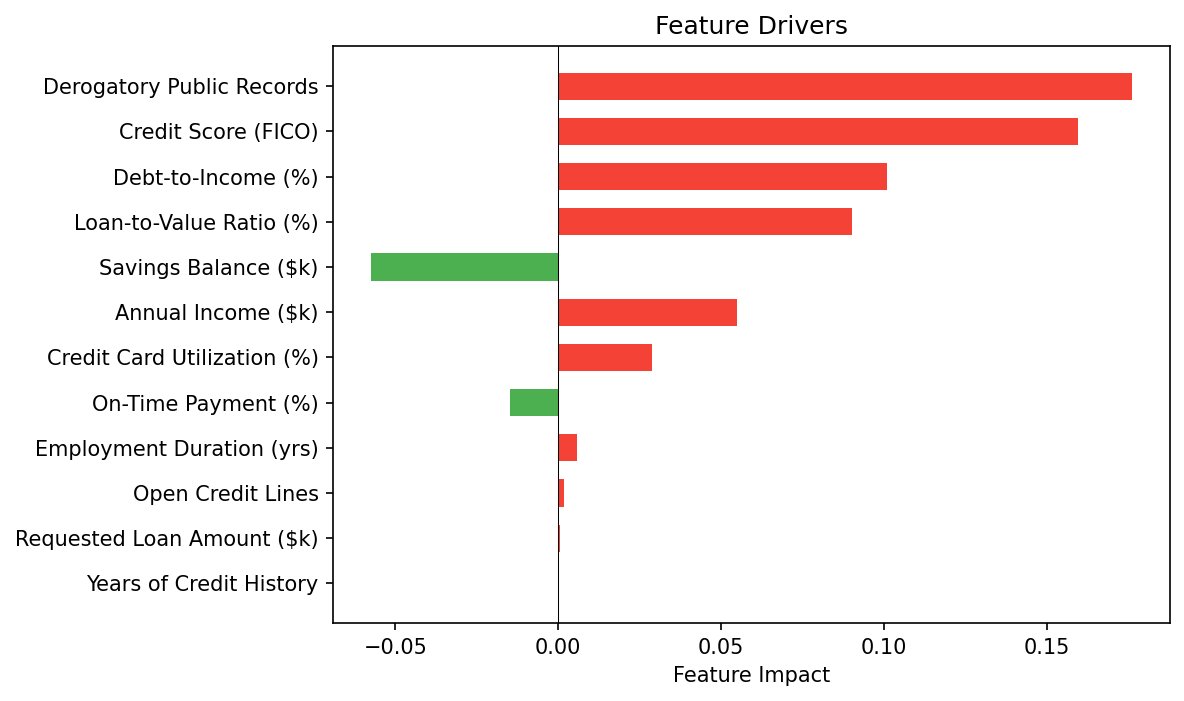
Feature Drivers (Waterfall) What pushed the prediction? |
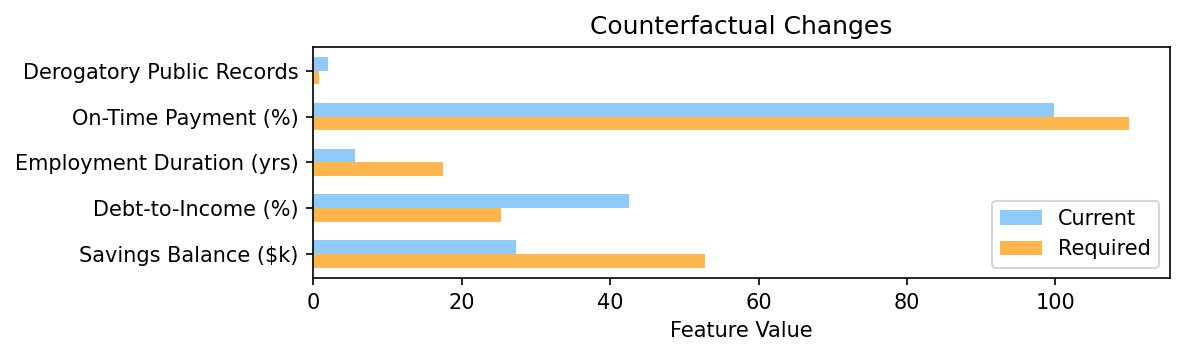
Counterfactual Bars What needs to change? |
 |
 |
 |
📝 Auto-Generated Credit Underwriting Memo
For declined applicants, mlxplain generates a compliance-ready text summary with the decision, probability, ranked risk drivers, and actionable cure paths:
============================================================
CREDIT UNDERWRITING MEMO (XGBoost SHAP / RandomForest XAI)
============================================================
CREDIT DECISION: Declined
Default Probability: 65.7% (threshold: 45.0%)

RISK FACTORS:
  - Derogatory Public Records: 2 (impact: 0.1789)
  - Credit Score (FICO): 612.7 (impact: 0.1597)
  - Debt-to-Income (%): 42.54 (impact: 0.1022)
  - Loan-to-Value Ratio (%): 92.13 (impact: 0.08839)
  - Annual Income ($k): 68.41 (impact: 0.05231)
  - Credit Card Utilization (%): 25.97 (impact: 0.03185)
  - Employment Duration (yrs): 5.625 (impact: 0.005195)
  - Open Credit Lines: 6 (impact: 0.001935)
  - Requested Loan Amount ($k): 31.06 (impact: 0.0003766)

MITIGATING FACTORS:
  + Savings Balance ($k): 27.25 (impact: 0.06112)
  + On-Time Payment (%): 99.89 (impact: 0.01372)
  + Years of Credit History: 10.78 (impact: 8.391e-05)

CURE PATHS (changes needed for approval):
  → Derogatory Public Records: decrease from 2 to 0.92
  → Savings Balance ($k): increase from 27.25 to 30.52
  → Credit Card Utilization (%): decrease from 25.97 to 16.62
  → Debt-to-Income (%): decrease from 42.54 to 29.78
  → Loan-to-Value Ratio (%): decrease from 92.13 to 75.54
  → Credit Score (FICO): increase from 612.7 to 686.2
============================================================
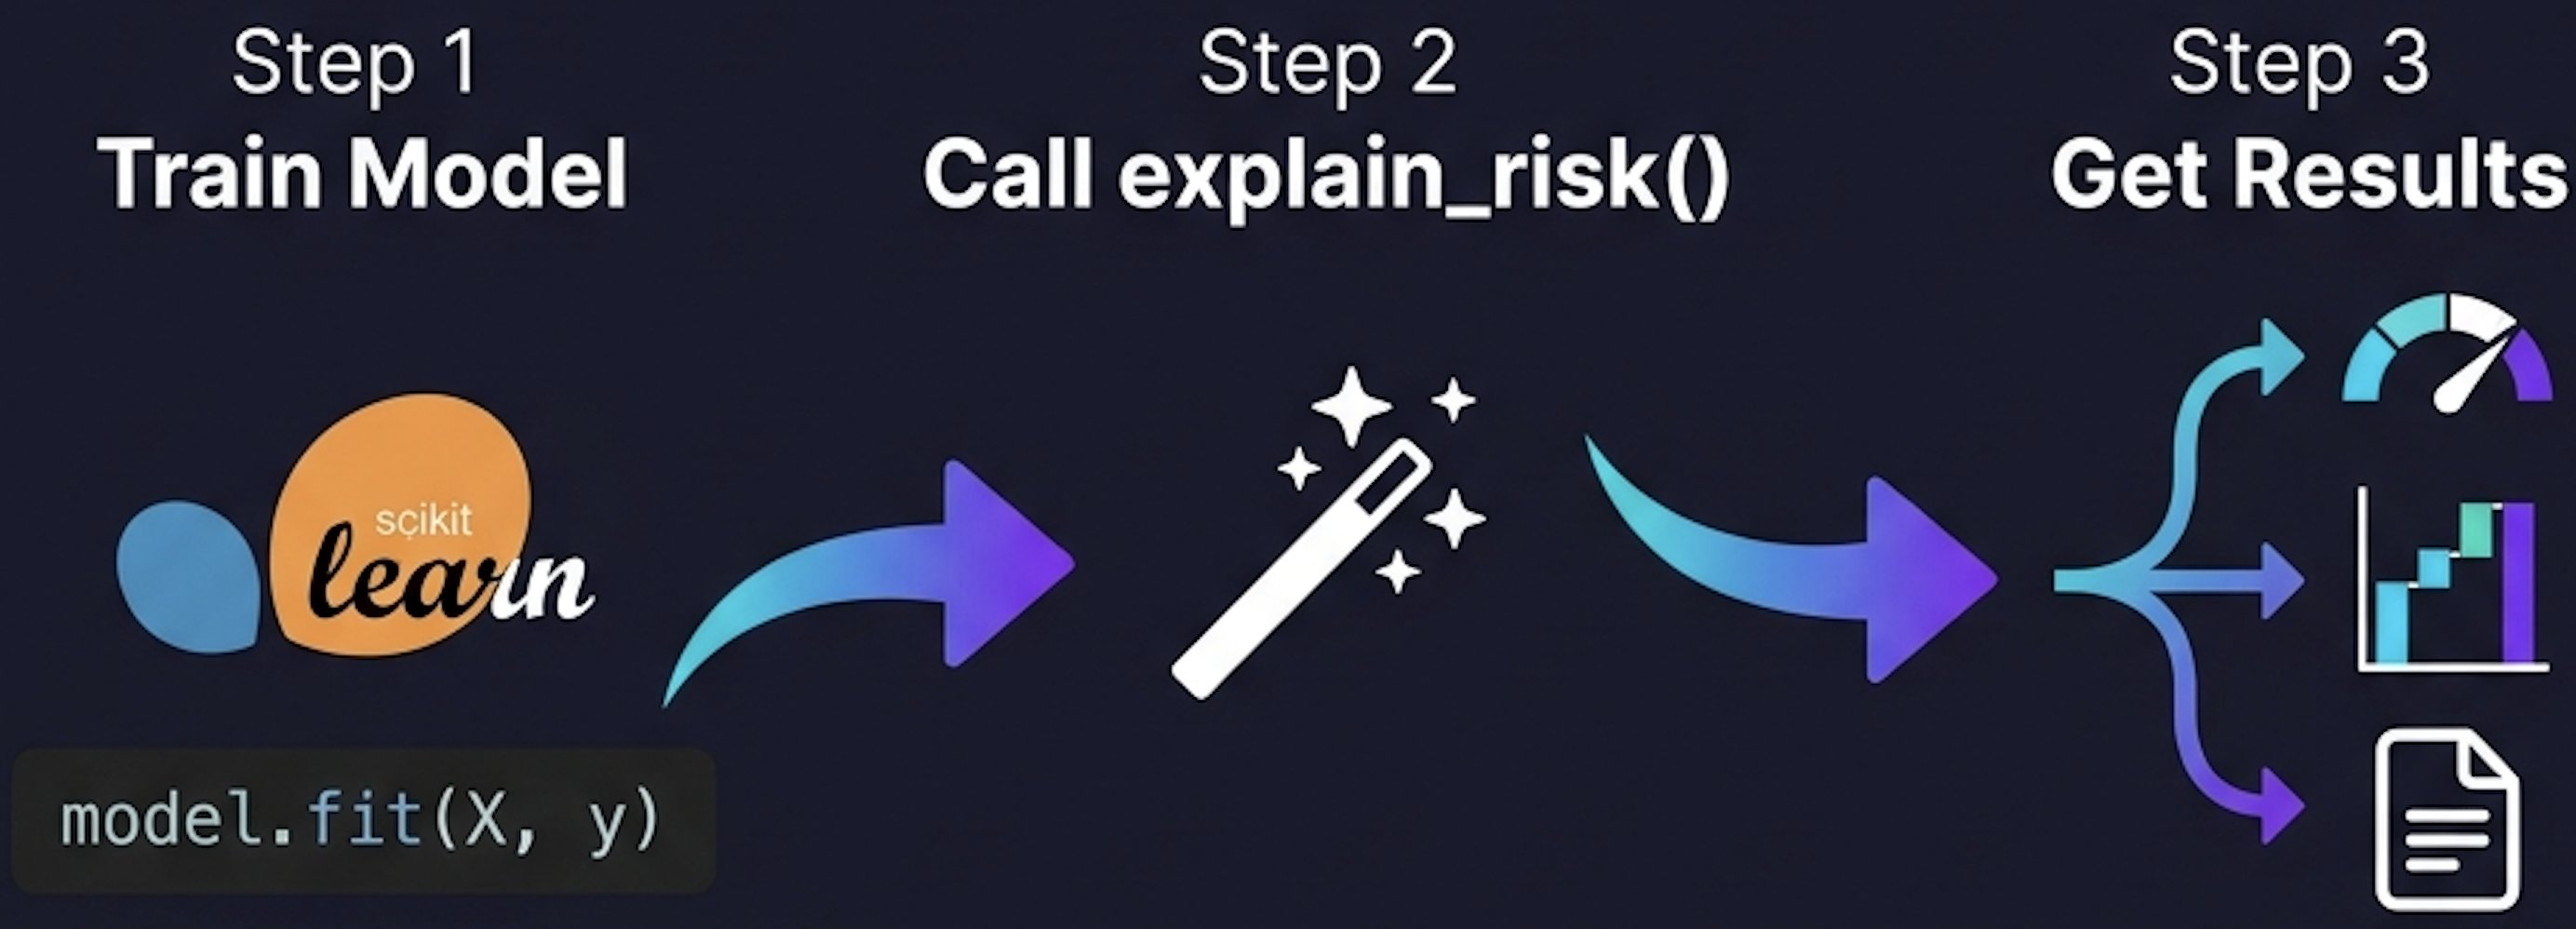
⚡ Quick Start (4 Lines)
from mlxplain import explain_risk

report = explain_risk(model, X_train, idx=10, feature_names=FEATURES, threshold=0.45)
print(report.summary)
report.figures["gauge"].savefig("gauge.svg")
💡 Full Integration Example
If you want to see a full, working script including model training and complete visualization exports:
from sklearn.ensemble import RandomForestClassifier
from mlxplain import explain_risk

# 1. Fit your standard ML model (e.g. 12-feature credit scoring model)
model = RandomForestClassifier().fit(X_train, y_train)

# 2. Define the comprehensive feature names
feature_names = [
    "Annual Income ($k)", "Debt-to-Income (%)", "Credit Score (FICO)",
    "Employment Duration (yrs)", "Savings Balance ($k)", "Requested Loan Amount ($k)",
    "Loan-to-Value Ratio (%)", "Open Credit Lines", "On-Time Payment (%)",
    "Derogatory Public Records", "Credit Card Utilization (%)", "Years of Credit History"
]

# 3. Generate visual & compliance explanation report in 1 call!
report = explain_risk(model, X_train, idx=10, feature_names=feature_names, threshold=0.45)

# 4. Print the professional credit underwriting memo
print(report.summary)

# 5. Save vector SVG diagnostic charts
report.figures["gauge"].savefig("gauge.svg")
report.figures["drivers"].savefig("drivers.svg")
report.figures["counterfactuals"].savefig("counterfactuals.svg")
⚙️ Conventions & Policy
Threshold & Direction Semantics
- Decision Rule: Predictions with
probability >= thresholdreceive thepositive_label; predictions withprobability < thresholdreceive thenegative_label. - Driver Direction: A positive driver pushes the prediction toward the
positive_label(e.g. increases rủi ro/anomalous behavior/cluster assignment). A negative driver mitigates/pushes toward thenegative_label.- Credit Risk:
positive_label= Declined,negative_label= Approved. A positive driver means it increases default risk (pushes toward decline). - Fraud Triage:
positive_label= Fraud/Review,negative_label= Clean. - Anomaly Detection:
positive_label= Anomaly,negative_label= Normal.
- Credit Risk:
Categorical Feature Policy
- Continuous Default: Currently, all features are treated as continuous.
- Upstream Handling: One-hot or ordinal-encode categorical features upstream before calling
explain(). - Roadmap: Native discrete categorical counterfactual swaps and visualizations will be supported in version
v0.2.0.
💻 Supported Models & XAI Translators
mlxplain works across the most popular model families with zero configuration changes:
| Model Family | XAI Extraction Method | Counterfactual Strategy |
|---|---|---|
| Logistic Regression | Coefficient weights × feature values | Analytical: Mathematical exact-solution inversion |
| Decision Trees & Random Forests | Split-level class probability differences along decision paths | Perturbation: Iterative split-boundary space search |
| Ensemble Boosting (XGBoost & LightGBM) | SHAP (Shapley Additive exPlanations) values | Perturbation: Sample-bounded boundary search |
| Anomaly Detection (Isolation Forest) | SHAP TreeExplainer on isolation trees |
Perturbation: Iterative score boundary search |
| Clustering (K-Means) | Spatial distance differences vs target centroid | Analytical: Exact L2 half-space mathematical projection |
| Deep Learning (Neural Nets) | LIME / Integrated Gradients | (Planned / Deferred) |
Charts Across All Model Types
| Logistic Regression | Decision Tree | XGBoost (SHAP) | |
|---|---|---|---|
| Feature Drivers | |
 |
 |
🎯 Core Capabilities
For any supported binary classification model, mlxplain delivers three pillars of explanation:
- The Decision: Classifies the prediction into a clear label (e.g., Approved/Declined) based on a configurable threshold.
- The Drivers: Identifies and ranks which features pushed the prediction in each direction, sorted independently by mathematical impact.
- The Counterfactuals: For unfavorable outcomes, calculates the exact minimum feature adjustments required to cross the threshold (e.g., "Reduce loan amount by $5,000").
- Smart Performance: Counterfactuals are only computed for unfavorable predictions (probability ≥ threshold) to save CPU cycles on favorable decisions.
🧩 Pluggable Domain Architecture
The core of mlxplain is model-aware but completely business-agnostic. It separates what the model saw from what it means in business terms:
mlxplain/
├── core/              # Data structures, threshold logic, counterfactuals
├── translators/       # Model-specific feature extraction (domain-agnostic)
├── visualizations/    # Standard matplotlib figures
├── domains/           # Pluggable business interpreters
│   └── credit_risk/   # Credit-specific: Approved/Declined, Risk Factors, Cure Paths
└── engine.py          # Unified API entrypoint
To support a new domain (e.g., healthcare or fraud_detection), you simply create a new domain interpreter subclassing BaseDomain. The translators, math engines, and charting code remain 100% untouched.
🏦 Credit Risk Domain Mapping
The credit risk domain interpreter maps mathematical abstractions into commercial banking terminology:
| Mathematical Concept | Credit Risk Business Term |
|---|---|
| Positive Prediction | Declined (High default probability) |
| Negative Prediction | Approved (Low default probability) |
| Positive Drivers | Risk Factors (Model weaknesses) |
| Negative Drivers | Mitigating Factors (Model strengths) |
| Counterfactuals | Cure Paths (Required adjustments for approval) |
🖥️ Command-Line Interface (CLI)
mlxplain features an advanced, standard-library-based CLI tool mlxplain to generate reports, print colored terminal dashboards, and export files with zero python code!
Usage Syntax
mlxplain explain --model model.pkl --data features.csv --idx 0 [options]
Options & Parameter Mapping
--model: Path to a pickled orjoblibtrained model.- Security notice: Prints a clear runtime warning about arbitrary code execution in untrusted files.
--data: Path to a CSV file containing your feature rows. Columns are automatically parsed (headers are auto-detected!).--idx: Zero-based row index to explain (default:0).--threshold: Classification decision boundary (default:0.5).--output: Optional file path to write results (HTML or JSON).--format: Output format, choosing from:text: Gorgeous ANSI-colored terminal dashboard displaying a decision progress bar, colored driver impact scales, and a counterfactual checkbox list.json: Structured, machine-readable JSON representation of prediction scores, sorted drivers, and cure paths.memo: Raw, unformatted business underwriting/credit memo text.html: High-DPI single-file HTML report.
--domain: Business domain routing, e.g.credit_riskmaps toexplain_risk()metrics.--language: Translation selection, choosing fromen(English) orvi(Vietnamese).--immutable: Comma-separated list of immutable feature names (e.g.--immutable "Age,History").--bounds: High-precision feature constraints, passed as a raw JSON string (e.g.--bounds '{"Income": [10000, 50000]}') or a JSON file path.
📊 Interactive Dashboards & Premium HTML Dossier
1. Dynamic Plotly Dashboards
In addition to static matplotlib charts, you can generate fully interactive Plotly equivalents:
- Interactive Gauge: Displays decision boundaries with dynamic arcs and markers.
- Feature Driver Waterfall: Allows hovering to inspect exact attribution margins.
- Grouped Counterfactuals: Interactive grouping to easily compare current vs required values.
- Per-Class Heatmap: Divergent color scales showing class contributions dynamically.
To generate these interactive Plotly figures, simply call:
from mlxplain.visualizations.plotly_charts import plot_report_plotly

# Returns a dictionary of Plotly Figure objects: gauge, drivers, counterfactuals, heatmap
plotly_figures = plot_report_plotly(report)
2. Single-File HTML Reports (export_html)
Compile the complete explanation report into a self-contained, high-DPI HTML report suitable for compliance, triage audits, or emailing to underwriters:
- Embeds all matplotlib figures natively as Base64-encoded PNG strings.
- Optionally incorporates active interactive Plotly graphs using a single CDN library script in the header.
- Features a responsive CSS design (supporting dark/light preferences), glassmorphism card containers, and clean Outfit/Inter Google typography.
- Print-Ready: Configured with CSS print viewports for high-fidelity browser print-to-PDF ("Save as PDF").
from mlxplain.core.exporter import export_html

# Exports the report directly as a premium single-file HTML dashboard
export_html(report, "dossier.html", include_plotly=True)
🎨 Featured Examples Gallery
mlxplain is accompanied by 10 comprehensive, ready-to-run examples demonstrating standard business scenarios, mathematical paradigms, and premium visualizations.
📊 Highlighted Showcases
| Multi-Model Comparison Grid (Example 08: Side-by-side consistency verification) |
Constrained Compliance Counterfactuals (Example 09: Locked histories & FICO limits) |
 |
 |
📂 Directory of Runnable Examples
| Example Script | Business Domain | Key XAI Capability Showcased | Optional Deps |
|---|---|---|---|
| 01_logistic_credit_risk.py | Credit Underwriting | Logistic Regression exact analytical counterfactual cure paths | None |
| 02_decision_tree_credit_risk.py | Credit Underwriting | Split-level decision tree path probability contributions | None |
| 03_ensemble_credit_risk.py | Credit Underwriting | XGBoost / LightGBM game-theoretic SHAP driver attributions | xgboost, shap |
| 04_advanced_credit_risk.py | Credit Underwriting | 12-feature high-DPI glassmorphic HTML dossier compiler | xgboost (opt) |
| 05_anomaly_detection.py | Server IT Operations | Isolation Forest anomaly score normalization & DDoS spike drivers | shap |
| 06_kmeans_clustering.py | Retail Marketing | KMeans customer segments spatial centroid L2 counterfactual roadmap | None |
| 07_multiclass_credit_grading.py | Credit Underwriting | Multinomial multi-class credit grading with Vietnamese localization | None |
| 08_model_comparison.py | Underwriting Compliance | Stitched multi-model waterfall driver consistency comparison | xgboost (opt) |
| 09_constrained_counterfactuals.py | Compliance / Safety | Safety bounds and immutable years history constraints | None |
| 10_plotly_dashboards.py | Web Risk Triage | Premium interactive Plotly widgets & dynamic HTML exports | plotly |
🚀 Runnable Examples
The examples/ directory contains complete, runnable scripts showing mlxplain end-to-end. They generate synthetic credit data, train models, produce reports, and save diagnostic plots.
Run them directly using uv:
# 1. Run the Logistic Regression Credit Risk example
uv run python examples/01_logistic_credit_risk.py

# 2. Run the Decision Tree Credit Risk example
uv run python examples/02_decision_tree_credit_risk.py

# 3. Run the XGBoost SHAP-based Credit Risk example
uv run python examples/03_ensemble_credit_risk.py

# 4. Run the Advanced 12-Feature HTML Dossier Credit Risk example
uv run python examples/04_advanced_credit_risk.py

# 5. Run the Unsupervised Anomaly Detection example
uv run python examples/05_anomaly_detection.py

# 6. Run the Unsupervised KMeans Customer Segmentation example
uv run python examples/06_kmeans_clustering.py

# 7. Run the Localized Multi-Class Credit Grading example
uv run python examples/07_multiclass_credit_grading.py

# 8. Run the Side-by-Side Model Comparison example
uv run python examples/08_model_comparison.py

# 9. Run the Constrained Compliant Counterfactuals example
uv run python examples/09_constrained_counterfactuals.py

# 10. Run the Premium Interactive Plotly Dashboards example
uv run python examples/10_plotly_dashboards.py
All examples save their generated plots to examples/output/. The advanced example also creates dossier.html in that directory — open it in your browser to view the interactive glassmorphic dashboard!
🌀 Unsupervised Model Explainability
mlxplain is the first general-purpose explainability engine to unify supervised classification with unsupervised learning XAI (Anomaly Detection & Clustering) under the exact same visual and structured output reporting standards!
1. Anomaly Detection (via IsolationForest)
- Standardized Anomaly Scoring: We normalize scikit-learn's Isolation Forest anomaly scores into $[0, 1]$, treating it exactly like a probability with a standard
0.5decision boundary. Accessible via the unifiedexplain()API. - SHAP Drivers: Uses SHAP's
TreeExplaineron isolation trees to extract exact features pushing the instance into anomalous vs normal states. - Cure Counterfactuals: Employs sample-bounded perturbation search to identify the exact feature changes needed to restore the anomalous system to normal behavior.
2. Clustering (via KMeans)
- Dedicated Endpoint: Introduces
explain_cluster()to explain K-Means cluster assignments vs runner-up or target clusters. - Distance Drivers: Measures how much each feature contributes to keeping the instance closer to the assigned centroid $c$ rather than the competitor centroid $t$: $$\text{impact}_i = (x_i - t_i)^2 - (x_i - c_i)^2$$
- Closed-Form Upgrade Roadmap: Utilizes a highly robust, exact L2 mathematical projection to calculate the absolute minimum single/multi-feature changes needed to transition the instance to a target cluster instantly with zero loops!
- Cluster Gauge Score: Normalizes Euclidean distance vectors into a $[0, 1]$ proximity score ($p = d_t^2 / (d_c^2 + d_t^2)$) to reuse the standard gauge visualization.
🔠 Multi-Class Classification Explainability (Grades & Tiers)
mlxplain provides native support for multi-class classification models, extending unified feature impact tracking and counterfactual cure paths beyond simple binary decisions:
- Argmax Prediction & Runner-Up Defaults: Automatically detects multi-class models, classifies via standard probability argmax, and defaults the counterfactual target to the runner-up class (the most likely alternative) if no explicit
target_classis provided. - Premium Heatmap & Probability Charts: In multi-class mode,
plot_report()automatically swaps the binary gauge for:- A Class Probabilities Bar Chart highlighting the predicted class.
- A Per-Class Feature Impact Heatmap displaying a rich, divergent representation of feature contributions across all classes.
- Closed-Form Multinomial Counterfactuals: Invents exact analytical multinomial logit transformations to solve for the boundary transition $\Delta X_f = \frac{z_{c^} - z_t}{W_{t, f} - W_{c^, f}}$ with absolute mathematical precision.
- Credit Risk Grading & Localized Memos: Adapts underwriting outputs for risk tiers (A/B/C), generating credit grade memos localized as "Grade A/B/C" in English and "Hạng A/B/C" in Vietnamese.
📦 Installation
This project is fully compatible with uv for lightning-fast package management.
For Users
Install the base package directly into your virtual environment (logistic and tree models work out-of-the-box):
uv pip install mlxplain-xai
# or using standard pip
pip install mlxplain-xai
Optional Backends (XGBoost / LightGBM / IsolationForest)
To use ensemble-based explainers or unsupervised anomaly detection, install with the shap optional extra:
pip install mlxplain-xai[shap]
Interactive Dashboards Backend (Plotly)
To generate dynamic Plotly-based interactive dashboards alongside matplotlib, install with the plotly extra:
pip install mlxplain-xai[plotly]
[!NOTE] Upgrading from 0.1.x?
shapis now an optional dependency inv0.2.0to reduce startup import overhead. If your code uses XGBoost, LightGBM, or IsolationForest, please make sure to install/upgrade usingpip install mlxplain-xai[shap]. See CHANGELOG.md for full details.
Or install the locked development dependencies:
pip install -r requirements.txt
pip install -e .
For Developers
Set up the project locally for development:
- Clone the repository:
git clone https://github.com/nguyen-thinh15/mlxplain.git
cd mlxplain
- Create and synchronize the environment:
uv venv --python 3.10
source .venv/bin/activate
uv sync --all-extras
- Run the test suite:
uv run pytest tests/ -v
Core Dependencies: numpy, scikit-learn, matplotlib
Optional Dependencies: shap, xgboost, lightgbm (for ensembles), plotly (for interactive charts)


Download files
Download the file for your platform. If you're not sure which to choose, learn more about installing packages.
Source Distribution
Built Distribution
Filter files by name, interpreter, ABI, and platform.
If you're not sure about the file name format, learn more about wheel file names.
Copy a direct link to the current filters
File details
Details for the file mlxplain_xai-0.2.0.tar.gz.
File metadata
- Download URL: mlxplain_xai-0.2.0.tar.gz
- Upload date:
- Size: 61.3 kB
- Tags: Source
- Uploaded using Trusted Publishing? No
- Uploaded via: uv/0.11.3 {"installer":{"name":"uv","version":"0.11.3","subcommand":["publish"]},"python":null,"implementation":{"name":null,"version":null},"distro":{"name":"macOS","version":null,"id":null,"libc":null},"system":{"name":null,"release":null},"cpu":null,"openssl_version":null,"setuptools_version":null,"rustc_version":null,"ci":null}
File hashes
| Algorithm | Hash digest | |
|---|---|---|
| SHA256 |
3d131db4e452b55e362c9b4ae5f0a4e63def095615b995b453cfde810c9bccae
|
|
| MD5 |
e413d216f3a43804ec413bb75bbdaad5
|
|
| BLAKE2b-256 |
19ef3d0e66a5b2d3470349737b89372983b6f5ee990d46584286de2bcf8ac198
|
File details
Details for the file mlxplain_xai-0.2.0-py3-none-any.whl.
File metadata
- Download URL: mlxplain_xai-0.2.0-py3-none-any.whl
- Upload date:
- Size: 50.6 kB
- Tags: Python 3
- Uploaded using Trusted Publishing? No
- Uploaded via: uv/0.11.3 {"installer":{"name":"uv","version":"0.11.3","subcommand":["publish"]},"python":null,"implementation":{"name":null,"version":null},"distro":{"name":"macOS","version":null,"id":null,"libc":null},"system":{"name":null,"release":null},"cpu":null,"openssl_version":null,"setuptools_version":null,"rustc_version":null,"ci":null}
File hashes
| Algorithm | Hash digest | |
|---|---|---|
| SHA256 |
3b5c693d5df2e7b75dad4b29d93f9bfab68c047817e8907db2e951f7df132f0e
|
|
| MD5 |
547c148c118455649144f1417f60405b
|
|
| BLAKE2b-256 |
4f71b3a93f5c29df2d229d69147b4ab304dbc770782f1b194867182e3943a49d
|


