
modbus_connector

Download ready-made builds for macOS / Windows / Linux → Releases
Watch the video presentation (1 min, Russian voice-over) → docs/presentation.mp4
A PySide6 GUI application for debugging Modbus buses and developing Modbus devices. Works with Modbus TCP and Modbus RTU via synchronous pymodbus clients; all Modbus logic runs in a separate thread (QThread), so the GUI never freezes.
Features
- Multiple simultaneous connections in tabs: each tab is an independent
session with its own connection, register table, log and scanner. Settings
for all tabs persist between launches in
~/.modbus_connector/settings.json(old single-session settings files keep working), and can also be saved to / loaded from an arbitrary JSON file via the File menu. - Connection types: TCP (host, port, timeout), RTU (serial port, baudrate, parity, etc.; RTU by default) and RTU over TCP / RTU over UDP for RS-485↔Ethernet converters — all configured in the GUI.
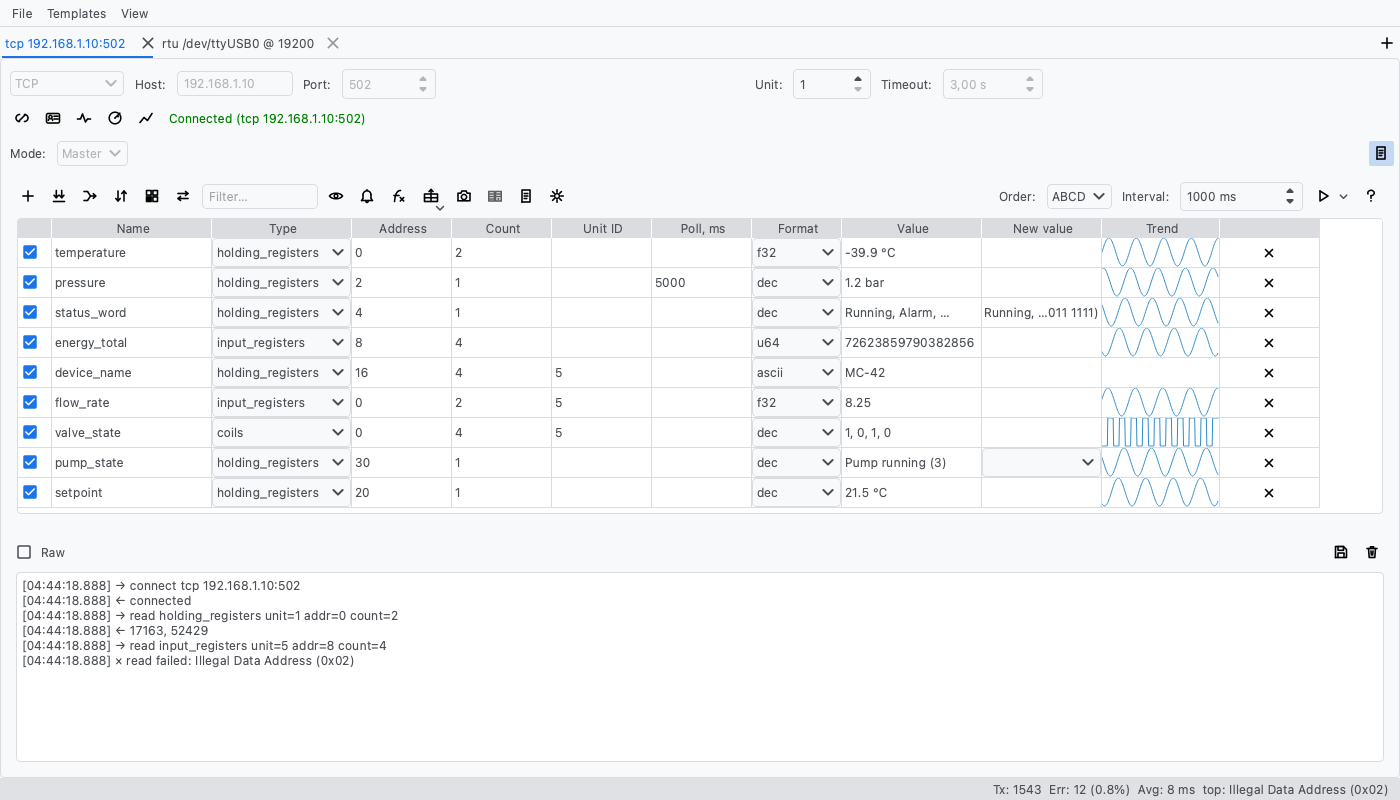
- Register table: rows with a name, area type (coils, discrete inputs, holding/input registers), address and count; read and write values. Enter in the "New value" column sends the write command, Ctrl+R (Cmd+R on macOS) reads the current row; the whole table is keyboard-friendly.
- Rich value display: per-row formats (dec/hex/s16/u32/s32/f32/u64/s64/f64/ ascii) with byte order variants (ABCD/CDAB/BADC/DCBA), scaling with offset and engineering units; a value that changed between reads flashes for a couple of seconds.
- Per-row Unit ID (rows can address different devices on the same bus) and per-row polling interval (slow and fast registers in one table).
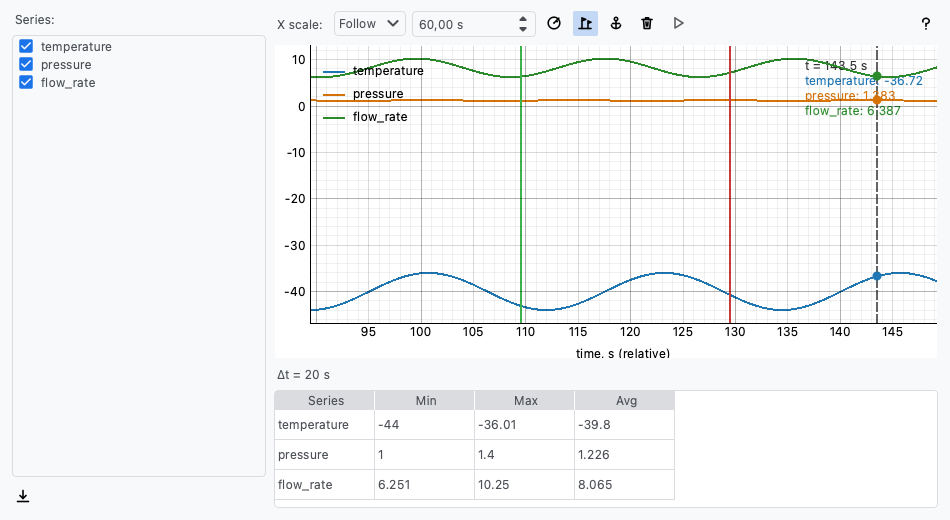
- Live graphs ("Graph…" button, separate window): a trend sparkline per table row and a full plot window with multiple series, sliding-window/follow or manual zoom, and draggable markers with per-series min/max/avg.
- Background logging of polled values to a CSV or JSON Lines file ("Log to file" button), with a configurable set of fields.
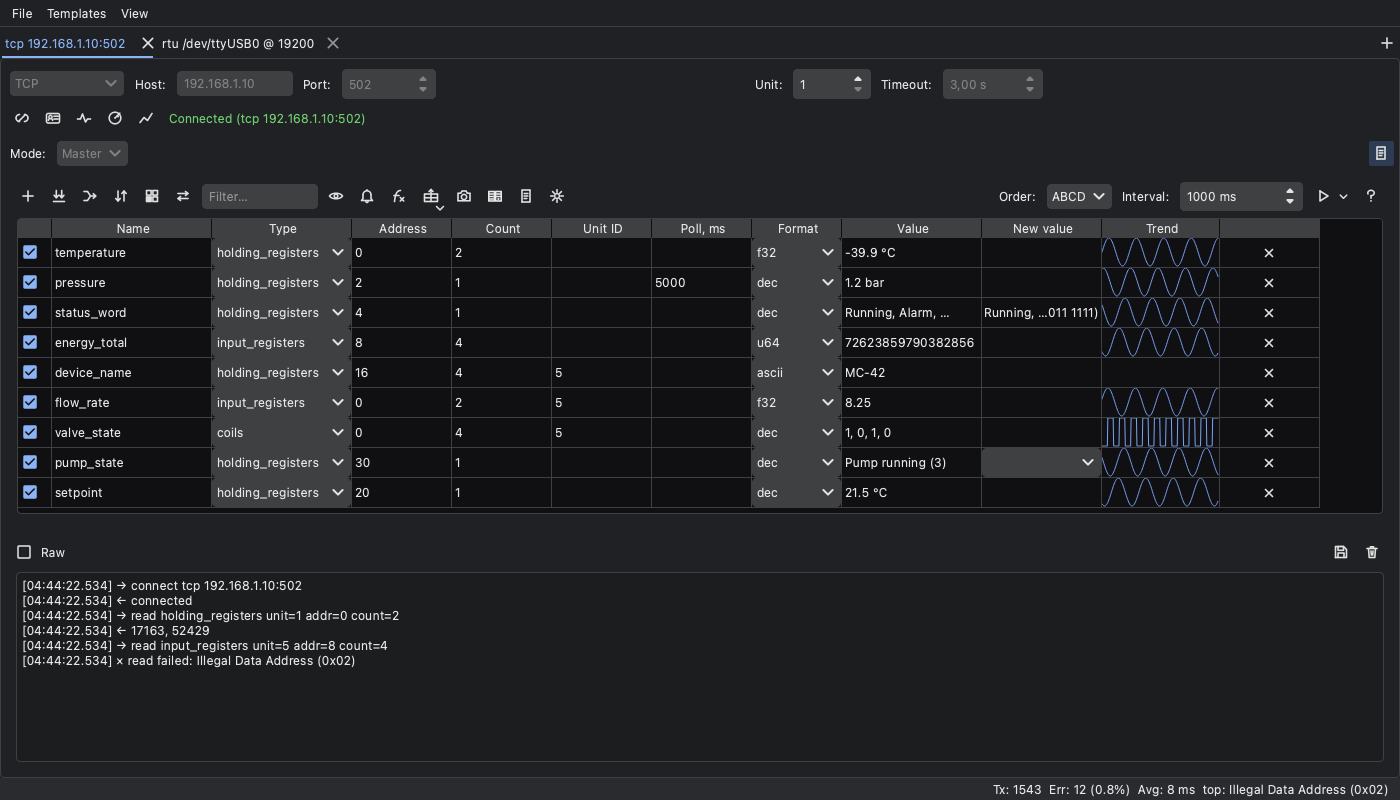
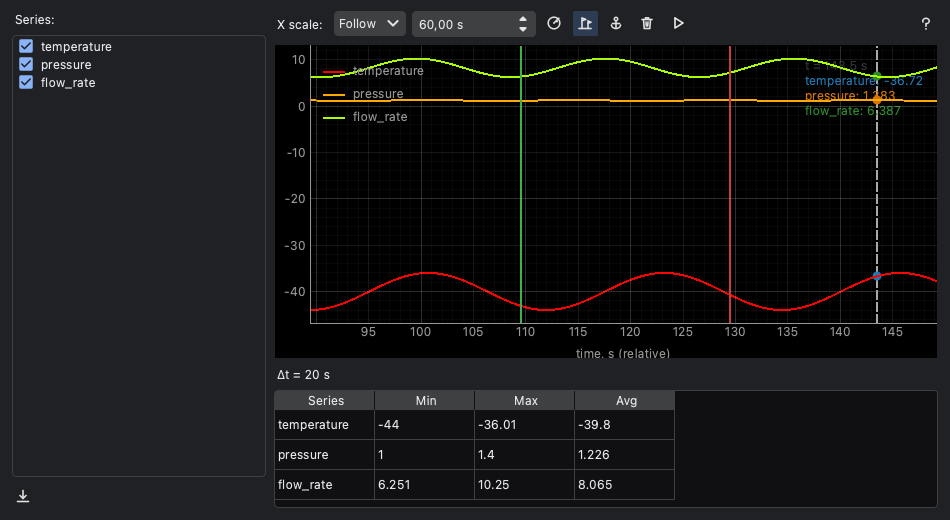
- System/Light/Dark theme (pyqtdarktheme) from the View menu — graphs, sparklines, status colors and highlights all follow the theme.
- Filter box and one-click "Sort by address" for large tables.
- Advanced protocol functions: Mask Write Register (0x16), Read/Write Multiple Registers (0x17), Read Device Identification (0x2B) and serial-line Diagnostics (0x08) — via dedicated dialogs.
- Link visibility: transaction statistics in the status bar (count, errors with percentage, top error kind, average response time), human-readable Modbus exception names and a live connection indicator (green = alive, orange "(idle)" = link idle or degraded).
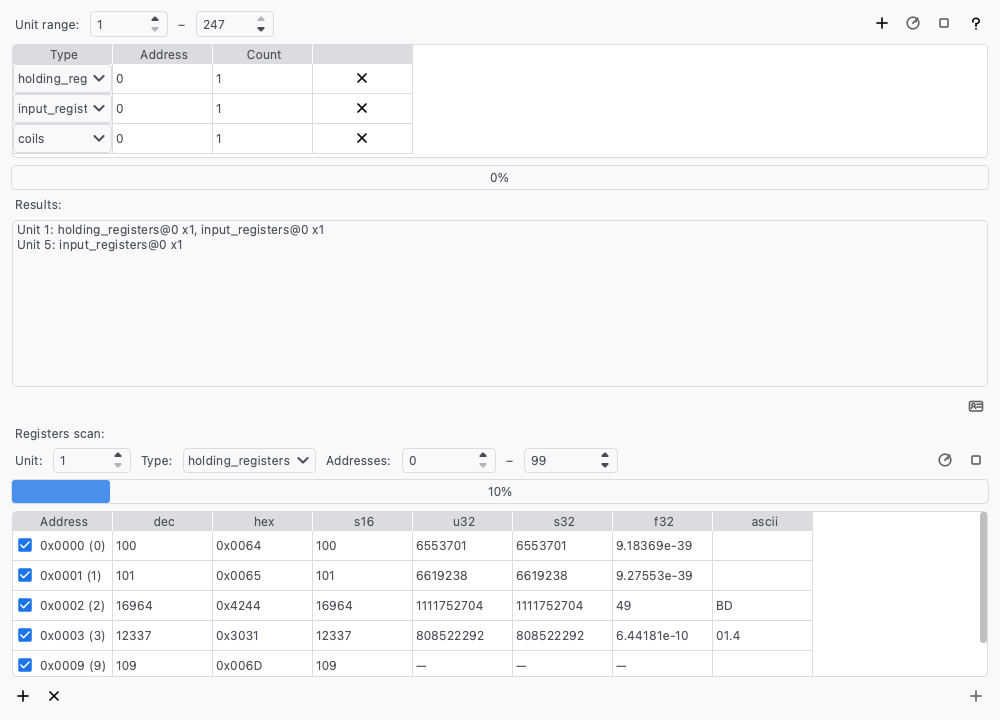
- Address scanner ("Scanner…" button, separate window): iterates unit ids in a given range with configurable probes and shows devices that answered at least one probe; double-click a found unit to select it for the connection. A second sweep scans the register address space of a known unit and lists the addresses that respond.
- Log panel at the bottom of the window, toggled with the "Log" button: human-readable requests/responses, optional raw bus traffic in hex ("Raw" checkbox) and export of the whole log to a file ("Save…").
Screenshots
Main window (light and dark themes — the View menu switches them) — two connection tabs, register table with read values and per-row trend sparklines, log:
Live graph — multiple series in a follow window, zoom and draggable markers with per-series min/max/avg (the "Graph…" button in the connection panel); light and dark themes:
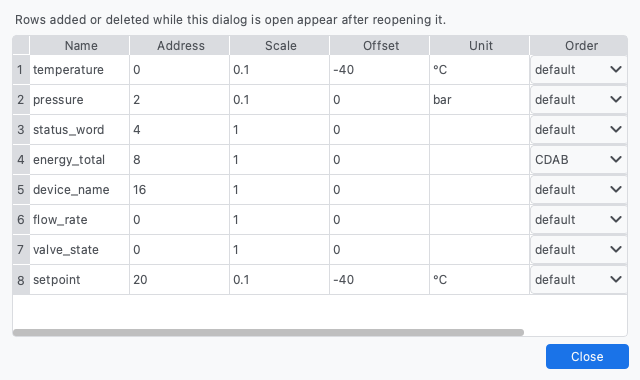
Per-row display settings — Scale/Offset/Unit and a byte-order override per register row (the "Display…" button above the table):
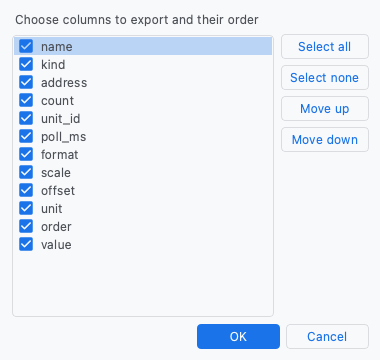
CSV export — choose which columns to write and their order (the "CSV" button above the table):
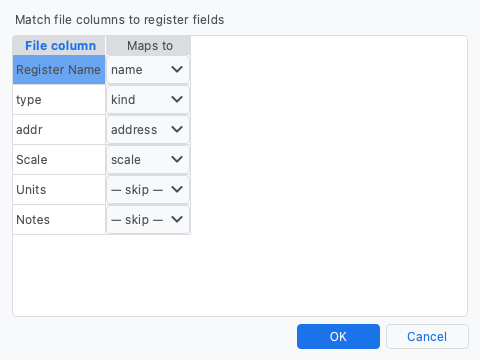
CSV import — map file columns to register fields before loading the table:
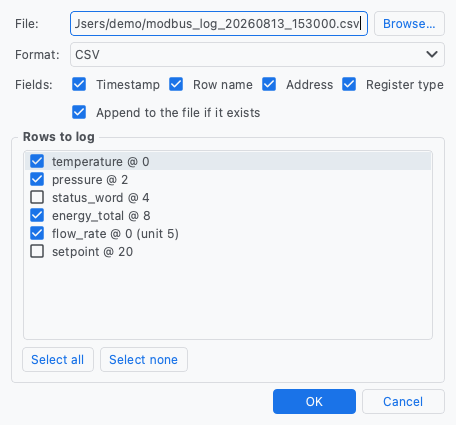
Logging to a file — write polled values to CSV or JSON Lines: file, format, field selection and a per-row checklist (the "⚙" button above the table):
Address scanner — unit sweep with probes and the register address scan:
Requirements
- Python 3.11+
PySide6,pymodbus[serial]==3.6.9
Installation
python -m venv .venv
source .venv/bin/activate
pip install -e .[dev]
Run
modbus-connector
# or
python -m modbus_connector
Usage
Connecting
- Choose the connection type: TCP (host, port), RTU (serial port, baudrate, data bits, parity, stop bits — RTU is the default; use "Refresh" to rescan serial ports) or RTU over TCP / RTU over UDP (host, port — RTU frames inside a network socket, for RS-485↔Ethernet converters such as USR or Elfin).
- Set the Unit ID of the target device (used for all register operations) and the response Timeout.
- Press Connect. Input fields are locked while connected; press Disconnect to change settings.
The status label next to the button is live: green means the link is up, orange with an "(idle)" suffix means the connection is configured but the last transaction timed out — pymodbus reconnects transparently on the next request, so this is informational, not an error. The status bar at the bottom of the window shows transaction counters: total, errors with a percentage and the most frequent error kind (the full breakdown by error type is in the label's tooltip), plus the average response time of successful operations. Modbus exception responses are reported by name (e.g. "Illegal Data Address (0x02)") in the log.
Working with tabs
The main window holds connections in tabs. The + button in the tab bar
corner opens another independent session — its own connection, register table,
log and scanner window. The tab title follows the connection (e.g. tcp 192.168.1.10:502); the last remaining tab cannot be closed. The status bar
statistics follow the active tab. All tabs are saved to the settings on exit
and restored on the next launch — including each table's column widths. The
View menu switches the theme (System/Light/Dark); the choice is app-wide
and is saved with the settings.
Adding registers
Press Add register and fill in the row: an arbitrary Name, the area
Type (coils, discrete inputs, holding registers, input registers),
Address (decimal or hex, e.g. 0x10) and Count (how many values to
read starting at the address). The optional Unit ID column overrides the
connection-wide unit for this row (empty = use the connection unit) — handy
for polling several devices on one RS-485 bus. All columns are plain cells —
the table is fully navigable with the keyboard. The ✕ button deletes a row.
Reading values
- Ctrl+R (Cmd+R on macOS) — reads the row that has the keyboard focus; Ctrl+Shift+R reads every row (the "Read all" button).
- Quick actions on the focused row (also in the table's right-click menu): Ctrl+C copies the value, Ctrl+0/Ctrl+1 write 0/1, Ctrl+= (or numpad Ctrl++)/Ctrl+- step the last read value, Ctrl+T toggles it (coils flip the bit; a register goes 0↔1). Writes use raw values, so scaled/hex displays stay safe; input/discrete areas report "read-only".
- Read all — reads every row once.
- Start polling and record — a split button: the main action reads all rows repeatedly with the interval set in the "Interval" field (milliseconds) and records value history; press Stop polling to stop. The dropdown offers Start polling (without recording) and Start polling and record — picking one while polling runs switches the recording mode on the fly, and the last choice becomes the main action. The optional Poll, ms column overrides the interval per row (empty = global interval; finer values are effectively clamped to the global tick).
Read values appear in the Value column; every request and response is also shown in the log panel (toggled with the "Log" button). Bus-reading controls (Read all, polling, logging, the 0x16/0x17 dialogs and the scanner's Start buttons) are enabled only while a connection is up — dropping the connection stops polling and logging.
Display formats, scaling and units
For register rows the Format column chooses how the Value column renders:
dec (default), hex (0xNNNN), s16 (signed 16-bit), u32/s32/f32
(pairs of registers as one 32-bit value), u64/s64/f64 (groups of four
registers) and ascii (two characters per register, e.g. device names and
serial numbers; the string ends at the first NUL byte). Coils and discrete
inputs always show 0/1.
Multi-register values are big-endian by default (the first register is the
high word); the Order combo above the table sets the byte layout for all
rows (ABCD default, CDAB word-swapped, BADC byte-swapped words, DCBA
full reverse), and a per-row override is available in the Display… dialog.
A leftover register that does not fill a whole 32/64-bit group is shown as-is.
The Scale, Offset, Unit and per-row Order settings live in the
Display… dialog above the table (one row per register row). The raw
registers are first decoded according to Format and Order, then each decoded
number is displayed as x * scale + offset with the unit appended
(e.g. 23.5 °C). Scaling is skipped for the hex and ascii formats.
Table columns can be resized by dragging the header separators.
A value that changed since the previous read flashes green for ~2 seconds.
Use the Filter… box above the table to show only rows whose name, type, address or unit id contains the text, and Sort by address to reorder the table by address.
Writing values
Type the value(s) into the New value column and press Enter — the write command is sent immediately. Values are always raw: display scaling (Scale/Offset) is never applied to them.
- registers: decimal or hex numbers (
4321,0x10E1); for Count > 1 enter several values separated by commas or spaces (1, 2, 0xFF) — a single value uses function "write single register", several values use "write multiple registers"; - coils:
0/1,true/false,on/off(case-insensitive).
After a successful write the row is re-read automatically, so the Value column reflects the applied change. Parse errors and Modbus errors are reported in the log panel.
Note: only coils and holding registers are writable — discrete inputs and input registers are read-only by the protocol.
Advanced protocol functions
- Mask write (0x16)… (button above the table) — Mask Write Register: AND/OR masks applied to one holding register, setting or clearing individual bits without touching the others. Table rows covering the address are re-read after a successful write.
- Read/Write (0x17)… — Read/Write Multiple Registers: writes values and reads back a range in one atomic transaction (no race window); the returned values go to the log.
- Device ID… (connection panel, enabled while connected) — Read Device Identification (0x2B/0x0E): vendor name, product code, revision and other objects reported by the device.
- Diagnostics… (connection panel, enabled while connected) — serial-line diagnostics (0x08): loopback echo check and bus/slave message counters with Refresh and Clear counters. This is a serial-line function, but some TCP devices answer it too.
Scanning for devices
Press Scanner… to open the scanner window. Set the unit id range (default 1–247) and the probe list (register type + address + count to try on each address; sensible defaults are prefilled). Start scan begins the sweep, Stop aborts it; units that answered at least one probe appear in the results list. Double-click a found unit to copy it into the connection panel's Unit ID field. Scanning pauses polling in the main window.
The Registers scan section below works the other way around: for a known
unit it reads a range of addresses of a chosen register type one by one and
lists every address that answered as 0xNNNN (dec) — a quick way to map the
register space of an unfamiliar device.
The scanner's range, probe list and address-scan parameters persist in the settings along with everything else.
Graphs
Every register row captures its value history while polling runs in the poll-and-record mode (scaled engineering value; hex/ascii rows are skipped) and shows it as a small trend sparkline in the Trend column. The buffer is bounded to ~10k samples per row; when recording is off, sparklines and graph curves freeze on the last recorded data. Graph… (connection panel) opens the full plot window:
- the Series checklist on the left picks which table rows are plotted (new rows join checked by default);
- X scale: Follow slides a window of the given width along the latest data, Full fits everything, Manual freezes the view — zooming or panning (wheel at cursor, left-drag, or the Zoom rect toggle) switches the mode to Manual so the change is visible; Reset view returns to Follow;
- Markers shows two draggable vertical lines (green A, red B) and a stats table with per-series min/max/avg between them plus Δt, updated live;
- hovering the plot shows a crosshair: a dashed vertical line at the cursor's time and a top-right readout with every series' value at that moment (nearest recorded sample, marked with a dot on each curve);
- Clear empties the recorded history and restarts the relative time axis (markers are re-placed once new data arrives); right-clicking a Trend cell in the table offers the same "Clear history";
- Start polling and record duplicates the table's poll control: starts polling with recording (or just enables recording if polling already runs), turns into Stop polling while recording is active.
Closing the graph window only hides it; the data stays.
Logging values to a file
The Log to file button above the table writes every read value to a file while it is on; starting it also starts polling if it wasn't running (with history recording if the split button's mode is "and record"). The ⚙ button next to it opens the settings: the file (a timestamped name in the home directory is suggested), the format, which optional fields — timestamp (wall clock, ISO 8601 with milliseconds), row name, register address and register type — accompany the value, and which table rows get logged at all (the "Rows to log" checklist; new rows join logged by default, and the per-row choice persists with the session). Values are machine-friendly: decoded numbers with scale/offset but without the unit, multi-value rows joined with ";", coils/discrete inputs as 0/1, hex/ascii rows as displayed.
Formats: CSV (one row per read, a header row in new files) and JSON Lines — one JSON object per line, which streams and appends cleanly. Appending to an existing file is the default; the settings (not the on/off state) persist with the session. Stopping logging leaves polling running.
Log panel
The log panel at the bottom of the main window (toggled with the Log
button) shows every request and response with timestamps. The Raw
checkbox additionally displays raw bus frames in hex (→ tx … / ← rx …) —
off by default to keep the log readable. Save… exports the entire log
(including raw frames hidden by the checkbox) to a text file; Clear
empties it.
CSV import/export
The CSV drop-down above the table exchanges the register table with spreadsheet tools:
- Import table… loads a CSV file and replaces the whole table. A mapping dialog appears first: every file column can be matched to a register field (name, kind, address, count, unit_id, poll_ms, format, scale, offset, unit, order) or skipped; matches are guessed from column names ("type" counts as kind) and the essential fields name/kind/address must be mapped. Errors are reported in the log, an invalid file leaves the table untouched.
- Export… opens a column chooser first — check which columns to write
and reorder them (arrows/Space/Ctrl+Up/Ctrl+Down) — then writes the CSV:
the chosen columns plus an optional
valuecolumn with the currently displayed (formatted/scaled) text — readable as a report and re-importable: thevaluecolumn is simply skipped by default in the mapping dialog, so the round trip "export → edit in Excel → import" works out of the box.
Only name, kind and address are required on import — unmapped optional
fields fall back to defaults. Files are written UTF-8 with BOM so Excel opens
them cleanly.
Building a standalone executable
./build.sh        # macOS / Linux
build.bat         # Windows (cmd, also works by double-click)
The script installs PyInstaller (the build extra) and builds a standalone
application into dist/: on macOS — ModbusConnector.app plus a
ModbusConnector.dmg disk image; on Windows/Linux — a ModbusConnector/
folder with the executable inside (ModbusConnector.exe on Windows; copy the
whole folder to another machine). The artifact does not require Python on the
target machine.
macOS notes:
- Run: double-click
ModbusConnector.apporopen dist/ModbusConnector.app. Never run files from the intermediatebuild/directory (the script removes it after building). - To move the app to another machine use the ready-made
dist/ModbusConnector.dmg(do not rename or repack the.appinto a.pkgyourself — such a file is not a valid installer). - The app is ad-hoc signed: on another Mac Gatekeeper will warn about an
unidentified developer on first launch — open via right-click → "Open", or
remove the quarantine:
xattr -dr com.apple.quarantine ModbusConnector.app.
Linux notes:
- RTU connections to serial ports (
/dev/ttyUSB*,/dev/ttyACM*, etc.) require membership in the port's group, usuallydialout(sometimesuucp). If you seeErrno 13/ "Permission denied" on connect, check the port:ls -l /dev/ttyUSB0
Add your user to the group and re-login (or runnewgrp dialout):sudo usermod -aG dialout $USER
Project layout
src/modbus_connector/
  models.py       # Qt-free data types and helpers: TcpParams/RtuParams/
                  # RtuOverTcpParams/RtuOverUdpParams, RegisterRow, ScanProbe,
                  # DisplayFormat, ByteOrder, describe_connection(),
                  # parse_values()/format_values(),
                  # format_register_values()/format_scaled_values(),
                  # EXCEPTION_CODES/describe_exception(), Stats/StatsSnapshot
  backend.py      # ModbusBackend — synchronous pymodbus wrapper (no Qt):
                  # read/write, mask write (0x16), read/write registers (0x17),
                  # device identification (0x2B), diagnostics (0x08),
                  # unit scan, register address scan, raw traffic hook
  worker.py       # ModbusWorker (QObject) — signals/slots over backend, QThread;
                  # timing statistics, liveness checks, traffic forwarding
  connection_panel.py  # connection panel (TCP/RTU/RTU over TCP/RTU over UDP,
                       # state/set_state) with a live status indicator
                       # (gray/green/orange); Device ID…/Diagnostics… dialogs
  registers_panel.py   # register table: per-row unit/poll/format/order/scaling,
                       # change highlighting, filter/sort, Enter = write,
                       # Mask write…/Read/Write… dialogs
  scanner_panel.py     # unit scanner + register address scan (separate window)
  log_panel.py         # log panel (hideable): Raw hex traffic toggle, Save…
  settings_store.py    # settings persistence in ~/.modbus_connector/settings.json
  session_widget.py # SessionWidget — one Modbus session (panels, scanner
                    # window, worker thread) as a self-contained widget
  main_window.py  # main window: sessions in tabs, File menu,
                  # status bar following the active tab
  app.py          # QApplication creation and startup
  __main__.py     # python -m modbus_connector
tests/
  conftest.py     # modbus_server fixture: test Modbus TCP server on 127.0.0.1
  test_models.py  # value parsing/formatting, exceptions, Stats
  test_backend.py # ModbusBackend against the test server
  test_registers_panel.py  # offscreen Qt tests for the register table
  test_session_widget.py   # session state round-trip and shutdown
  test_main_window_tabs.py # tab lifecycle and settings round-trip
Development
pytest          # tests
ruff check .    # lint
The backend tests start a real Modbus TCP server (pymodbus) on 127.0.0.1
with a free port and exercise read/write/scan through ModbusBackend.
CI
GitHub Actions (.github/workflows/build.yml) runs tests and builds artifacts
for all three OSes on macOS/Windows/Linux runners on every push to main:
modbus-connector-macos (DMG), modbus-connector-windows and
modbus-connector-linux (zip with the executable). Download them from the
workflow run page (Actions → a run → Artifacts; kept for 90 days); a build can
also be started manually via "Run workflow".
Pushing a v* tag (e.g. git tag v0.1.0 && git push origin v0.1.0)
automatically attaches the same files to a GitHub Release — a permanent
download page (Releases in the repository).
1 maintainer

Download files
Download the file for your platform. If you're not sure which to choose, learn more about installing packages.
Source Distribution
Built Distribution
Filter files by name, interpreter, ABI, and platform.
If you're not sure about the file name format, learn more about wheel file names.
Copy a direct link to the current filters
File details
Details for the file modbus_connector-0.8.2.tar.gz.
File metadata
- Download URL: modbus_connector-0.8.2.tar.gz
- Upload date:
- Size: 89.9 kB
- Tags: Source
- Uploaded using Trusted Publishing? Yes
- Uploaded via:
twine/7.0.0 CPython/3.13.14
File hashes
| Algorithm | Hash digest | |
|---|---|---|
| SHA256 |
186b199b8b43ad87287ed127c3180d6ac8ec65932bae4ac2bfd463d95336b5b5
|
|
| MD5 |
dd7649bcf4a1ae0f47e846f74a65f5f1
|
|
| BLAKE2b-256 |
648c14f8fb632806435ef949d1611de78a8907becd8fac016f517e1e5007b681
|
Provenance
The following attestation bundles were made for modbus_connector-0.8.2.tar.gz:
Publisher:
build.yml on cramen/modbus_connector
-
Statement:
-
Statement type:
https://in-toto.io/Statement/v1 -
Predicate type:
https://docs.pypi.org/attestations/publish/v1 -
Subject name:
modbus_connector-0.8.2.tar.gz -
Subject digest:
186b199b8b43ad87287ed127c3180d6ac8ec65932bae4ac2bfd463d95336b5b5 - Sigstore transparency entry: 2479573523
- Sigstore integration time:
-
Permalink:
cramen/modbus_connector@8adf5b39adc0e5b37f7f68d617f8b0e251dc522b -
Branch / Tag:
refs/tags/v0.8.2 - Owner: https://github.com/cramen
-
Access:
public
-
Token Issuer:
https://token.actions.githubusercontent.com -
Runner Environment:
github-hosted -
Publication workflow:
build.yml@8adf5b39adc0e5b37f7f68d617f8b0e251dc522b -
Trigger Event:
push
-
Statement type:
File details
Details for the file modbus_connector-0.8.2-py3-none-any.whl.
File metadata
- Download URL: modbus_connector-0.8.2-py3-none-any.whl
- Upload date:
- Size: 67.0 kB
- Tags: Python 3
- Uploaded using Trusted Publishing? Yes
- Uploaded via:
twine/7.0.0 CPython/3.13.14
File hashes
| Algorithm | Hash digest | |
|---|---|---|
| SHA256 |
b3753c8eb1b4c55e248bd3156bba7c5b0be0e7f452401dbc3705a72887f0ea44
|
|
| MD5 |
5bf976844639e188916f9589e0dd9229
|
|
| BLAKE2b-256 |
afcc8e507786465e50f07525a11417f85a29e6cc70c3543b4c02a894204cdfe2
|
Provenance
The following attestation bundles were made for modbus_connector-0.8.2-py3-none-any.whl:
Publisher:
build.yml on cramen/modbus_connector
-
Statement:
-
Statement type:
https://in-toto.io/Statement/v1 -
Predicate type:
https://docs.pypi.org/attestations/publish/v1 -
Subject name:
modbus_connector-0.8.2-py3-none-any.whl -
Subject digest:
b3753c8eb1b4c55e248bd3156bba7c5b0be0e7f452401dbc3705a72887f0ea44 - Sigstore transparency entry: 2479573568
- Sigstore integration time:
-
Permalink:
cramen/modbus_connector@8adf5b39adc0e5b37f7f68d617f8b0e251dc522b -
Branch / Tag:
refs/tags/v0.8.2 - Owner: https://github.com/cramen
-
Access:
public
-
Token Issuer:
https://token.actions.githubusercontent.com -
Runner Environment:
github-hosted -
Publication workflow:
build.yml@8adf5b39adc0e5b37f7f68d617f8b0e251dc522b -
Trigger Event:
push
-
Statement type:














